Indonesia Clay Products And Refractories Market (2026-2032) Outlook | Analysis, Growth, Share, Companies, Revenue, Value, Forecast, Trends, Industry & Size
Market Forecast By Type (Pottery, Ceramics, Plumbing Fixtures, Clay Building Material, Refractories), By Process (Grinding , Cutting , Mixing , Shaping, Honing), By Material (Quartz, Chamatte, Sand, Sawdust, Slag, Pulverized , Coal), By End-User Vertical (Construction , Automobiles , Steel Making , Cosmetics, Food Industry, Others) And Competitive Landscape
| Product Code: ETC319108 | Publication Date: Aug 2022 | Updated Date: Mar 2026 | Product Type: Market Research Report | |
| Publisher: 6Wresearch | Author: Ravi Bhandari | No. of Pages: 75 | No. of Figures: 35 | No. of Tables: 20 |
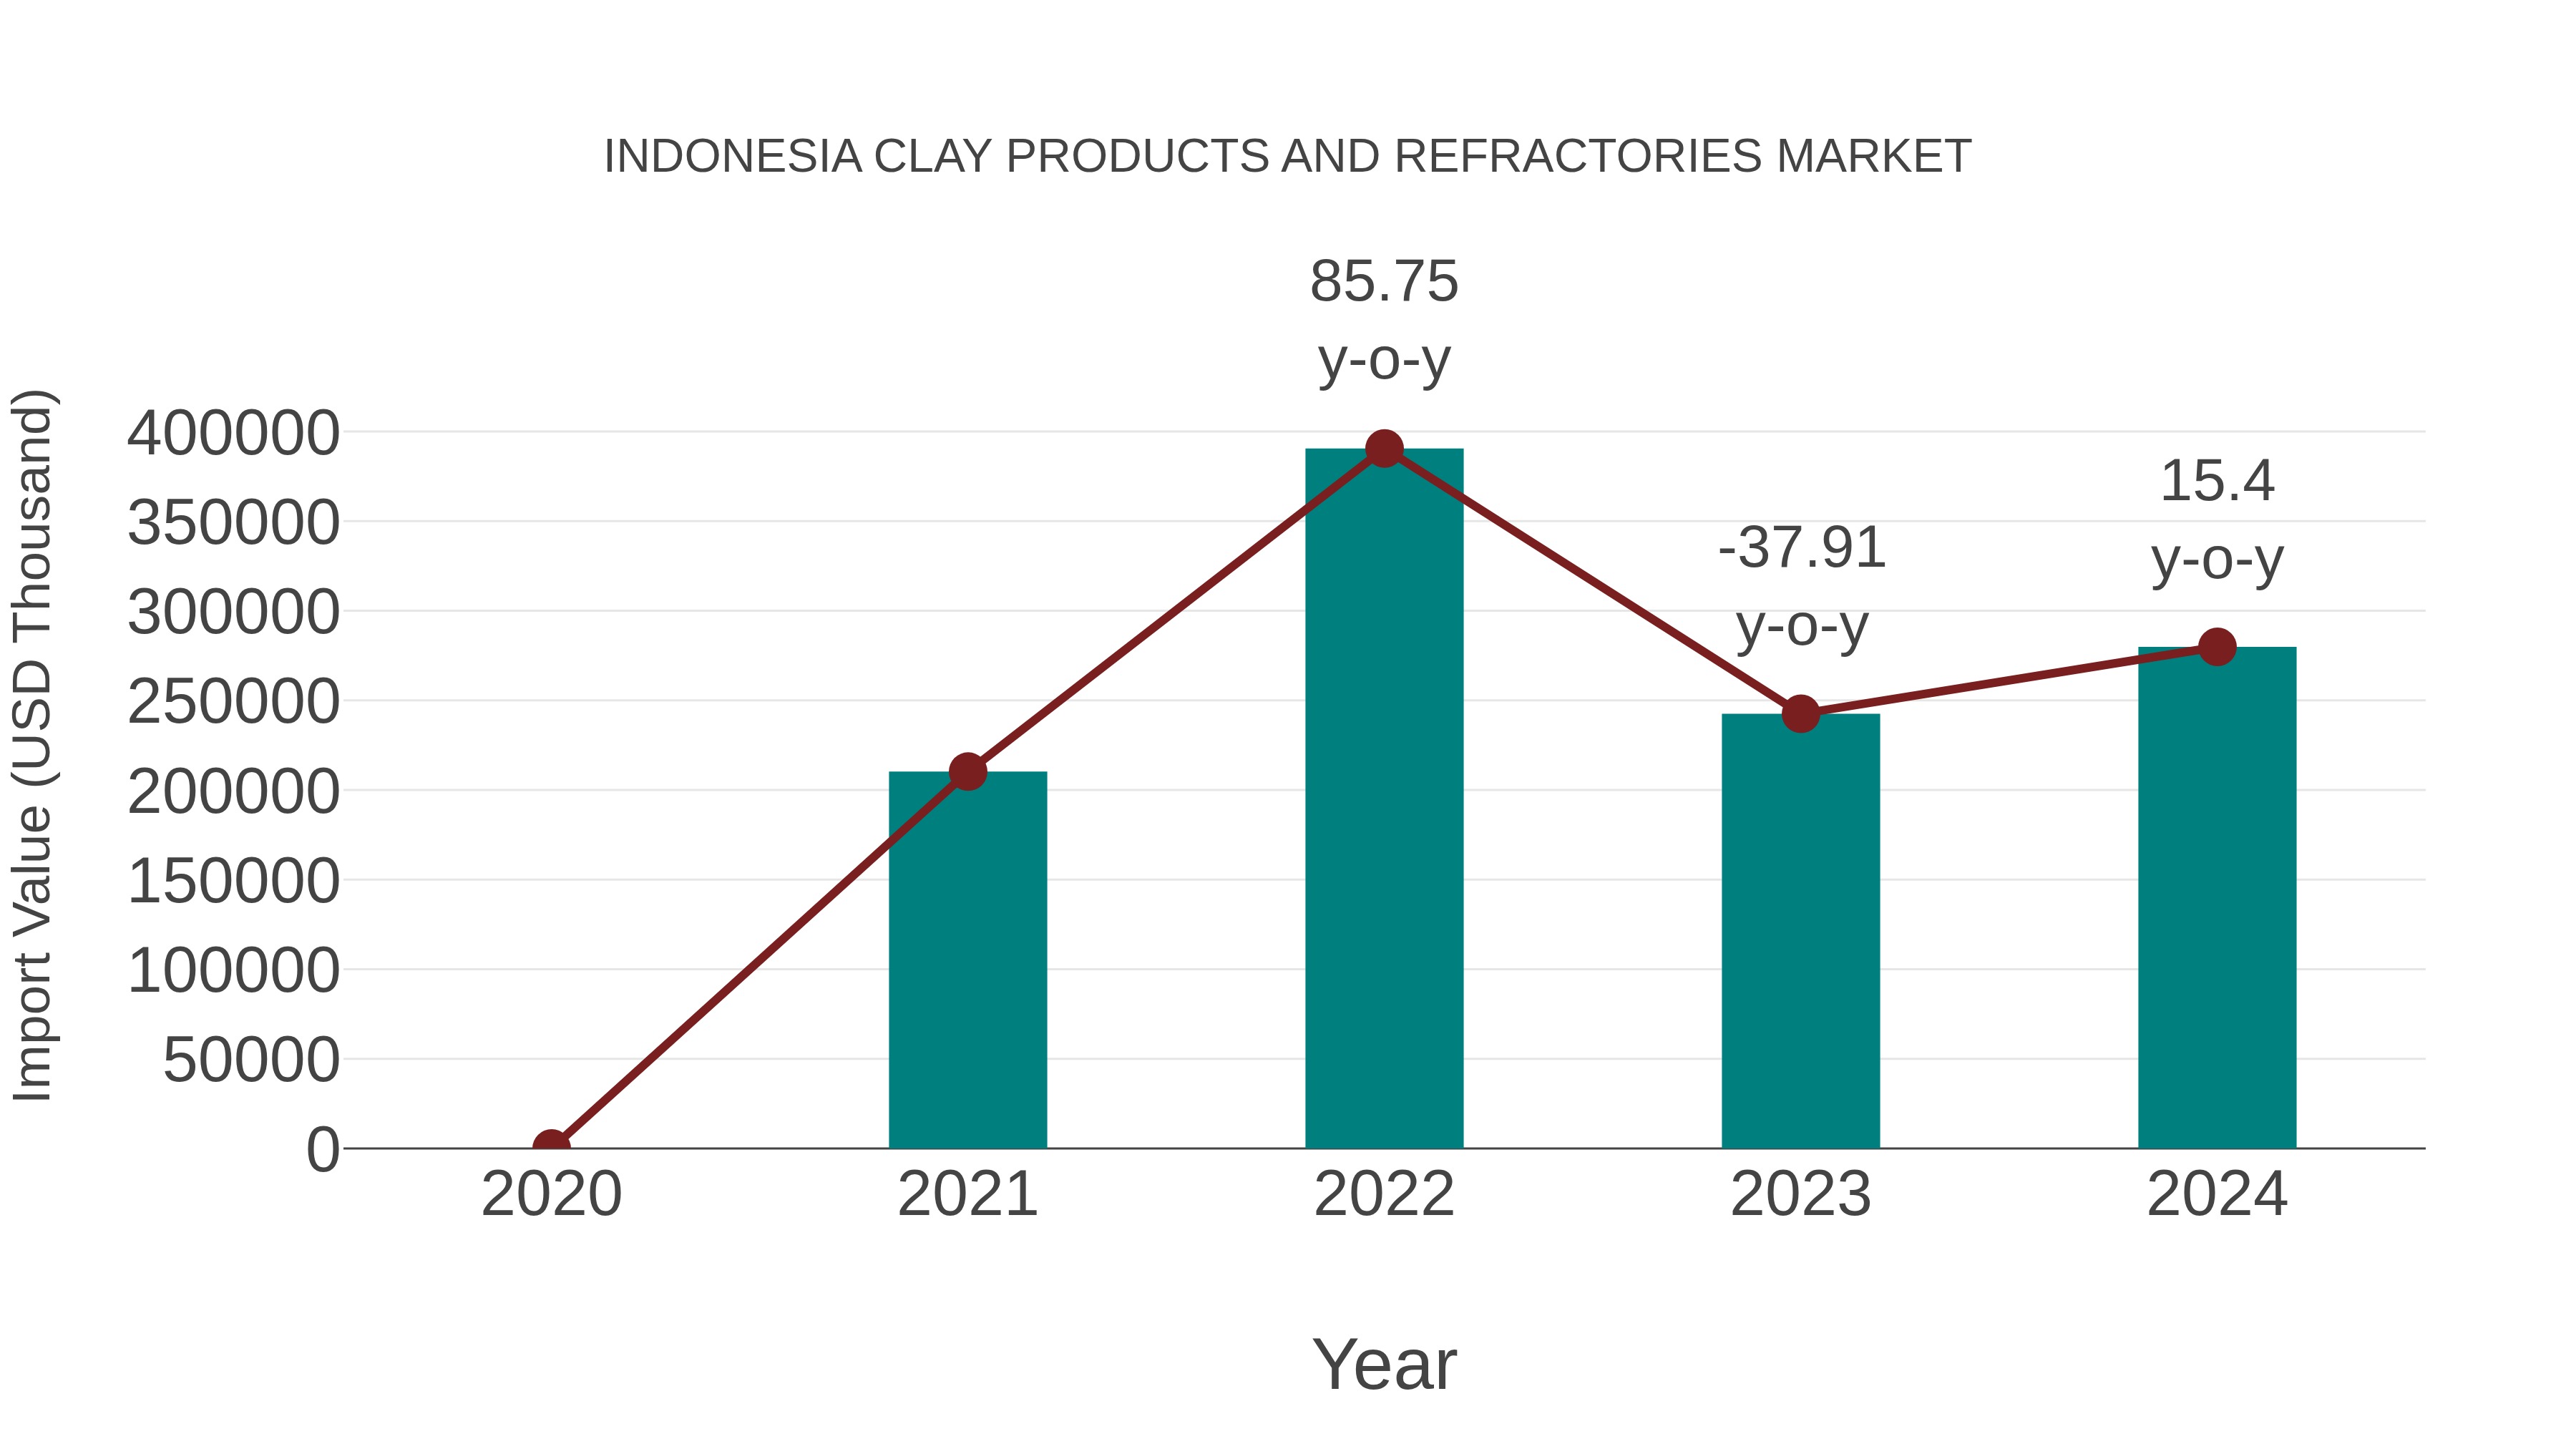
Indonesia Clay Products and Refractories Market: Import Trend Analysis
In the Indonesia clay products and refractories market, the import trend showed a notable growth rate of 15.4% from 2023 to 2024, with a compound annual growth rate (CAGR) of 10.0% for the period 2020-2024. This increase in import momentum can be attributed to a rising demand for these products within the region, indicating a positive market stability and sustained interest in Indonesian clay products and refractories.
Indonesia Clay Products And Refractories Market Synopsis
The Indonesia clay products & refractories market size was valued at USD xx million in 2025 and is projected to register a CAGR of x.x% over the forecast period with an estimated value of USD xx million by 2025 due to increasing infrastructural development activities across major cities. The Indonesian government?s initiative towards promoting industrialization through tax exemption or incentives along with numerous investments from foreign companies will support industry growth over next few years creating more opportunities for suppliers operating in this space. In addition, rising disposable income coupled with changing consumer preferences towards luxurious living standards will create new avenues for manufacturers producing designer tiles made from ceramic clays thus spurring overall industry expansion throughout the projected timeframe.
Drivers of the Market
The Indonesia Clay Products and Refractories market is poised for growth due to its applications in construction, ceramics, and high-temperature processes. Clay products, including bricks, tiles, and refractory materials, are crucial components in building construction and industrial operations. The country`s urbanization, infrastructure development, and industrial expansion contribute to the demand for these materials. The ceramics industry and the need for heat-resistant materials further support the market`s positive outlook. Collaborations between clay product manufacturers, construction firms, and industries requiring refractory solutions play a vital role in shaping the market`s development.
Challenges of the Market
The Indonesia Clay Products And Refractories Market are poised for growth in tandem with the construction sector. Challenges could stem from fluctuations in construction demand and competition from alternative building materials. To navigate these challenges, maintaining product quality, diversifying offerings, and exploring innovative construction applications will be essential.
COVID-19 Impact on the Market
Clay products and refractories have applications in industries like construction, manufacturing, and metallurgy. The market`s outlook is influenced by industrial demand and technological advancements. The pandemic`s impact on manufacturing and construction activities could have affected the market for clay products and refractories.
Key Players in the Market
The Indonesia clay products and refractories market serves industries like steel, cement, glass, and ceramics by providing heat-resistant materials. The market outlook depends on the growth of these industrial sectors and their need for reliable refractory products. Clay-based refractories play a crucial role in maintaining high-temperature environments. Key players in this market could encompass PT. Keramika Indonesia Assosiasi, PT. Tiga Rasa Indonesia, and PT. Refrasindo Mulia Industri.
Key Highlights of the Report:
- Indonesia Clay Products And Refractories Market Outlook
- Market Size of Indonesia Clay Products And Refractories Market, 2025
- Forecast of Indonesia Clay Products And Refractories Market, 2032
- Historical Data and Forecast of Indonesia Clay Products And Refractories Revenues & Volume for the Period 2022-2032F
- Indonesia Clay Products And Refractories Market Trend Evolution
- Indonesia Clay Products And Refractories Market Drivers and Challenges
- Indonesia Clay Products And Refractories Price Trends
- Indonesia Clay Products And Refractories Porter's Five Forces
- Indonesia Clay Products And Refractories Industry Life Cycle
- Historical Data and Forecast of Indonesia Clay Products And Refractories Market Revenues & Volume By Type for the Period 2022-2032F
- Historical Data and Forecast of Indonesia Clay Products And Refractories Market Revenues & Volume By Pottery for the Period 2022-2032F
- Historical Data and Forecast of Indonesia Clay Products And Refractories Market Revenues & Volume By Ceramics for the Period 2022-2032F
- Historical Data and Forecast of Indonesia Clay Products And Refractories Market Revenues & Volume By Plumbing Fixtures for the Period 2022-2032F
- Historical Data and Forecast of Indonesia Clay Products And Refractories Market Revenues & Volume By Clay Building Material for the Period 2022-2032F
- Historical Data and Forecast of Indonesia Clay Products And Refractories Market Revenues & Volume By Refractories for the Period 2022-2032F
- Historical Data and Forecast of Indonesia Clay Products And Refractories Market Revenues & Volume By Process for the Period 2022-2032F
- Historical Data and Forecast of Indonesia Clay Products And Refractories Market Revenues & Volume By Grinding for the Period 2022-2032F
- Historical Data and Forecast of Indonesia Clay Products And Refractories Market Revenues & Volume By Cutting for the Period 2022-2032F
- Historical Data and Forecast of Indonesia Clay Products And Refractories Market Revenues & Volume By Mixing for the Period 2022-2032F
- Historical Data and Forecast of Indonesia Clay Products And Refractories Market Revenues & Volume By Shaping for the Period 2022-2032F
- Historical Data and Forecast of Indonesia Clay Products And Refractories Market Revenues & Volume By Honing for the Period 2022-2032F
- Historical Data and Forecast of Indonesia Clay Products And Refractories Market Revenues & Volume By Material for the Period 2022-2032F
- Historical Data and Forecast of Indonesia Clay Products And Refractories Market Revenues & Volume By Quartz for the Period 2022-2032F
- Historical Data and Forecast of Indonesia Clay Products And Refractories Market Revenues & Volume By Chamatte for the Period 2022-2032F
- Historical Data and Forecast of Indonesia Clay Products And Refractories Market Revenues & Volume By Sand for the Period 2022-2032F
- Historical Data and Forecast of Indonesia Clay Products And Refractories Market Revenues & Volume By Sawdust for the Period 2022-2032F
- Historical Data and Forecast of Indonesia Clay Products And Refractories Market Revenues & Volume By Slag for the Period 2022-2032F
- Historical Data and Forecast of Indonesia Clay Products And Refractories Market Revenues & Volume By Pulverized for the Period 2022-2032F
- Historical Data and Forecast of Indonesia Clay Products And Refractories Market Revenues & Volume By Coal for the Period 2022-2032F
- Historical Data and Forecast of Indonesia Clay Products And Refractories Market Revenues & Volume By End-User Vertical for the Period 2022-2032F
- Historical Data and Forecast of Indonesia Clay Products And Refractories Market Revenues & Volume By Construction for the Period 2022-2032F
- Historical Data and Forecast of Indonesia Clay Products And Refractories Market Revenues & Volume By Automobiles for the Period 2022-2032F
- Historical Data and Forecast of Indonesia Clay Products And Refractories Market Revenues & Volume By Steel Making for the Period 2022-2032F
- Historical Data and Forecast of Indonesia Clay Products And Refractories Market Revenues & Volume By Cosmetics for the Period 2022-2032F
- Historical Data and Forecast of Indonesia Clay Products And Refractories Market Revenues & Volume By Food Industry for the Period 2022-2032F
- Historical Data and Forecast of Indonesia Clay Products And Refractories Market Revenues & Volume By Others for the Period 2022-2032F
- Indonesia Clay Products And Refractories Import Export Trade Statistics
- Market Opportunity Assessment By Type
- Market Opportunity Assessment By Process
- Market Opportunity Assessment By Material
- Market Opportunity Assessment By End-User Vertical
- Indonesia Clay Products And Refractories Top Companies Market Share
- Indonesia Clay Products And Refractories Competitive Benchmarking By Technical and Operational Parameters
- Indonesia Clay Products And Refractories Company Profiles
- Indonesia Clay Products And Refractories Key Strategic Recommendations
Indonesia Clay Products And Refractories Market (2026-2032): FAQs
6Wresearch actively monitors the Indonesia Clay Products And Refractories Market and publishes its comprehensive annual report, highlighting emerging trends, growth drivers, revenue analysis, and forecast outlook. Our insights help businesses to make data-backed strategic decisions with ongoing market dynamics. Our analysts track relevent industries related to the Indonesia Clay Products And Refractories Market, allowing our clients with actionable intelligence and reliable forecasts tailored to emerging regional needs.
Yes, we provide customisation as per your requirements. To learn more, feel free to contact us on sales@6wresearch.com
1 Executive Summary |
2 Introduction |
2.1 Key Highlights of the Report |
2.2 Report Description |
2.3 Market Scope & Segmentation |
2.4 Research Methodology |
2.5 Assumptions |
3 Indonesia Clay Products And Refractories Market Overview |
3.1 Indonesia Country Macro Economic Indicators |
3.2 Indonesia Clay Products And Refractories Market Revenues & Volume, 2022 & 2032F |
3.3 Indonesia Clay Products And Refractories Market - Industry Life Cycle |
3.4 Indonesia Clay Products And Refractories Market - Porter's Five Forces |
3.5 Indonesia Clay Products And Refractories Market Revenues & Volume Share, By Type, 2022 & 2032F |
3.6 Indonesia Clay Products And Refractories Market Revenues & Volume Share, By Process , 2022 & 2032F |
3.7 Indonesia Clay Products And Refractories Market Revenues & Volume Share, By Material , 2022 & 2032F |
3.8 Indonesia Clay Products And Refractories Market Revenues & Volume Share, By End-User Vertical , 2022 & 2032F |
4 Indonesia Clay Products And Refractories Market Dynamics |
4.1 Impact Analysis |
4.2 Market Drivers |
4.2.1 Growing construction industry in Indonesia leading to increased demand for clay products and refractories. |
4.2.2 Infrastructure development projects driving the demand for clay products and refractories. |
4.2.3 Rising focus on energy efficiency and sustainability, leading to increased adoption of refractories in industrial applications. |
4.3 Market Restraints |
4.3.1 Fluctuating raw material prices impacting the production cost of clay products and refractories. |
4.3.2 Intense competition from alternative materials affecting the market growth. |
5 Indonesia Clay Products And Refractories Market Trends |
6 Indonesia Clay Products And Refractories Market, By Types |
6.1 Indonesia Clay Products And Refractories Market, By Type |
6.1.1 Overview and Analysis |
6.1.2 Indonesia Clay Products And Refractories Market Revenues & Volume, By Type, 2022-2032F |
6.1.3 Indonesia Clay Products And Refractories Market Revenues & Volume, By Pottery, 2022-2032F |
6.1.4 Indonesia Clay Products And Refractories Market Revenues & Volume, By Ceramics, 2022-2032F |
6.1.5 Indonesia Clay Products And Refractories Market Revenues & Volume, By Plumbing Fixtures, 2022-2032F |
6.1.6 Indonesia Clay Products And Refractories Market Revenues & Volume, By Clay Building Material, 2022-2032F |
6.1.7 Indonesia Clay Products And Refractories Market Revenues & Volume, By Refractories, 2022-2032F |
6.2 Indonesia Clay Products And Refractories Market, By Process |
6.2.1 Overview and Analysis |
6.2.2 Indonesia Clay Products And Refractories Market Revenues & Volume, By Grinding , 2022-2032F |
6.2.3 Indonesia Clay Products And Refractories Market Revenues & Volume, By Cutting , 2022-2032F |
6.2.4 Indonesia Clay Products And Refractories Market Revenues & Volume, By Mixing , 2022-2032F |
6.2.5 Indonesia Clay Products And Refractories Market Revenues & Volume, By Shaping, 2022-2032F |
6.2.6 Indonesia Clay Products And Refractories Market Revenues & Volume, By Honing, 2022-2032F |
6.3 Indonesia Clay Products And Refractories Market, By Material |
6.3.1 Overview and Analysis |
6.3.2 Indonesia Clay Products And Refractories Market Revenues & Volume, By Quartz, 2022-2032F |
6.3.3 Indonesia Clay Products And Refractories Market Revenues & Volume, By Chamatte, 2022-2032F |
6.3.4 Indonesia Clay Products And Refractories Market Revenues & Volume, By Sand, 2022-2032F |
6.3.5 Indonesia Clay Products And Refractories Market Revenues & Volume, By Sawdust, 2022-2032F |
6.3.6 Indonesia Clay Products And Refractories Market Revenues & Volume, By Slag, 2022-2032F |
6.3.7 Indonesia Clay Products And Refractories Market Revenues & Volume, By Pulverized , 2022-2032F |
6.4 Indonesia Clay Products And Refractories Market, By End-User Vertical |
6.4.1 Overview and Analysis |
6.4.2 Indonesia Clay Products And Refractories Market Revenues & Volume, By Construction , 2022-2032F |
6.4.3 Indonesia Clay Products And Refractories Market Revenues & Volume, By Automobiles , 2022-2032F |
6.4.4 Indonesia Clay Products And Refractories Market Revenues & Volume, By Steel Making , 2022-2032F |
6.4.5 Indonesia Clay Products And Refractories Market Revenues & Volume, By Cosmetics, 2022-2032F |
6.4.6 Indonesia Clay Products And Refractories Market Revenues & Volume, By Food Industry, 2022-2032F |
6.4.7 Indonesia Clay Products And Refractories Market Revenues & Volume, By Others, 2022-2032F |
7 Indonesia Clay Products And Refractories Market Import-Export Trade Statistics |
7.1 Indonesia Clay Products And Refractories Market Export to Major Countries |
7.2 Indonesia Clay Products And Refractories Market Imports from Major Countries |
8 Indonesia Clay Products And Refractories Market Key Performance Indicators |
8.1 Energy efficiency improvements in manufacturing processes. |
8.2 Adoption rate of refractories in key industries. |
8.3 Investment in RD for product innovation and development. |
8.4 Environmental sustainability measures implemented by companies in the industry. |
9 Indonesia Clay Products And Refractories Market - Opportunity Assessment |
9.1 Indonesia Clay Products And Refractories Market Opportunity Assessment, By Type, 2022 & 2032F |
9.2 Indonesia Clay Products And Refractories Market Opportunity Assessment, By Process , 2022 & 2032F |
9.3 Indonesia Clay Products And Refractories Market Opportunity Assessment, By Material , 2022 & 2032F |
9.4 Indonesia Clay Products And Refractories Market Opportunity Assessment, By End-User Vertical , 2022 & 2032F |
10 Indonesia Clay Products And Refractories Market - Competitive Landscape |
10.1 Indonesia Clay Products And Refractories Market Revenue Share, By Companies, 2025 |
10.2 Indonesia Clay Products And Refractories Market Competitive Benchmarking, By Operating and Technical Parameters |
11 Company Profiles |
12 Recommendations |
13 Disclaimer |
Global Go To Market Strategy - 2030
Export potential enables firms to identify high-growth global markets with greater confidence by combining advanced trade intelligence with a structured quantitative methodology. The framework analyzes emerging demand trends and country-level import patterns while integrating macroeconomic and trade datasets such as GDP and population forecasts, bilateral import–export flows, tariff structures, elasticity differentials between developed and developing economies, geographic distance, and import demand projections. Using weighted trade values from 2020–2024 as the base period to project country-to-country export potential for 2030, these inputs are operationalized through calculated drivers such as gravity model parameters, tariff impact factors, and projected GDP per-capita growth. Through an analysis of hidden potentials, demand hotspots, and market conditions that are most favorable to success, this method enables firms to focus on target countries, maximize returns, and global expansion with data, backed by accuracy.
By factoring in the projected importer demand gap that is currently unmet and could be potential opportunity, it identifies the potential for the Exporter (Country) among 190 countries, against the general trade analysis, which identifies the biggest importer or exporter.
To discover high-growth global markets and optimize your business strategy:
Click Here
Pricing
- Single User License$ 1,995
- Department License$ 2,400
- Site License$ 3,120
- Global License$ 3,795

Leadership Perspectives from Industry Events
Search
Thought Leadership and Analyst Meet


Our Clients
6WResearch In News
- India Air Conditioner Market Set for Strong Rebound in 2026 After Weather-Led Correction and GST-Driven Recovery: 6Wresearch
- ADAS in India: How Automatic Emergency Braking, Blind Spot Detection & Driver Monitoring are Transforming Road Safety
- Doha a strategic location for EV manufacturing hub: IPA Qatar
- Demand for luxury TVs surging in the GCC, says Samsung
- Empowering Growth: The Thriving Journey of Bangladesh’s Cable Industry
- Demand for luxury TVs surging in the GCC, says Samsung
Latest Reports
- Nicaragua RPG Gaming Market (2026-2032)
- New Zealand RPG Gaming Market (2026-2032)
- Netherlands RPG Gaming Market (2026-2032)
- Nauru RPG Gaming Market (2026-2032)
- Namibia RPG Gaming Market (2026-2032)
- Mozambique RPG Gaming Market (2026-2032)
- Montenegro RPG Gaming Market (2026-2032)
- Mongolia RPG Gaming Market (2026-2032)
- Monaco RPG Gaming Market (2026-2032)
- Micronesia RPG Gaming Market (2026-2032)
Industry Events and Analyst Meet

EV India Expo 2026

HIMTEX 2026

India Refining Summit 2026

India EV Show 2026

EV tech India Expo 2026
Whitepaper
- Middle East & Africa Commercial Security Market Click here to view more.
- Middle East & Africa Fire Safety Systems & Equipment Market Click here to view more.
- GCC Drone Market Click here to view more.
- Middle East Lighting Fixture Market Click here to view more.
- GCC Physical & Perimeter Security Market Click here to view more.