Indonesia Decorations and Inclusions Market (2026-2032) | Growth, Size & Revenue, Industry, Share, Segmentation, Value, Competitive Landscape, Companies, Analysis, Trends, Forecast, Outlook
Market Forecast By End-User (Food and Beverage Processing, Bakeries and Pastry Shops, Confectionery Shops, Restaurants and Hotels, Household), By Product Type (Chocolate Sprinkles and Inclusions, Chocolate Shapes, Chocolate Cups and Shells, Sugar Sprinkles and Inclusions, Sugar Shapes, Preserved/Dried Fruit Pieces, Sweetened/Caramelised Nuts, Roasted Nuts), By Distribution Channel (Direct Sales/B2B, Indirect Sales/B2C) And Competitive Landscape
| Product Code: ETC7563099 | Publication Date: Sep 2024 | Updated Date: Feb 2026 | Product Type: Market Research Report | |
| Publisher: 6Wresearch | Author: Sumit Sagar | No. of Pages: 75 | No. of Figures: 35 | No. of Tables: 20 |
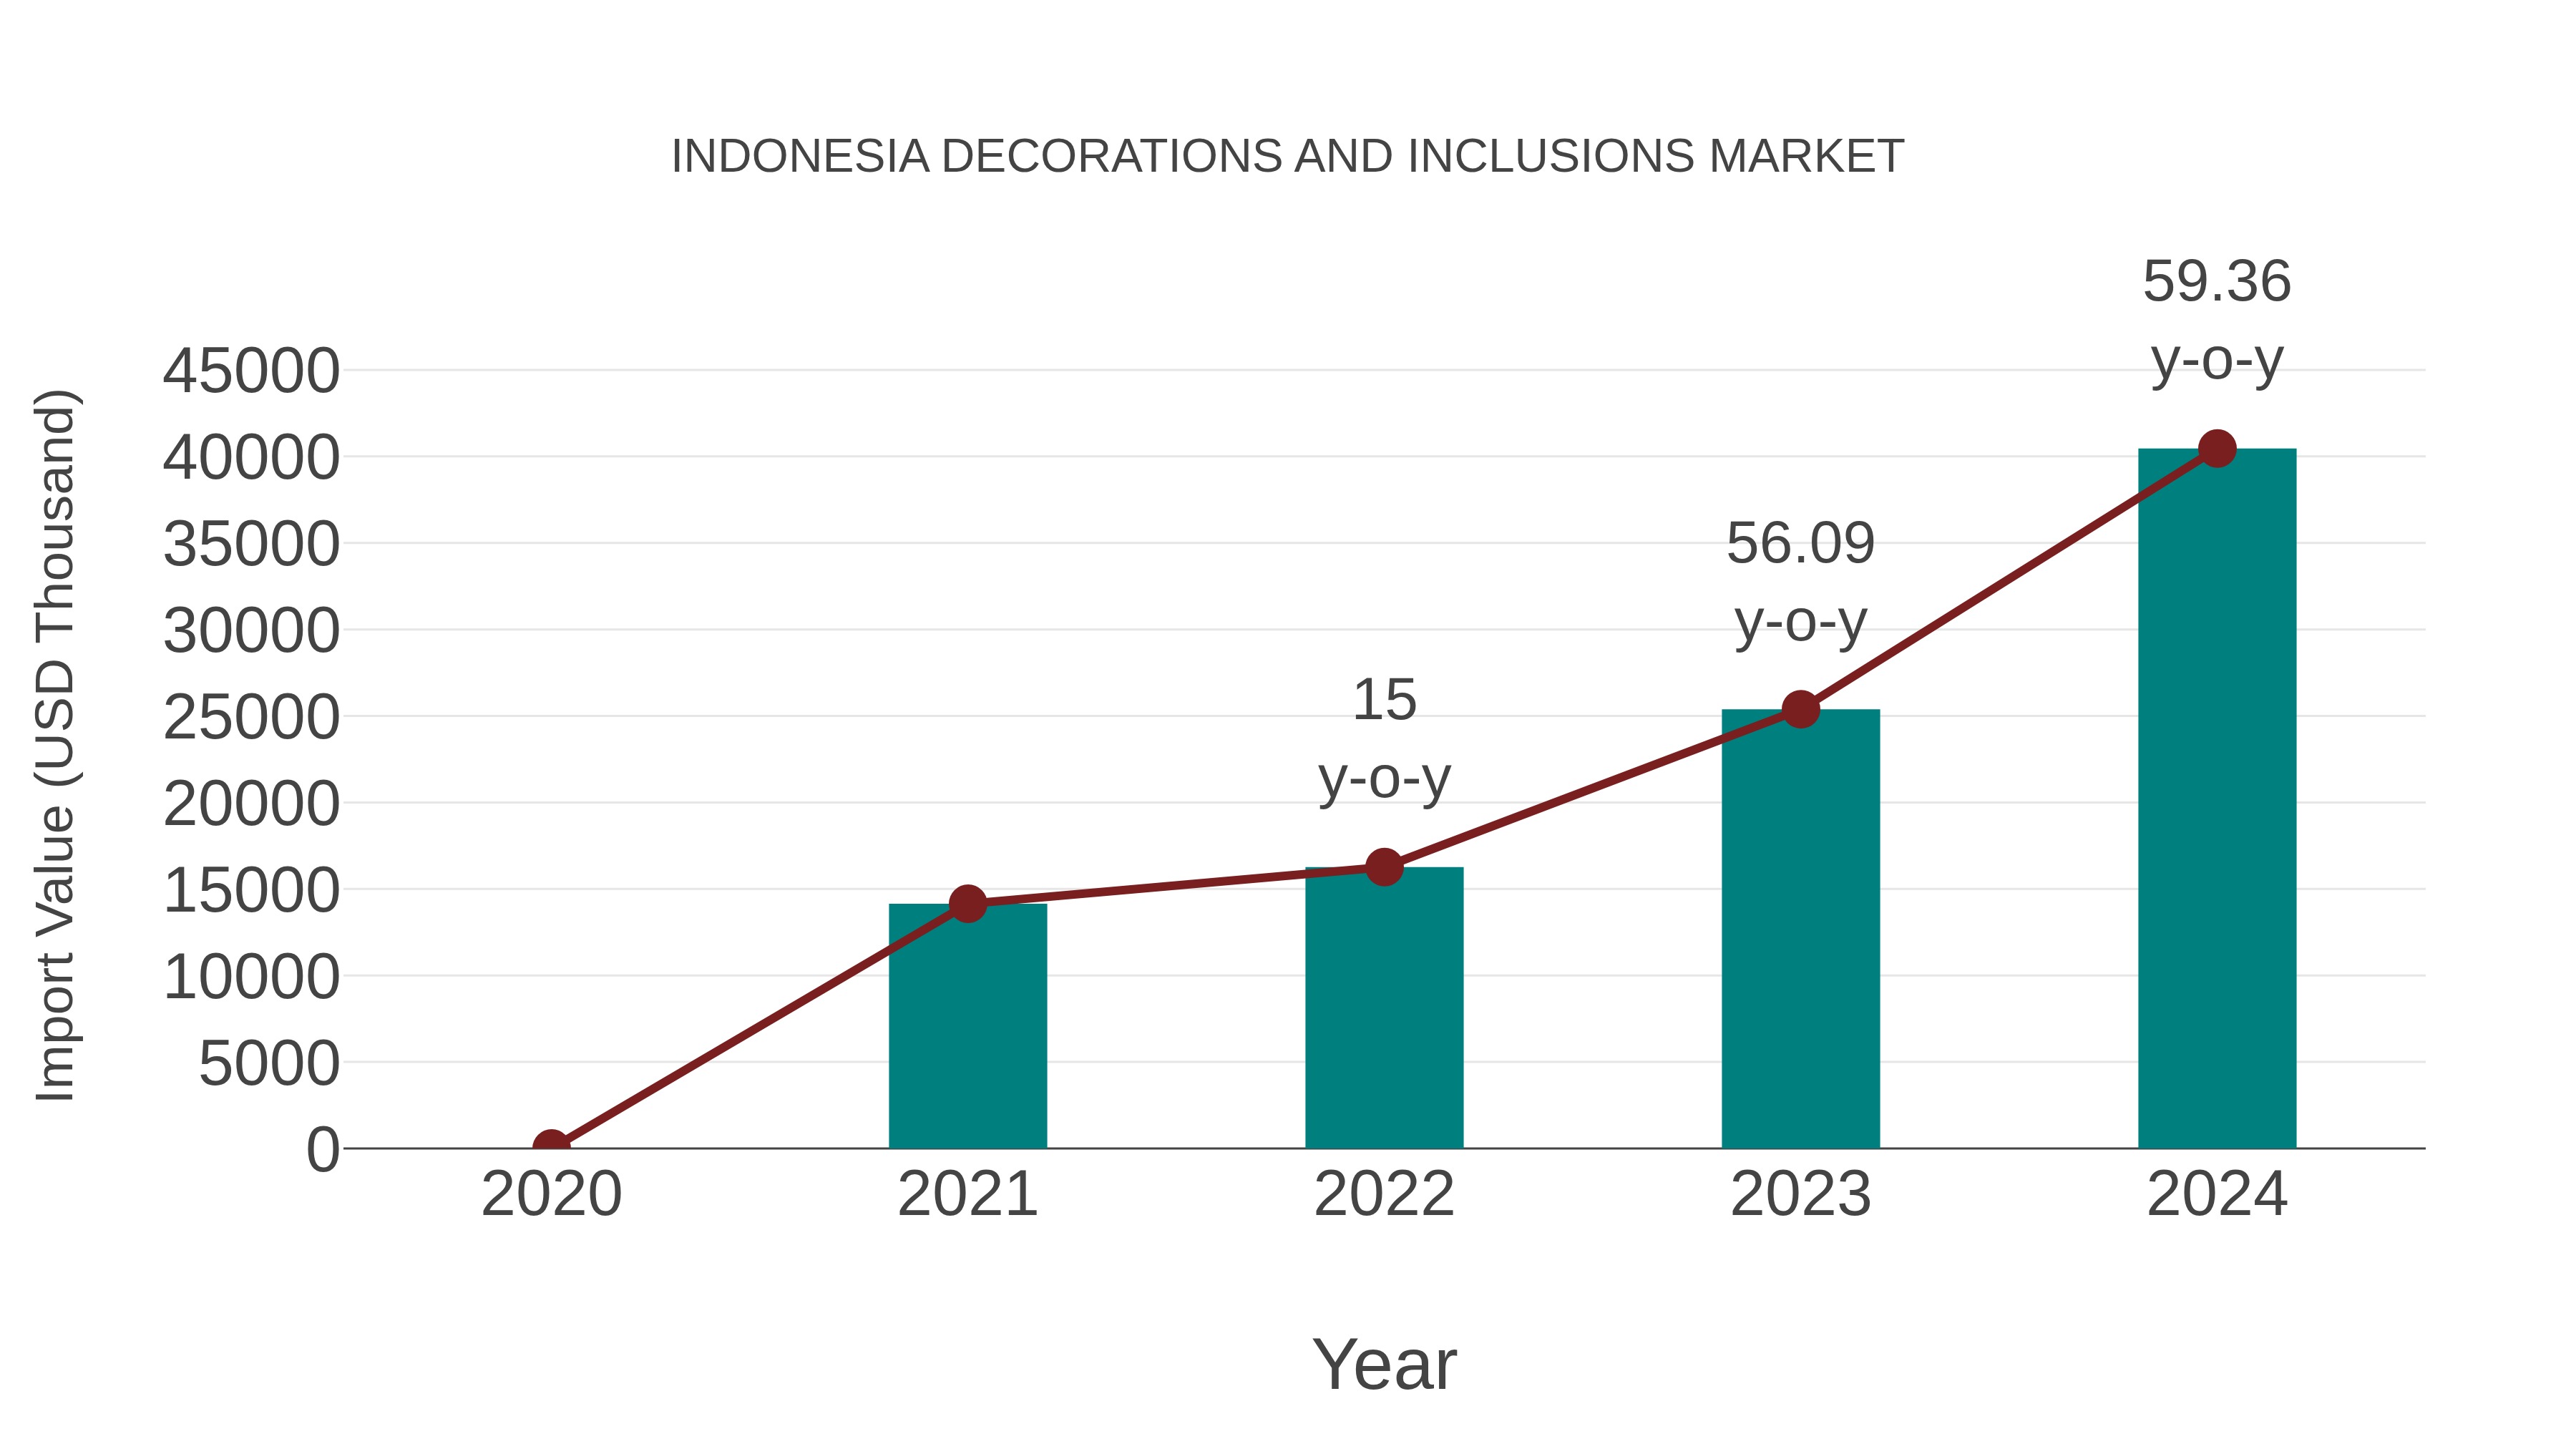
Indonesia Decorations and Inclusions Market: Import Trend Analysis
In the Indonesia decorations and inclusions market, the import trend experienced significant growth from 2023 to 2024, with a growth rate of 59.36%. The compound annual growth rate (CAGR) for the period of 2020-2024 stood at 41.95%. This impressive import momentum can be attributed to shifting consumer preferences towards unique and culturally diverse decorations, driving increased demand for imported products in the market.
Key Highlights of the Report:
- Indonesia Decorations and Inclusions Market Outlook
- Market Size of Indonesia Decorations and Inclusions Market, 2025
- Forecast of Indonesia Decorations and Inclusions Market, 2032
- Historical Data and Forecast of Indonesia Decorations and Inclusions Revenues & Volume for the Period 2022-2032F
- Indonesia Decorations and Inclusions Market Trend Evolution
- Indonesia Decorations and Inclusions Market Drivers and Challenges
- Indonesia Decorations and Inclusions Price Trends
- Indonesia Decorations and Inclusions Porter's Five Forces
- Indonesia Decorations and Inclusions Industry Life Cycle
- Historical Data and Forecast of Indonesia Decorations and Inclusions Market Revenues & Volume By End-User for the Period 2022-2032F
- Historical Data and Forecast of Indonesia Decorations and Inclusions Market Revenues & Volume By Food and Beverage Processing for the Period 2022-2032F
- Historical Data and Forecast of Indonesia Decorations and Inclusions Market Revenues & Volume By Bakeries and Pastry Shops for the Period 2022-2032F
- Historical Data and Forecast of Indonesia Decorations and Inclusions Market Revenues & Volume By Confectionery Shops for the Period 2022-2032F
- Historical Data and Forecast of Indonesia Decorations and Inclusions Market Revenues & Volume By Restaurants and Hotels for the Period 2022-2032F
- Historical Data and Forecast of Indonesia Decorations and Inclusions Market Revenues & Volume By Household for the Period 2022-2032F
- Historical Data and Forecast of Indonesia Decorations and Inclusions Market Revenues & Volume By Product Type for the Period 2022-2032F
- Historical Data and Forecast of Indonesia Decorations and Inclusions Market Revenues & Volume By Chocolate Sprinkles and Inclusions for the Period 2022-2032F
- Historical Data and Forecast of Indonesia Decorations and Inclusions Market Revenues & Volume By Chocolate Shapes for the Period 2022-2032F
- Historical Data and Forecast of Indonesia Decorations and Inclusions Market Revenues & Volume By Chocolate Cups and Shells for the Period 2022-2032F
- Historical Data and Forecast of Indonesia Decorations and Inclusions Market Revenues & Volume By Sugar Sprinkles and Inclusions for the Period 2022-2032F
- Historical Data and Forecast of Indonesia Decorations and Inclusions Market Revenues & Volume By Sugar Shapes for the Period 2022-2032F
- Historical Data and Forecast of Indonesia Decorations and Inclusions Market Revenues & Volume By Preserved/Dried Fruit Pieces for the Period 2022-2032F
- Historical Data and Forecast of Indonesia Decorations and Inclusions Market Revenues & Volume By Sweetened/Caramelised Nuts for the Period 2022-2032F
- Historical Data and Forecast of Indonesia Decorations and Inclusions Market Revenues & Volume By Roasted Nuts for the Period 2022-2032F
- Historical Data and Forecast of Indonesia Decorations and Inclusions Market Revenues & Volume By Distribution Channel for the Period 2022-2032F
- Historical Data and Forecast of Indonesia Decorations and Inclusions Market Revenues & Volume By Direct Sales/B2B for the Period 2022-2032F
- Historical Data and Forecast of Indonesia Decorations and Inclusions Market Revenues & Volume By Indirect Sales/B2C for the Period 2022-2032F
- Indonesia Decorations and Inclusions Import Export Trade Statistics
- Market Opportunity Assessment By End-User
- Market Opportunity Assessment By Product Type
- Market Opportunity Assessment By Distribution Channel
- Indonesia Decorations and Inclusions Top Companies Market Share
- Indonesia Decorations and Inclusions Competitive Benchmarking By Technical and Operational Parameters
- Indonesia Decorations and Inclusions Company Profiles
- Indonesia Decorations and Inclusions Key Strategic Recommendations
Frequently Asked Questions About the Market Study (FAQs):
6Wresearch actively monitors the Indonesia Decorations and Inclusions Market and publishes its comprehensive annual report, highlighting emerging trends, growth drivers, revenue analysis, and forecast outlook. Our insights help businesses to make data-backed strategic decisions with ongoing market dynamics. Our analysts track relevent industries related to the Indonesia Decorations and Inclusions Market, allowing our clients with actionable intelligence and reliable forecasts tailored to emerging regional needs.
Yes, we provide customisation as per your requirements. To learn more, feel free to contact us on sales@6wresearch.com
1 Executive Summary |
2 Introduction |
2.1 Key Highlights of the Report |
2.2 Report Description |
2.3 Market Scope & Segmentation |
2.4 Research Methodology |
2.5 Assumptions |
3 Indonesia Decorations and Inclusions Market Overview |
3.1 Indonesia Country Macro Economic Indicators |
3.2 Indonesia Decorations and Inclusions Market Revenues & Volume, 2022 & 2032F |
3.3 Indonesia Decorations and Inclusions Market - Industry Life Cycle |
3.4 Indonesia Decorations and Inclusions Market - Porter's Five Forces |
3.5 Indonesia Decorations and Inclusions Market Revenues & Volume Share, By End-User, 2022 & 2032F |
3.6 Indonesia Decorations and Inclusions Market Revenues & Volume Share, By Product Type, 2022 & 2032F |
3.7 Indonesia Decorations and Inclusions Market Revenues & Volume Share, By Distribution Channel, 2022 & 2032F |
4 Indonesia Decorations and Inclusions Market Dynamics |
4.1 Impact Analysis |
4.2 Market Drivers |
4.2.1 Growing disposable income of consumers in Indonesia leading to increased spending on decorations and inclusions. |
4.2.2 Rising trend of urbanization and modernization driving the demand for innovative and aesthetic decoration products. |
4.2.3 Influence of social media and online platforms promoting awareness and interest in home decor and interior design. |
4.3 Market Restraints |
4.3.1 Economic instability or fluctuations affecting consumer purchasing power and willingness to invest in decorations. |
4.3.2 Competition from imported products and international brands impacting the market share of local decorations and inclusions. |
4.3.3 Lack of skilled labor and resources for producing high-quality, unique decorations leading to limited product offerings. |
5 Indonesia Decorations and Inclusions Market Trends |
6 Indonesia Decorations and Inclusions Market, By Types |
6.1 Indonesia Decorations and Inclusions Market, By End-User |
6.1.1 Overview and Analysis |
6.1.2 Indonesia Decorations and Inclusions Market Revenues & Volume, By End-User, 2022-2032F |
6.1.3 Indonesia Decorations and Inclusions Market Revenues & Volume, By Food and Beverage Processing, 2022-2032F |
6.1.4 Indonesia Decorations and Inclusions Market Revenues & Volume, By Bakeries and Pastry Shops, 2022-2032F |
6.1.5 Indonesia Decorations and Inclusions Market Revenues & Volume, By Confectionery Shops, 2022-2032F |
6.1.6 Indonesia Decorations and Inclusions Market Revenues & Volume, By Restaurants and Hotels, 2022-2032F |
6.1.7 Indonesia Decorations and Inclusions Market Revenues & Volume, By Household, 2022-2032F |
6.2 Indonesia Decorations and Inclusions Market, By Product Type |
6.2.1 Overview and Analysis |
6.2.2 Indonesia Decorations and Inclusions Market Revenues & Volume, By Chocolate Sprinkles and Inclusions, 2022-2032F |
6.2.3 Indonesia Decorations and Inclusions Market Revenues & Volume, By Chocolate Shapes, 2022-2032F |
6.2.4 Indonesia Decorations and Inclusions Market Revenues & Volume, By Chocolate Cups and Shells, 2022-2032F |
6.2.5 Indonesia Decorations and Inclusions Market Revenues & Volume, By Sugar Sprinkles and Inclusions, 2022-2032F |
6.2.6 Indonesia Decorations and Inclusions Market Revenues & Volume, By Sugar Shapes, 2022-2032F |
6.2.7 Indonesia Decorations and Inclusions Market Revenues & Volume, By Preserved/Dried Fruit Pieces, 2022-2032F |
6.2.8 Indonesia Decorations and Inclusions Market Revenues & Volume, By Roasted Nuts, 2022-2032F |
6.2.9 Indonesia Decorations and Inclusions Market Revenues & Volume, By Roasted Nuts, 2022-2032F |
6.3 Indonesia Decorations and Inclusions Market, By Distribution Channel |
6.3.1 Overview and Analysis |
6.3.2 Indonesia Decorations and Inclusions Market Revenues & Volume, By Direct Sales/B2B, 2022-2032F |
6.3.3 Indonesia Decorations and Inclusions Market Revenues & Volume, By Indirect Sales/B2C, 2022-2032F |
7 Indonesia Decorations and Inclusions Market Import-Export Trade Statistics |
7.1 Indonesia Decorations and Inclusions Market Export to Major Countries |
7.2 Indonesia Decorations and Inclusions Market Imports from Major Countries |
8 Indonesia Decorations and Inclusions Market Key Performance Indicators |
8.1 Customer engagement metrics such as website traffic, social media followers, and engagement rates to measure the level of interest and interaction with decoration products. |
8.2 Customer satisfaction scores and feedback to gauge the quality and appeal of decorations and inclusions in the market. |
8.3 Trend analysis of popular decoration styles, colors, and themes to understand consumer preferences and adapt product offerings accordingly. |
9 Indonesia Decorations and Inclusions Market - Opportunity Assessment |
9.1 Indonesia Decorations and Inclusions Market Opportunity Assessment, By End-User, 2022 & 2032F |
9.2 Indonesia Decorations and Inclusions Market Opportunity Assessment, By Product Type, 2022 & 2032F |
9.3 Indonesia Decorations and Inclusions Market Opportunity Assessment, By Distribution Channel, 2022 & 2032F |
10 Indonesia Decorations and Inclusions Market - Competitive Landscape |
10.1 Indonesia Decorations and Inclusions Market Revenue Share, By Companies, 2025 |
10.2 Indonesia Decorations and Inclusions Market Competitive Benchmarking, By Operating and Technical Parameters |
11 Company Profiles |
12 Recommendations |
13 Disclaimer |
Export potential assessment - trade Analytics for 2030
Export potential enables firms to identify high-growth global markets with greater confidence by combining advanced trade intelligence with a structured quantitative methodology. The framework analyzes emerging demand trends and country-level import patterns while integrating macroeconomic and trade datasets such as GDP and population forecasts, bilateral import–export flows, tariff structures, elasticity differentials between developed and developing economies, geographic distance, and import demand projections. Using weighted trade values from 2020–2024 as the base period to project country-to-country export potential for 2030, these inputs are operationalized through calculated drivers such as gravity model parameters, tariff impact factors, and projected GDP per-capita growth. Through an analysis of hidden potentials, demand hotspots, and market conditions that are most favorable to success, this method enables firms to focus on target countries, maximize returns, and global expansion with data, backed by accuracy.
By factoring in the projected importer demand gap that is currently unmet and could be potential opportunity, it identifies the potential for the Exporter (Country) among 190 countries, against the general trade analysis, which identifies the biggest importer or exporter.
To discover high-growth global markets and optimize your business strategy:
Click Here
Pricing
- Single User License$ 1,995
- Department License$ 2,400
- Site License$ 3,120
- Global License$ 3,795

Search
Thought Leadership and Analyst Meet


Our Clients
Latest Reports
- United Kingdom (UK) Outdoor Cooking Equipment Market (2026-2032) | Investment Opportunities, Outlook, Growth, Competition, Trends, Pricing, Demand, Insights, Challenges, Drivers, Size, Restraints, segmentation, Value, Share, Forecast, Companies, Analysis, Revenue, Strategy
- United Arab Emirates (UAE) Outdoor Cooking Equipment Market (2026-2032) | Challenges, Value, Restraints, Growth, Competition, Revenue, Trends, Outlook, Analysis, Drivers, Share, Investment Opportunities, Strategy, Demand, Companies, Forecast, Pricing, segmentation, Size, Insights
- Vietnam Outdoor Cooking Equipment Market (2026-2032) | Demand, Investment Opportunities, Growth, Pricing, Trends, Restraints, Competition, Outlook, Drivers, Strategy, Challenges, Revenue, Analysis, segmentation, Value, Size, Share, Insights, Companies, Forecast
- Venezuela Outdoor Cooking Equipment Market (2026-2032) | Challenges, Revenue, Demand, Value, Pricing, Strategy, Competition, Analysis, Companies, Insights, Growth, Outlook, Forecast, Size, Restraints, segmentation, Drivers, Trends, Investment Opportunities, Share
- Uganda Outdoor Cooking Equipment Market (2026-2032) | Drivers, Pricing, Challenges, Value, Growth, Companies, segmentation, Strategy, Analysis, Demand, Outlook, Size, Competition, Restraints, Revenue, Forecast, Investment Opportunities, Insights, Trends, Share
- Turkey Outdoor Cooking Equipment Market (2026-2032) | Size, Competition, Outlook, Strategy, Forecast, Drivers, Trends, Companies, Revenue, Growth, Analysis, segmentation, Insights, Pricing, Restraints, Demand, Investment Opportunities, Value, Share, Challenges
- Tunisia Outdoor Cooking Equipment Market (2026-2032) | Analysis, Share, Pricing, Trends, Size, Outlook, Revenue, segmentation, Demand, Insights, Investment Opportunities, Restraints, Growth, Forecast, Competition, Drivers, Challenges, Companies, Strategy, Value
- Thailand Outdoor Cooking Equipment Market (2026-2032) | Growth, Revenue, Insights, Companies, Drivers, Strategy, Forecast, Size, Analysis, segmentation, Trends, Challenges, Competition, Share, Investment Opportunities, Demand, Pricing, Value, Restraints, Outlook
- Tanzania Outdoor Cooking Equipment Market (2026-2032) | Share, Drivers, Forecast, Revenue, Growth, Outlook, Analysis, Investment Opportunities, Restraints, segmentation, Demand, Pricing, Size, Insights, Challenges, Competition, Companies, Value, Trends, Strategy
- Tajikistan Outdoor Cooking Equipment Market (2026-2032) | Value, Pricing, Companies, Share, Strategy, Revenue, Investment Opportunities, Demand, Forecast, Size, Competition, Challenges, Growth, Insights, Restraints, segmentation, Analysis, Trends, Drivers, Outlook
Industry Events and Analyst Meet

HIMTEX 2026

India Refining Summit 2026

India EV Show 2026

EV tech India Expo 2026

Auto Tech Asia 2026
Whitepaper
- Middle East & Africa Commercial Security Market Click here to view more.
- Middle East & Africa Fire Safety Systems & Equipment Market Click here to view more.
- GCC Drone Market Click here to view more.
- Middle East Lighting Fixture Market Click here to view more.
- GCC Physical & Perimeter Security Market Click here to view more.
6WResearch In News
- Doha a strategic location for EV manufacturing hub: IPA Qatar
- Demand for luxury TVs surging in the GCC, says Samsung
- Empowering Growth: The Thriving Journey of Bangladesh’s Cable Industry
- Demand for luxury TVs surging in the GCC, says Samsung
- Video call with a traditional healer? Once unthinkable, it’s now common in South Africa
- Intelligent Buildings To Smooth GCC’s Path To Net Zero