Indonesia Dosing System Market (2026-2032) | Trends, Revenue, Forecast, Growth, Share, Analysis, Value, Outlook, Companies, Size & Industry
Market Forecast By Technology Type (Diaphragm, Plunger/Piston, Cavity, Peristaltic, Others), By Application (Water Treatment, Power Generation, Oil & Gas, Chemical Processes, Food & Beverages, Others) And Competitive Landscape
| Product Code: ETC034608 | Publication Date: Jul 2023 | Updated Date: Jun 2026 | Product Type: Report | |
| Publisher: 6Wresearch | Author: Ravi Bhandari | No. of Pages: 70 | No. of Figures: 35 | No. of Tables: 5 |
Indonesia Dosing System Market Summary
The indonesia dosing system market was estimated at USD 151 Million in 2025 and is projected to reach USD 199 Million by 2032, growing at a CAGR of 5.7% from 2026 to 2032.
Indonesia Dosing System Market Year-wise Growth Rate and Key Drivers
This graph highlights how the Indonesia Dosing System Market has steadily grown over the past five years, supported by major growth factors.
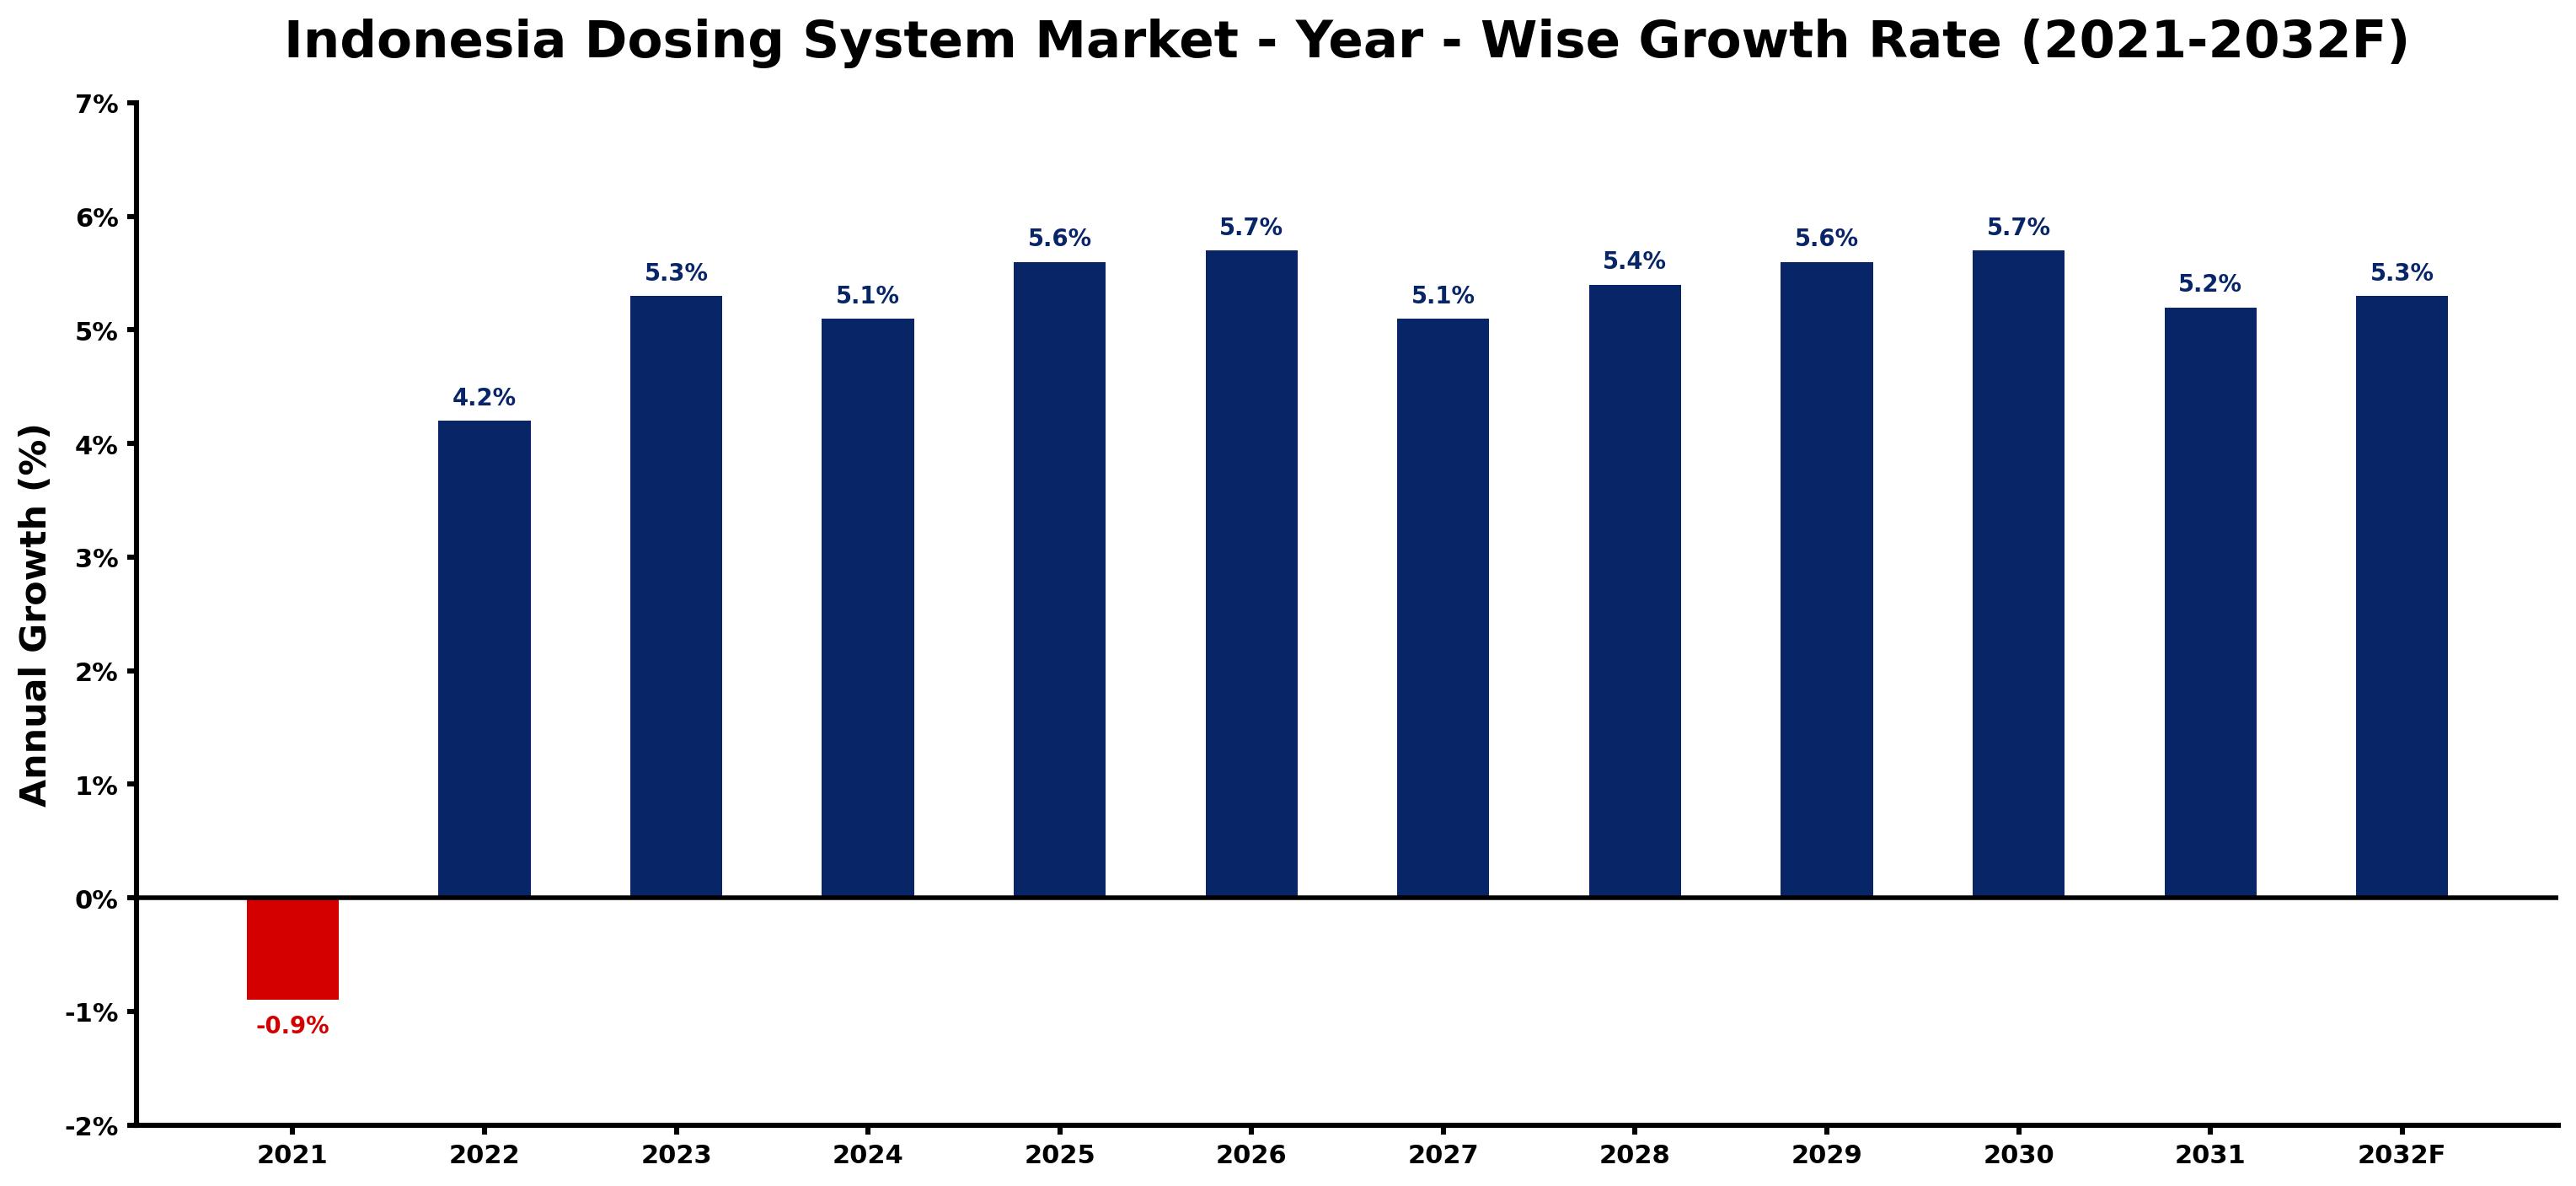
The table below presents the year wise growth rates along with the key drivers influencing the market
| Year | Growth Rate | Major Drivers |
| 2021 | -0.9% | Economic uncertainties caused businesses to delay investments in dosing systems, leading to reduced market demand. |
| 2022 | 4.2% | Emerging startups introduced smart dosing solutions, enhancing precision and efficiency. |
| 2023 | 5.3% | The urbanization trend increased the need for advanced water treatment systems. |
| 2024 | 5.1% | Rising awareness of environmental sustainability prompted investments in eco-friendly products. |
| 2025 | 5.6% | Local manufacturers collaborated with international firms to enhance product offerings. |
| 2026 | 5.7% | The construction sector's expansion fueled demand for dosing systems in infrastructure. |
| 2027 | 5.1% | Major industries adopted automation, increasing the integration of dosing technologies. |
| 2028 | 5.4% | Consumer preferences shifted toward real-time monitoring and data analytics capabilities. |
| 2029 | 5.6% | Research institutions focused on developing customized solutions for specific industries. |
| 2030 | 5.7% | Evolving regulations emphasized safety standards, driving quality improvements in dosing systems. |
| 2031 | 5.2% | Technological innovations enabled the integration of IoT solutions in dosing applications. |
| 2032 | 5.3% | Partnerships between tech firms and manufacturers enhanced product accessibility and outreach. |
Note - Market size estimations and growth projections presented in this report are based on 6Wresearch's advanced forecasting approach, validated with industry datasets as of June 2026.
Indonesia Dosing System Market Synopsis
The Indonesia Dosing System Market is projected to reach 5.7% and witness significant growth during the forecast period (2026-2032). This growth is largely driven by increasing consumer awareness regarding water quality and the government's commitment to enhancing drinking water quality standards across the nation. The sector is further supported by rising investments in wastewater treatment, an uptick in industrial activities, and a surge in residential construction projects throughout Indonesia.
Indonesia Dosing System Market Growth Drivers
The growth of the Indonesia Dosing System Market is underpinned by several key factors:
- An escalating demand for precise dosing applications is particularly evident in industries such as petrochemicals, oil and gas, and chemical processing plants, where accuracy is paramount.
- Heightened health concerns relating to inadequate water quality have prompted both consumers and industries to invest in reliable dosing systems to ensure water safety.
- A growing emphasis on energy efficiency and the reduction of operational costs has led more companies to adopt advanced dosing technologies.
- Stricter environmental regulations enacted by government authorities concerning wastewater discharge have compelled industries to integrate effective dosing solutions.
- Rapid urbanization and industrial expansion across Indonesia are generating increased volumes of wastewater, thereby amplifying the need for robust dosing systems.
Indonesia Dosing System Market Challenges and Restraints
Despite the promising growth forecasts, the Indonesia Dosing System Market faces several challenges that could impede its expansion:
- The absence of standard operating procedures (SOPs) tailored for various industries could lead to operational inconsistencies and inaccuracies in dosing applications, posing a significant risk to end users.
- The high initial investment required for the installation of dosing systems often acts as a deterrent for widespread adoption among key stakeholders.
- Frequent electrical outages arising from insufficient power supply may disrupt the functionality and maintenance of dosing systems, compromising their reliability.
- The limited availability of skilled labor proficient in the installation and maintenance of dosing systems presents a challenge to the efficient implementation and operation of these technologies.
- Market players may also face difficulties in sourcing high-quality components necessary for manufacturing advanced dosing systems, hampering innovation and competitive differentiation.
Indonesia Dosing System Market Government Investment and Initiatives
The Indonesian government has recognized the pressing need for improving water quality and has therefore initiated several investment strategies and public policies aimed at fostering the growth of the dosing system market. These initiatives include:
- Increasing public spending on infrastructure projects that include advanced water treatment facilities, which directly impact the demand for efficient dosing systems.
- Launching programs that incentivize industries to adopt environmentally friendly technologies, including modern dosing solutions that enhance water treatment processes.
- Implementing stricter regulations on wastewater discharge, thereby necessitating more industries to invest in reliable dosing systems to comply with new environmental standards.
- Promoting collaboration with private sector stakeholders to facilitate the sharing of technology and best practices for efficient water treatment and dosing management.
- Encouraging research and development efforts aimed at innovation in dosing technologies to improve efficiency and effectiveness, aligning with global water quality standards.
Indonesia Dosing System Market Latest Developments (May 2025 - June 2026)
In the recent months leading up to mid-2026, the Indonesia Dosing System Market has experienced several noteworthy developments that reflect the industry's evolving landscape:
- There has been an increased adoption of smart dosing systems equipped with IoT technology, which allows for real-time monitoring and optimization of chemical dosing processes.
- Collaborative initiatives between government bodies and private sectors have been established to develop standardized testing protocols for dosing systems, enhancing their credibility and reliability.
- Research initiatives aimed at improving the energy efficiency of dosing technologies are leading to the development of innovative solutions that not only reduce consumption but also lower operational costs.
- Several companies are launching training programs to upskill the existing workforce, addressing the skills gap that has posed a challenge to the sector.
- A notable increase in public awareness campaigns related to water quality has spurred demand for home-based dosing systems, allowing consumers to take control of their water safety.
Indonesia Dosing System Market - Key Attractiveness of the Report
- 10 Years of Market Numbers
- Historical Data Starting from 2022 to 2025
- Base Year: 2025
- Forecast Data until 2032
- Key Performance Indicators Impacting the Market
- Major Upcoming Developments and Projects
Key Highlights of the Report:
- Indonesia Dosing System Market Outlook
- Market Size of Indonesia Dosing System Market, 2025
- Forecast of Indonesia Dosing System Market, 2032F
- Historical Data and Forecast of Indonesia Dosing System Revenues & Volume for the Period 2022-2032F
- Indonesia Dosing System Market Trend Evolution
- Indonesia Dosing System Market Drivers and Challenges
- Indonesia Dosing System Price Trends
- Indonesia Dosing System Porter's Five Forces
- Indonesia Dosing System Industry Life Cycle
- Historical Data and Forecast of Indonesia Dosing System Market Revenues & Volume By Technology Type for the Period 2022-2032F
- Historical Data and Forecast of Indonesia Dosing System Market Revenues & Volume By Diaphragm for the Period 2022-2032F
- Historical Data and Forecast of Indonesia Dosing System Market Revenues & Volume By Plunger/Piston for the Period 2022-2032F
- Historical Data and Forecast of Indonesia Dosing System Market Revenues & Volume By Cavity for the Period 2022-2032F
- Historical Data and Forecast of Indonesia Dosing System Market Revenues & Volume By Peristaltic for the Period 2022-2032F
- Historical Data and Forecast of Indonesia Dosing System Market Revenues & Volume By Others for the Period 2022-2032F
- Historical Data and Forecast of Indonesia Dosing System Market Revenues & Volume By Application for the Period 2022-2032F
- Historical Data and Forecast of Indonesia Dosing System Market Revenues & Volume By Water Treatment for the Period 2022-2032F
- Historical Data and Forecast of Indonesia Dosing System Market Revenues & Volume By Power Generation for the Period 2022-2032F
- Historical Data and Forecast of Indonesia Dosing System Market Revenues & Volume By Oil & Gas for the Period 2022-2032F
- Historical Data and Forecast of Indonesia Dosing System Market Revenues & Volume By Chemical Processes for the Period 2022-2032F
- Historical Data and Forecast of Indonesia Dosing System Market Revenues & Volume By Food & Beverages for the Period 2022-2032F
- Historical Data and Forecast of Indonesia Dosing System Market Revenues & Volume By Others for the Period 2022-2032F
- Indonesia Dosing System Import Export Trade Statistics
- Market Opportunity Assessment By Technology Type
- Market Opportunity Assessment By Application
- Indonesia Dosing System Top Companies Market Share
- Indonesia Dosing System Competitive Benchmarking By Technical and Operational Parameters
- Indonesia Dosing System Company Profiles
- Indonesia Dosing System Key Strategic Recommendations
Frequently Asked Questions About the Market Study (FAQs):
Key factors include increased demand for precise dosing applications, rising health concerns regarding water quality, and the government's stringent regulations on wastewater management.
Government initiatives are fostering market growth through increased public spending, incentives for adopting advanced technologies, and the establishment of environmental regulations that require efficient dosing solutions.
Challenges include the lack of standardized operating procedures, high initial costs, frequent power outages, and a skilled labor shortage for installation and maintenance tasks.
Recent developments include the adoption of smart dosing systems, partnerships for standardizing testing protocols, and training programs to address workforce skill gaps.
6Wresearch actively monitors the Indonesia Dosing System Market and publishes its comprehensive annual report, highlighting emerging trends, growth drivers, revenue analysis, and forecast outlook. Our insights help businesses to make data-backed strategic decisions with ongoing market dynamics. Our analysts track relevent industries related to the Indonesia Dosing System Market, allowing our clients with actionable intelligence and reliable forecasts tailored to emerging regional needs.
Yes, we provide customisation as per your requirements. To learn more, feel free to contact us on sales@6wresearch.com
1 Executive Summary |
2 Introduction |
2.1 Key Highlights of the Report |
2.2 Report Description |
2.3 Market Scope & Segmentation |
2.4 Research Methodology |
2.5 Assumptions |
3 Indonesia Dosing System Market Overview |
3.1 Indonesia Country Macro Economic Indicators |
3.2 Indonesia Dosing System Market Revenues & Volume, 2022 & 2032F |
3.3 Indonesia Dosing System Market - Industry Life Cycle |
3.4 Indonesia Dosing System Market - Porter's Five Forces |
3.5 Indonesia Dosing System Market Revenues & Volume Share, By Technology Type, 2022 & 2032F |
3.6 Indonesia Dosing System Market Revenues & Volume Share, By Application, 2022 & 2032F |
4 Indonesia Dosing System Market Dynamics |
4.1 Impact Analysis |
4.2 Market Drivers |
4.3 Market Restraints |
5 Indonesia Dosing System Market Trends |
6 Indonesia Dosing System Market, By Types |
6.1 Indonesia Dosing System Market, By Technology Type |
6.1.1 Overview and Analysis |
6.1.2 Indonesia Dosing System Market Revenues & Volume, By Technology Type, 2022-2032F |
6.1.3 Indonesia Dosing System Market Revenues & Volume, By Diaphragm, 2022-2032F |
6.1.4 Indonesia Dosing System Market Revenues & Volume, By Plunger/Piston, 2022-2032F |
6.1.5 Indonesia Dosing System Market Revenues & Volume, By Cavity, 2022-2032F |
6.1.6 Indonesia Dosing System Market Revenues & Volume, By Peristaltic, 2022-2032F |
6.1.7 Indonesia Dosing System Market Revenues & Volume, By Others, 2022-2032F |
6.2 Indonesia Dosing System Market, By Application |
6.2.1 Overview and Analysis |
6.2.2 Indonesia Dosing System Market Revenues & Volume, By Water Treatment, 2022-2032F |
6.2.3 Indonesia Dosing System Market Revenues & Volume, By Power Generation, 2022-2032F |
6.2.4 Indonesia Dosing System Market Revenues & Volume, By Oil & Gas, 2022-2032F |
6.2.5 Indonesia Dosing System Market Revenues & Volume, By Chemical Processes, 2022-2032F |
6.2.6 Indonesia Dosing System Market Revenues & Volume, By Food & Beverages, 2022-2032F |
6.2.7 Indonesia Dosing System Market Revenues & Volume, By Others, 2022-2032F |
7 Indonesia Dosing System Market Import-Export Trade Statistics |
7.1 Indonesia Dosing System Market Export to Major Countries |
7.2 Indonesia Dosing System Market Imports from Major Countries |
8 Indonesia Dosing System Market Key Performance Indicators |
9 Indonesia Dosing System Market - Opportunity Assessment |
9.1 Indonesia Dosing System Market Opportunity Assessment, By Technology Type, 2022 & 2032F |
9.2 Indonesia Dosing System Market Opportunity Assessment, By Application, 2022 & 2032F |
10 Indonesia Dosing System Market - Competitive Landscape |
10.1 Indonesia Dosing System Market Revenue Share, By Companies, 2025 |
10.2 Indonesia Dosing System Market Competitive Benchmarking, By Operating and Technical Parameters |
11 Company Profiles |
12 Recommendations |
13 Disclaimer |
Global Go To Market Strategy - 2030
Export potential enables firms to identify high-growth global markets with greater confidence by combining advanced trade intelligence with a structured quantitative methodology. The framework analyzes emerging demand trends and country-level import patterns while integrating macroeconomic and trade datasets such as GDP and population forecasts, bilateral import–export flows, tariff structures, elasticity differentials between developed and developing economies, geographic distance, and import demand projections. Using weighted trade values from 2020–2024 as the base period to project country-to-country export potential for 2030, these inputs are operationalized through calculated drivers such as gravity model parameters, tariff impact factors, and projected GDP per-capita growth. Through an analysis of hidden potentials, demand hotspots, and market conditions that are most favorable to success, this method enables firms to focus on target countries, maximize returns, and global expansion with data, backed by accuracy.
By factoring in the projected importer demand gap that is currently unmet and could be potential opportunity, it identifies the potential for the Exporter (Country) among 190 countries, against the general trade analysis, which identifies the biggest importer or exporter.
To discover high-growth global markets and optimize your business strategy:
Click Here
Pricing
- Single User License$ 1,995
- Department License$ 2,400
- Site License$ 3,120
- Global License$ 3,795

Leadership Perspectives from Industry Events
Search
Thought Leadership and Analyst Meet


Our Clients
6WResearch In News
- India Air Conditioner Market Set for Strong Rebound in 2026 After Weather-Led Correction and GST-Driven Recovery: 6Wresearch
- ADAS in India: How Automatic Emergency Braking, Blind Spot Detection & Driver Monitoring are Transforming Road Safety
- Doha a strategic location for EV manufacturing hub: IPA Qatar
- Demand for luxury TVs surging in the GCC, says Samsung
- Empowering Growth: The Thriving Journey of Bangladesh’s Cable Industry
- Demand for luxury TVs surging in the GCC, says Samsung
Latest Reports
- Nicaragua RPG Gaming Market (2026-2032)
- New Zealand RPG Gaming Market (2026-2032)
- Netherlands RPG Gaming Market (2026-2032)
- Nauru RPG Gaming Market (2026-2032)
- Namibia RPG Gaming Market (2026-2032)
- Mozambique RPG Gaming Market (2026-2032)
- Montenegro RPG Gaming Market (2026-2032)
- Mongolia RPG Gaming Market (2026-2032)
- Monaco RPG Gaming Market (2026-2032)
- Micronesia RPG Gaming Market (2026-2032)
Industry Events and Analyst Meet

EV India Expo 2026

HIMTEX 2026

India Refining Summit 2026

India EV Show 2026

EV tech India Expo 2026
Whitepaper
- Middle East & Africa Commercial Security Market Click here to view more.
- Middle East & Africa Fire Safety Systems & Equipment Market Click here to view more.
- GCC Drone Market Click here to view more.
- Middle East Lighting Fixture Market Click here to view more.
- GCC Physical & Perimeter Security Market Click here to view more.