Indonesia Drinkware Market (2026-2032) | Growth, Size, Analysis, Trends, Companies, Value, Industry, Revenue, Forecast, Outlook & Share
Market Forecast By Types (Glass, Stainless Steel, Ceramic, Polymer, Other), By Applications (Home, Hotel, Restaurant, Others), By Product Types (Water bottle, Tumblers, Shakers, Infusers, Mugs & Cups) And Competitive Landscape
| Product Code: ETC006228 | Publication Date: Jun 2023 | Updated Date: Mar 2026 | Product Type: Report | |
| Publisher: 6Wresearch | Author: Ravi Bhandari | No. of Pages: 70 | No. of Figures: 35 | No. of Tables: 5 |
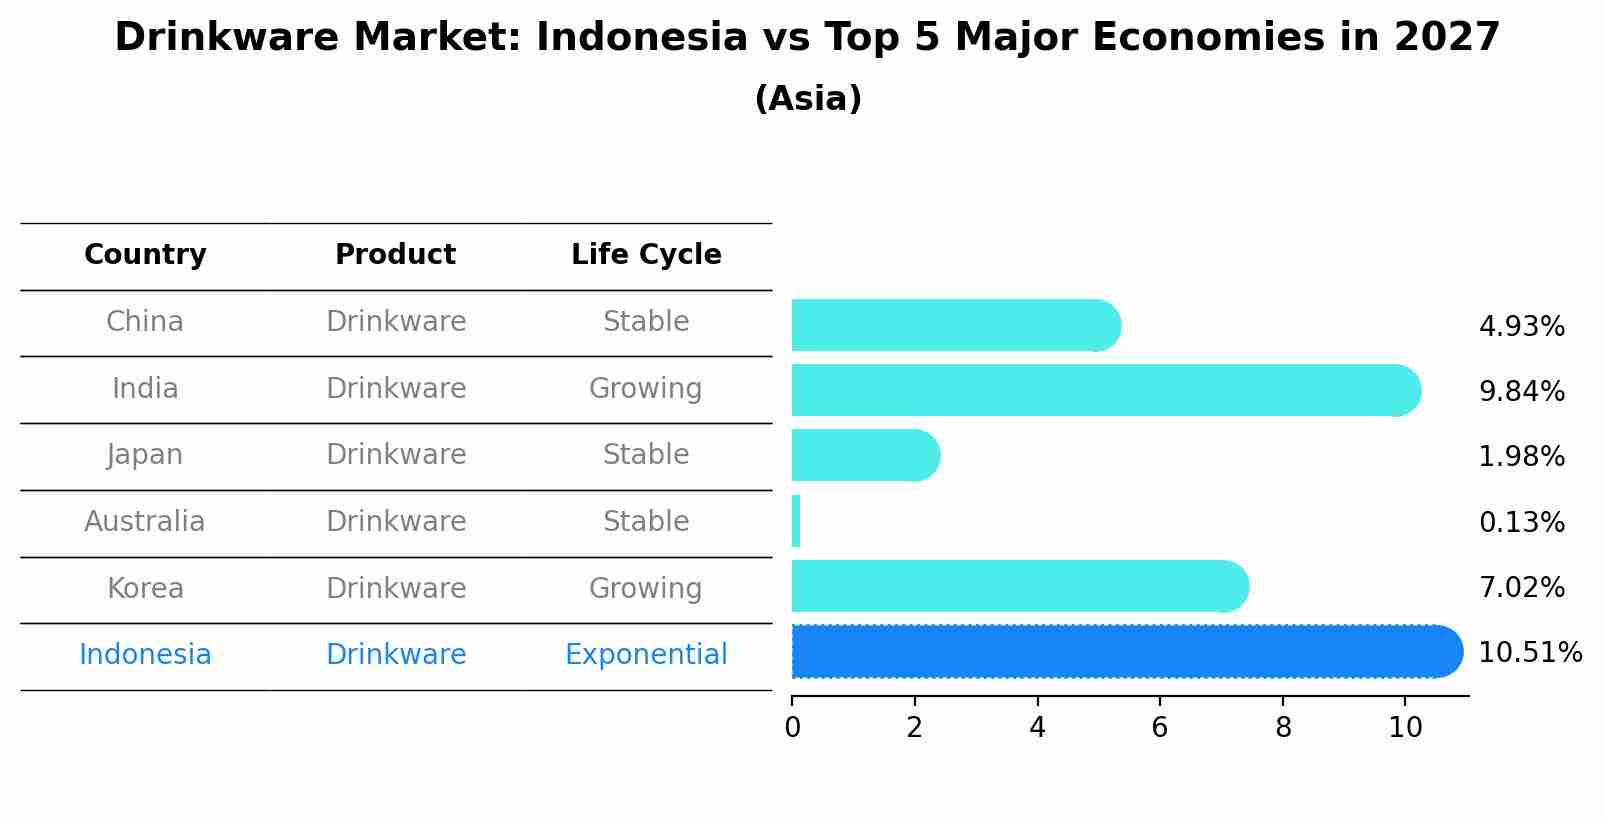
Drinkware Market: Indonesia vs Top 5 Major Economies in 2027 (Asia)
Indonesia's Drinkware market is anticipated to experience a high growth rate of 10.51% by 2027, reflecting trends observed in the largest economy China, followed by India, Japan, Australia and South Korea.
Indonesia Drinkware Market Growth Rate
According to 6Wresearch internal database and industry insights, the Indonesia Drinkware Market is projected to grow at a compound annual growth rate (CAGR) of 7.4% during the forecast period from 2026 to 2032.
Topics Covered in the Indonesia Drinkware Market Report
The Indonesia Drinkware Market report thoroughly covers the market by types, applications, and product types providing an unbiased and detailed analysis of ongoing market trends, opportunities, challenges, and market drivers, helping stakeholders align their strategies with current and future market dynamics.
Indonesia Drinkware Market Highlights
| Report Name | Indonesia Drinkware Market |
| Forecast period | 2026-2032 |
| CAGR | 7.4% |
| Growing Sector | Drinkware |
Indonesia Drinkware Market Synopsis
The Indonesia Drinkware Market is experiencing significant growth as consumers want stylish, functional and eco-friendly drinkware products. As consumers shift their preferences to more expensive products which offer easy usage, drinkware manufacturers develop new products using stainless steel, glass and eco-friendly polymers. Consumers today prefer sustainable products which have led to increased adoption of reusable and recyclable drinking containers. Furthermore, the market growth is driven by technological improvements which enhance drinkware insulation and durability thus enabling more people to use these products.
Evaluation of Growth Drivers in the Indonesia Drinkware Market
Below mentioned are some prominent drivers and their impact on the market dynamics:
| Drivers | Primary Segments Affected | Why It Matters (Evidence) |
| Growing Interest in Sustainability | Stainless Steel, Glass, Polymer | Increasing preference for reusable and eco-friendly drinkware is shaping the market. |
| Increased Disposable Income | Premium Drinkware, Tumblers, Mugs | Rising disposable income is driving demand for high-quality drinkware. |
| Preference for Convenient Products | Water Bottles, Tumblers, Shakers | High demand for easy-to-carry drinkware, especially for on-the-go consumption. |
| Technological Innovations | Insulated Drinkware, Stainless Steel | Technological developments in temperature control are contributing to the growth of insulated drinkware products. |
| Rise in Online Shopping | All Drinkware Types | E-commerce platforms are making drinkware more accessible to consumers. |
The Indonesia Drinkware Market Size is projected to grow at a CAGR of 7.4% from 2026 to 2032. The Indonesia Drinkware Market is expanding as new materials and manufacturing methods are leading to economic development. The rising disposable income of people is driving higher demand for premium drinkware products which include stainless steel and glass tumblers. The growing environmental awareness and the reusable nature of eco-friendly drinkware products are driving people’s preference for them. Subsequently, the market growth is propelled by new insulation technology developments. The industry experiences strong growth as these factors match consumer demands and sustainable development patterns.
Evaluation of Restraints in the Indonesia Drinkware Market
Below mentioned are some major restraints and their influence on the market dynamics:
| Restraints | Primary Segments Affected | What This Means (Evidence) |
| High Product Costs | Premium Drinkware, Stainless Steel, Glass | High manufacturing costs for premium drinkware, especially those made of stainless steel or glass, can limit affordability for certain consumers. |
| Competition from Low-Cost Products | Plastic Drinkware, Tumblers | For instance, consumers might foster the process of growing down over premium versions. |
| Raw Material Shortages | All Drinkware Types | Supply chain disruptions and raw material shortages could affect production and lead to price increases. |
| Growing Regulatory Pressure | All Product Types | The growth of specific product segments, especially plastic drinkware, may be limited due to government regulations targeting plastic waste reduction. |
| Seasonal Demand Fluctuations | Mugs & Cups, Tumblers | The varying demand for specific products such as mugs and tumblers during different seasons creates difficulties in achieving consistent sales year-round. |
Indonesia Drinkware Market Challenges
Lower-cost plastic alternatives present challenges to the Indonesia Drinkware Industry by diminishing the demand for its high-end stainless steel and glass products. The manufacturing process of production facilities experiences interruptions owing to unpredictable raw material costs and ongoing supply chain disruptions. The evolving government regulations on waste management and plastic waste reduction force brands to implement sustainable practices which raise their operational expenses. Furthermore, companies face two challenges as they need to control their financial expenses and develop environmentally friendly products which help them stay competitive in an evolving regulatory environment.
Indonesia Drinkware Market Trends
Here are some major trends changing the Indonesia Drinkware Market Growth dynamics:
- Eco-friendly Drinkware: Consumers presently choose reusable drinkware which manufacturers produce from sustainable materials that include stainless steel, glass and eco-friendly polymers as environmental awareness continues to increase. The trend forces manufacturers to implement production methods which protect the environment.
- Personalization: The market shows a substantial demand for personalized drinkware products which include custom water bottles and mugs. The retail industry currently experiences high demand for product customization which enables customers to select their preferred colors and logos.
- Insulated Drinkware: The market is growing as consumers show a growing preference for insulated drinkware that maintains beverage temperature, with innovations centered around stainless steel and vacuum-insulated technology.
Investment Opportunities in the Indonesia Drinkware Market
The Indonesia Drinkware Market presents several investment opportunities, including:
- Sustainable Drinkware Manufacturing: Environmentally friendly drinkware products, crafted from recyclable or biodegradable materials, will attract consumers who value sustainability.
- E-commerce Expansion: Businesses that improve their digital presence while providing direct sales to customers will expand their customer base.
- Technological Advancements: Companies can create unique market identities through their investment in product development which includes insulated drinkware and self-cleaning bottle technology.
Top 5 Leading Players in the Indonesia Drinkware Market
Below is the list of prominent companies leading the Indonesia Drinkware Market Share:
1. PT Mulia Industrindo Tbk
| Company Name | PT Mulia Industrindo Tbk |
|---|---|
| Established Year | 1986 |
| Headquarters | Jakarta, Indonesia |
| Official Website | - |
Mulia Glass is a cornerstone of the Indonesian glass industry. Through its subsidiary, PT Mulia Glass, it produces a vast range of glassware, including tumblers, mugs, and carafes.
2. PT Kwarsa Indahmurni
| Company Name | PT Kwarsa Indahmurni |
|---|---|
| Established Year | 1989 |
| Headquarters | Tangerang, Banten, Indonesia |
| Official Website | - |
KIM Glass is a leading manufacturer of table glassware in Indonesia, producing over 180 tons of glassware daily. The brand is a major supplier for big-chain retailers and exports to over 30 countries.
3. PT Ishizuka Maspion Indonesia
| Company Name | PT Ishizuka Maspion Indonesia |
|---|---|
| Established Year | 1993 |
| Headquarters | Surabaya, East Java, Indonesia |
| Official Website | Click Here |
A joint venture between the Indonesian conglomerate Maspion Group and Japan’s Ishizuka Glass, this company is a dominant player in the household glassware segment.
4. Tupperware Indonesia
| Company Name | Tupperware Indonesia |
|---|---|
| Established Year | 1991 |
| Headquarters | Jakarta, Indonesia (Parent: Florida, USA) |
| Official Website | - |
Despite global restructuring, Tupperware remains a high-authority brand in Indonesia, particularly in the reusable plastic drinkware and water bottle segments.
5. PT Diamas Star
| Company Name | PT Diamas Star |
|---|---|
| Established Year | 1994 |
| Headquarters | Jakarta, Indonesia |
| Official Website | Click Here |
PT Diamas Star is a major manufacturer and exporter specializing in premium glassware and container glass.
Government Regulations Introduced in the Indonesia Drinkware Market
According to Indonesian government data, to combat plastic waste, the Ministry of Environment and Forestry (KLHK) has implemented regulations that urge companies to adopt recyclable and biodegradable materials for manufacturing drinkware. These regulations support the government’s goals of minimizing plastic pollution and promoting environmental sustainability. Furthermore, the government provides incentives to companies that choose to implement environmentally friendly production techniques and their waste management systems. The Indonesia Drinkware Market is experiencing a transition toward sustainable practices due to these initiatives.
Future Insights of the Indonesia Drinkware Market
The Indonesia Drinkware Market is set for a positive outlook, fueled by technological innovations, a growing demand for sustainable products, and rising disposable incomes. Technological innovations in insulation, customization, and eco-friendly materials will fuel market growth. However, the expansion of online retailing is enhancing accessibility and extending the reach of drinkware brands. Furthermore, these factors point to a stable and long-term growth trajectory, ensuring the market's continued success in the future.
Market Segmentation Analysis
The report offers a comprehensive study of the following market segments and their leading categories:
By Types- Stainless Steel to Dominate the Market
According to Ritika Kalra, Senior Research Analyst, 6Wresearch, the market will be led by stainless steel drinkware as its long-lasting nature and capacity to keep drinks hot or cold and its environmentally friendly characteristics. The product has gained popularity among customers who want environmentally friendly options that replace single-use plastic items.
By Application - Home to Dominate the Market
Home applications will experience their most significant growth as consumers are increasingly purchasing high-quality environmentally friendly and stylish drinkware for their personal use needs. The home sector experiences growth as consumers in developed markets spend more money while they pursue sustainable solutions.
By Product Types- Tumblers to Dominate the Market
The Indonesia Drinkware Market will see tumblers become its most popular product due to their ability to provide easy drinking solutions for people who travel. Consumer demand for stainless steel tumblers and other durable tumblers has increased since consumers want products that deliver both practical use and environmental sustainability.
Key Attractiveness of the Report
- 10 Years of Market Numbers
- Historical Data Starting from 2022 to 2025
- Base Year: 2025
- Forecast Data until 2032
- Key Performance Indicators Impacting the Market
- Major Upcoming Developments and Projects
Key Highlights of the Report:
- Indonesia Drinkware Market Outlook
- Market Size of Indonesia Drinkware Market, 2025
- Forecast of Indonesia Drinkware Market, 2032
- Historical Data and Forecast of Indonesia Drinkware Revenues & Volume for the Period 2022-2032
- Indonesia Drinkware Market Trend Evolution
- Indonesia Drinkware Market Drivers and Challenges
- Indonesia Drinkware Price Trends
- Indonesia Drinkware Porter's Five Forces
- Indonesia Drinkware Industry Life Cycle
- Historical Data and Forecast of Indonesia Drinkware Market Revenues & Volume By Types for the Period 2022-2032
- Historical Data and Forecast of Indonesia Drinkware Market Revenues & Volume By Glass for the Period 2022-2032
- Historical Data and Forecast of Indonesia Drinkware Market Revenues & Volume By Stainless Steel for the Period 2022-2032
- Historical Data and Forecast of Indonesia Drinkware Market Revenues & Volume By Ceramic for the Period 2022-2032
- Historical Data and Forecast of Indonesia Drinkware Market Revenues & Volume By Polymer for the Period 2022-2032
- Historical Data and Forecast of Indonesia Drinkware Market Revenues & Volume By Other for the Period 2022-2032
- Historical Data and Forecast of Indonesia Drinkware Market Revenues & Volume By Applications for the Period 2022-2032
- Historical Data and Forecast of Indonesia Drinkware Market Revenues & Volume By Home for the Period 2022-2032
- Historical Data and Forecast of Indonesia Drinkware Market Revenues & Volume By Hotel for the Period 2022-2032
- Historical Data and Forecast of Indonesia Drinkware Market Revenues & Volume By Restaurant for the Period 2022-2032
- Historical Data and Forecast of Indonesia Drinkware Market Revenues & Volume By Others for the Period 2022-2032
- Historical Data and Forecast of Indonesia Drinkware Market Revenues & Volume By Product Types for the Period 2022-2032
- Historical Data and Forecast of Indonesia Drinkware Market Revenues & Volume By Water bottle for the Period 2022-2032
- Historical Data and Forecast of Indonesia Drinkware Market Revenues & Volume By Tumblers for the Period 2022-2032
- Historical Data and Forecast of Indonesia Drinkware Market Revenues & Volume By Shakers for the Period 2022-2032
- Historical Data and Forecast of Indonesia Drinkware Market Revenues & Volume By Infusers for the Period 2022-2032
- Historical Data and Forecast of Indonesia Drinkware Market Revenues & Volume By Mugs & Cups for the Period 2022-2032
- Indonesia Drinkware Import Export Trade Statistics
- Market Opportunity Assessment By Types
- Market Opportunity Assessment By Applications
- Market Opportunity Assessment By Product Types
- Indonesia Drinkware Top Companies Market Share
- Indonesia Drinkware Competitive Benchmarking By Technical and Operational Parameters
- Indonesia Drinkware Company Profiles
- Indonesia Drinkware Key Strategic Recommendations
Market Covered
The report offers a comprehensive study of the subsequent market segments:
By Types
- Glass
- Stainless Steel
- Ceramic
- Polymer
- Other
By Applications
- Home
- Hotel
- Restaurant
- Others
By Product Types
- Water bottle
- Tumblers
- Shakers
- Infusers
- Mugs & Cups
Indonesia Drinkware Market (2026-2032): FAQs
The Indonesia Drinkware Market is projected to grow at a CAGR of 7.4% between 2026-2032.
Tumblers are expected to dominate due to their growing popularity and convenience.
Investment opportunities include eco-friendly drinkware manufacturing, e-commerce expansion, and product innovation in insulation technology.
The Ministry of Environment and Forestry (KLHK) is promoting sustainable manufacturing practices and providing incentives for eco-friendly drinkware production.
6Wresearch actively monitors the Indonesia Drinkware Market and publishes its comprehensive annual report, highlighting emerging trends, growth drivers, revenue analysis, and forecast outlook. Our insights help businesses to make data-backed strategic decisions with ongoing market dynamics. Our analysts track relevent industries related to the Indonesia Drinkware Market, allowing our clients with actionable intelligence and reliable forecasts tailored to emerging regional needs.
Yes, we provide customisation as per your requirements. To learn more, feel free to contact us on sales@6wresearch.com
| 1 Executive Summary |
| 2 Introduction |
| 2.1 Key Highlights of the Report |
| 2.2 Report Description |
| 2.3 Market Scope & Segmentation |
| 2.4 Research Methodology |
| 2.5 Assumptions |
| 3 Indonesia Drinkware Market Overview |
| 3.1 Indonesia Country Macro Economic Indicators |
| 3.2 Indonesia Drinkware Market Revenues & Volume, 2022 & 2032F |
| 3.3 Indonesia Drinkware Market - Industry Life Cycle |
| 3.4 Indonesia Drinkware Market - Porter's Five Forces |
| 3.5 Indonesia Drinkware Market Revenues & Volume Share, By Types, 2022 & 2032F |
| 3.6 Indonesia Drinkware Market Revenues & Volume Share, By Applications, 2022 & 2032F |
| 3.7 Indonesia Drinkware Market Revenues & Volume Share, By Product Types, 2022 & 2032F |
| 4 Indonesia Drinkware Market Dynamics |
| 4.1 Impact Analysis |
| 4.2 Market Drivers |
| 4.2.1 Increasing disposable income of consumers in Indonesia leading to higher spending on premium drinkware products. |
| 4.2.2 Growing awareness about health and wellness, driving demand for eco-friendly and sustainable drinkware options. |
| 4.2.3 Rising trend of social media influence and aesthetics, leading to higher demand for trendy and stylish drinkware products. |
| 4.3 Market Restraints |
| 4.3.1 Price sensitivity among consumers, impacting the adoption of high-priced drinkware products. |
| 4.3.2 Competition from alternative products such as reusable bottles and cups, affecting the market share of drinkware products. |
| 4.3.3 Lack of infrastructure and distribution channels in certain regions of Indonesia, limiting market reach and penetration. |
| 5 Indonesia Drinkware Market Trends |
| 6 Indonesia Drinkware Market, By Types |
| 6.1 Indonesia Drinkware Market, By Types |
| 6.1.1 Overview and Analysis |
| 6.1.2 Indonesia Drinkware Market Revenues & Volume, By Types, 2022 - 2032F |
| 6.1.3 Indonesia Drinkware Market Revenues & Volume, By Glass, 2022 - 2032F |
| 6.1.4 Indonesia Drinkware Market Revenues & Volume, By Stainless Steel, 2022 - 2032F |
| 6.1.5 Indonesia Drinkware Market Revenues & Volume, By Ceramic, 2022 - 2032F |
| 6.1.6 Indonesia Drinkware Market Revenues & Volume, By Polymer, 2022 - 2032F |
| 6.1.7 Indonesia Drinkware Market Revenues & Volume, By Other, 2022 - 2032F |
| 6.2 Indonesia Drinkware Market, By Applications |
| 6.2.1 Overview and Analysis |
| 6.2.2 Indonesia Drinkware Market Revenues & Volume, By Home, 2022 - 2032F |
| 6.2.3 Indonesia Drinkware Market Revenues & Volume, By Hotel, 2022 - 2032F |
| 6.2.4 Indonesia Drinkware Market Revenues & Volume, By Restaurant, 2022 - 2032F |
| 6.2.5 Indonesia Drinkware Market Revenues & Volume, By Others, 2022 - 2032F |
| 6.3 Indonesia Drinkware Market, By Product Types |
| 6.3.1 Overview and Analysis |
| 6.3.2 Indonesia Drinkware Market Revenues & Volume, By Water bottle, 2022 - 2032F |
| 6.3.3 Indonesia Drinkware Market Revenues & Volume, By Tumblers, 2022 - 2032F |
| 6.3.4 Indonesia Drinkware Market Revenues & Volume, By Shakers, 2022 - 2032F |
| 6.3.5 Indonesia Drinkware Market Revenues & Volume, By Infusers, 2022 - 2032F |
| 6.3.6 Indonesia Drinkware Market Revenues & Volume, By Mugs & Cups, 2022 - 2032F |
| 7 Indonesia Drinkware Market Import-Export Trade Statistics |
| 7.1 Indonesia Drinkware Market Export to Major Countries |
| 7.2 Indonesia Drinkware Market Imports from Major Countries |
| 8 Indonesia Drinkware Market Key Performance Indicators |
| 8.1 Consumer engagement on social media platforms showcasing drinkware products. |
| 8.2 Number of collaborations with influencers and celebrities promoting drinkware products. |
| 8.3 Percentage of sales from eco-friendly and sustainable drinkware options. |
| 8.4 Growth in online sales and e-commerce presence for drinkware products. |
| 8.5 Customer satisfaction and repeat purchase rates for drinkware products. |
| 9 Indonesia Drinkware Market - Opportunity Assessment |
| 9.1 Indonesia Drinkware Market Opportunity Assessment, By Types, 2022 & 2032F |
| 9.2 Indonesia Drinkware Market Opportunity Assessment, By Applications, 2022 & 2032F |
| 9.3 Indonesia Drinkware Market Opportunity Assessment, By Product Types, 2022 & 2032F |
| 10 Indonesia Drinkware Market - Competitive Landscape |
| 10.1 Indonesia Drinkware Market Revenue Share, By Companies, 2025 |
| 10.2 Indonesia Drinkware Market Competitive Benchmarking, By Operating and Technical Parameters |
| 11 Company Profiles |
| 12 Recommendations |
| 13 Disclaimer |
Global Go To Market Strategy - 2030
Export potential enables firms to identify high-growth global markets with greater confidence by combining advanced trade intelligence with a structured quantitative methodology. The framework analyzes emerging demand trends and country-level import patterns while integrating macroeconomic and trade datasets such as GDP and population forecasts, bilateral import–export flows, tariff structures, elasticity differentials between developed and developing economies, geographic distance, and import demand projections. Using weighted trade values from 2020–2024 as the base period to project country-to-country export potential for 2030, these inputs are operationalized through calculated drivers such as gravity model parameters, tariff impact factors, and projected GDP per-capita growth. Through an analysis of hidden potentials, demand hotspots, and market conditions that are most favorable to success, this method enables firms to focus on target countries, maximize returns, and global expansion with data, backed by accuracy.
By factoring in the projected importer demand gap that is currently unmet and could be potential opportunity, it identifies the potential for the Exporter (Country) among 190 countries, against the general trade analysis, which identifies the biggest importer or exporter.
To discover high-growth global markets and optimize your business strategy:
Click Here
Pricing
- Single User License$ 1,995
- Department License$ 2,400
- Site License$ 3,120
- Global License$ 3,795

Leadership Perspectives from Industry Events
Search
Thought Leadership and Analyst Meet


Our Clients
6WResearch In News
- India Air Conditioner Market Set for Strong Rebound in 2026 After Weather-Led Correction and GST-Driven Recovery: 6Wresearch
- ADAS in India: How Automatic Emergency Braking, Blind Spot Detection & Driver Monitoring are Transforming Road Safety
- Doha a strategic location for EV manufacturing hub: IPA Qatar
- Demand for luxury TVs surging in the GCC, says Samsung
- Empowering Growth: The Thriving Journey of Bangladesh’s Cable Industry
- Demand for luxury TVs surging in the GCC, says Samsung
Latest Reports
- Poland Fire Protection Systems Market (2026-2032)
- Cape Verde Portable Hand-Thrown Extinguisher Market (2026-2032)
- Canada Portable Hand-Thrown Extinguisher Market (2026-2032)
- Cameroon Portable Hand-Thrown Extinguisher Market (2026-2032)
- Burundi Portable Hand-Thrown Extinguisher Market (2026-2032)
- Burkina Faso Portable Hand-Thrown Extinguisher Market (2026-2032)
- Bulgaria Portable Hand-Thrown Extinguisher Market (2026-2032)
- Brunei Portable Hand-Thrown Extinguisher Market (2026-2032)
- Botswana Portable Hand-Thrown Extinguisher Market (2026-2032)
- Bosnia and Herzegovina Portable Hand-Thrown Extinguisher Market (2026-2032)
Industry Events and Analyst Meet

HIMTEX 2026

India Refining Summit 2026

India EV Show 2026

EV tech India Expo 2026

Auto Tech Asia 2026
Whitepaper
- Middle East & Africa Commercial Security Market Click here to view more.
- Middle East & Africa Fire Safety Systems & Equipment Market Click here to view more.
- GCC Drone Market Click here to view more.
- Middle East Lighting Fixture Market Click here to view more.
- GCC Physical & Perimeter Security Market Click here to view more.