Indonesia E-Scrap Recycling Market (2026-2032) Outlook | Share, Value, Forecast, Industry, Growth, Companies, Size, Revenue, Trends & Analysis
Market Forecast By Product Type (Information Technology (IT) and Telecommunications Equipment, Large White Goods, Small Household Appliances), By Processed Materials (Plastic, Metal, Glass, Others) And Competitive Landscape
| Product Code: ETC260968 | Publication Date: Aug 2023 | Updated Date: Jul 2026 | Product Type: Market Research Report | |
| Publisher: 6Wresearch | Author: Ravi Bhandari | No. of Pages: 75 | No. of Figures: 35 | No. of Tables: 20 |
Indonesia E-Scrap Recycling Market Size, Share & Growth Rate
The Indonesia E-Scrap Recycling Market was estimated at USD 422 Million in 2025 and is projected to reach USD 562 Million by 2032, growing at a CAGR of 4.2% from 2026 to 2032. This growth trajectory is primarily driven by an escalating awareness of the environmental impacts of electronic waste, alongside increasing technological advancements that result in shorter product lifecycles. The cumulative effect of these factors has spurred a heightened demand for effective e-scrap recycling solutions across various sectors in Indonesia.
Indonesia E-Scrap Recycling Market Year-wise Growth Rate and Key Drivers
This graph highlights how the Indonesia E-Scrap Recycling Market has steadily grown over the years, supported by major growth factors.
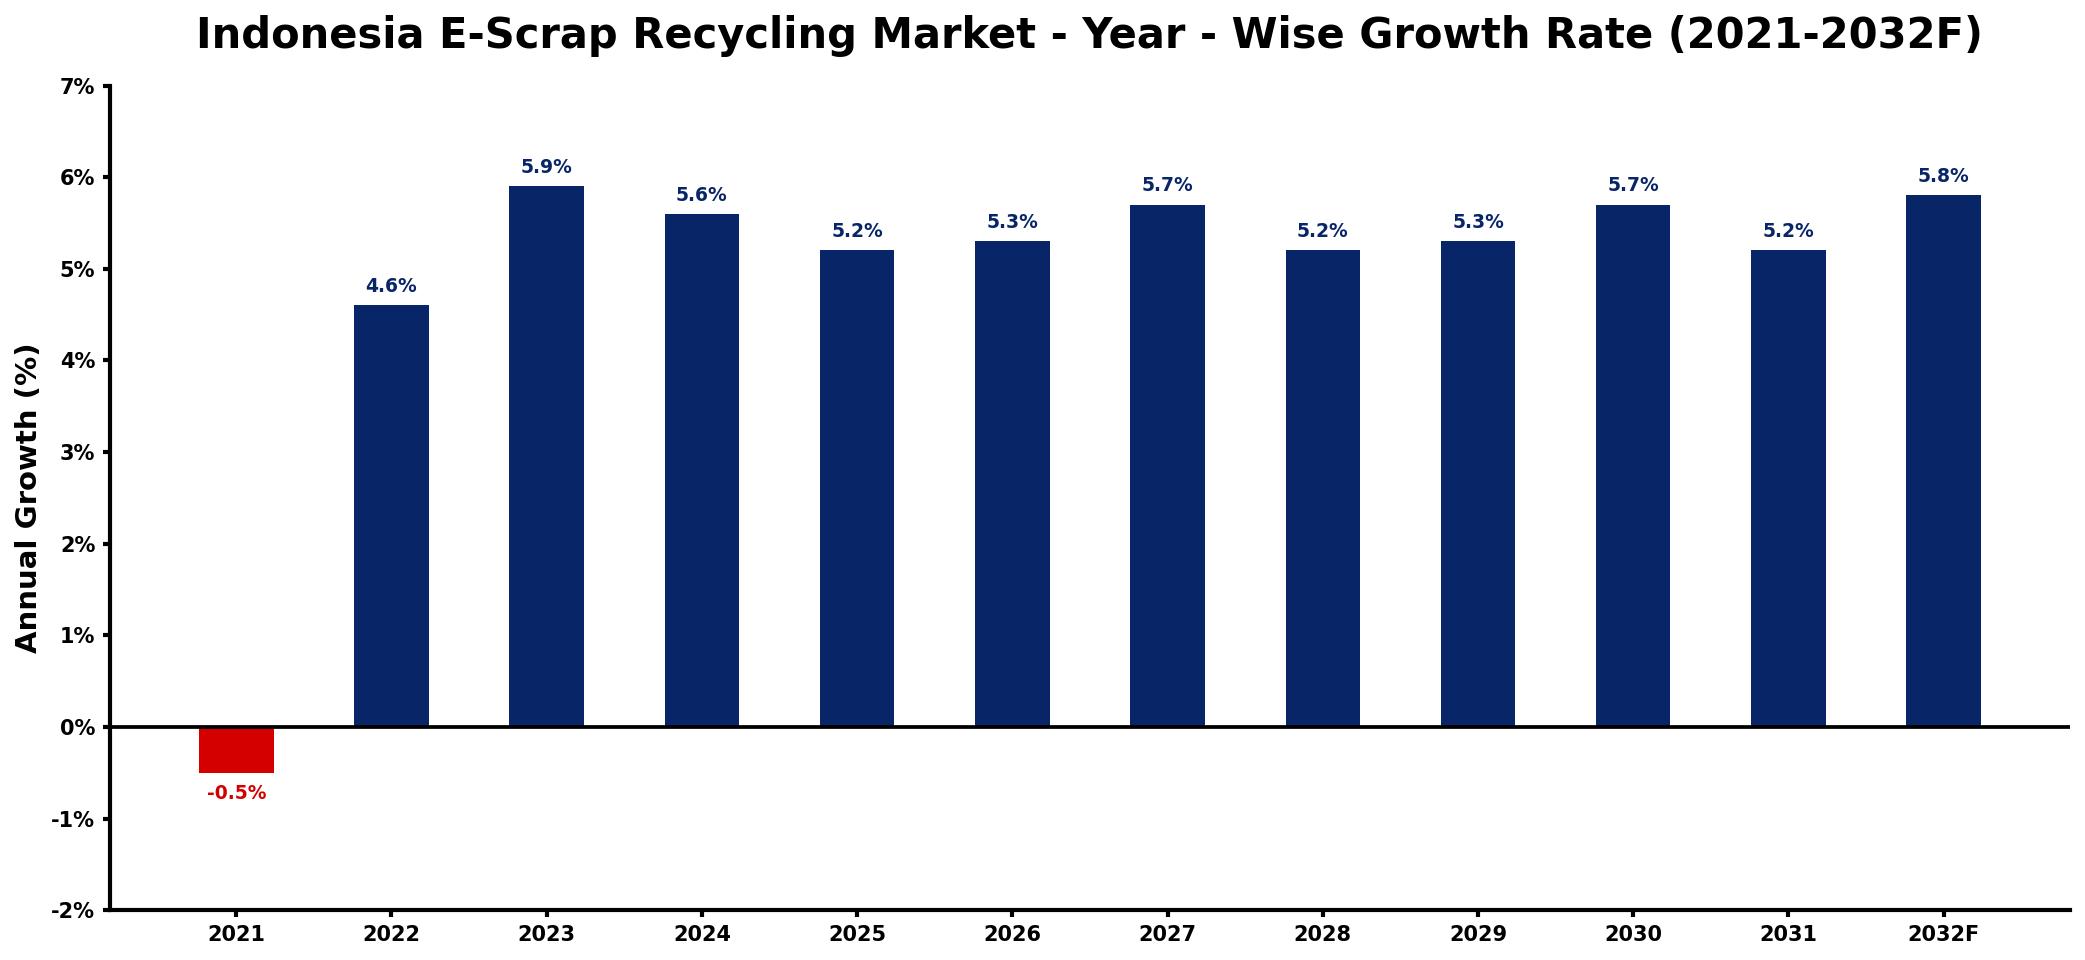
The table below presents the year‑wise growth rates along with the key drivers influencing the market
| Year | Growth Rate | Major Drivers |
| 2021 | -0.5% | decrease in consumer electronics sales |
| 2022 | 4.6% | rise in government initiatives funding |
| 2023 | 5.9% | increased public awareness campaigns |
| 2024 | 5.6% | growing demand for sustainable solutions |
| 2025 | 5.2% | expansion of private sector investments |
| 2026 | 5.3% | enhanced technology in processing |
| 2027 | 5.7% | increased collaboration with manufacturers |
| 2028 | 5.2% | stronger regulations on waste management |
| 2029 | 5.3% | higher consumer demand for eco-friendly |
| 2030 | 5.7% | growing global focus on sustainability |
| 2031 | 5.2% | development of innovative business models |
| 2032 | 5.8% | rising infrastructure development spending |
Note: Market size estimations and growth projections presented in this report are based on 6Wresearch's proprietary forecasting methodology, utilizing the latest available industry data, government publications, and primary research inputs.
Indonesia E-Scrap Recycling Market Synopsis
In recent years, the Indonesia E-Scrap Recycling Market has gained momentum, reflecting a broader global shift towards sustainable waste management practices. As electronic devices proliferate and their life spans shorten, the quantity of e-waste continues to rise, prompting urgent calls for enhanced recycling initiatives.
Looking ahead, the market is poised for considerable development as stakeholders—ranging from government agencies to private enterprises—recognize the necessity of efficient e-waste management. However, the journey towards a more structured recycling framework faces challenges, notably in public awareness and the establishment of comprehensive infrastructure.
Indonesia E-Scrap Recycling Market Key Takeaways
- Strong growth projected due to rising electronic waste and improved recycling initiatives.
- Increased public and corporate awareness regarding the environmental implications of e-waste.
- Investment in recycling technology is critical to optimize resource recovery and minimize landfill waste.
- Government policies are evolving to support sustainable e-scrap recycling practices.
- Stakeholder collaboration is essential for building an effective recycling infrastructure.
Evaluation of Restraints in Indonesia E-Scrap Recycling Market
While the Indonesia E-Scrap Recycling Market shows promising growth potential, several critical restraints hinder its full development. A notable limitation is the current recycling infrastructure, which remains fragmented and underdeveloped, preventing efficient processing of e-waste. Additionally, public awareness regarding the importance of responsible e-waste disposal remains low, leading to a lack of consumer engagement in recycling initiatives. Furthermore, there is a pressing need for incentives that encourage both businesses and individuals to adopt sustainable practices consistently.
Indonesia E-Scrap Recycling Market Trends
The Indonesia E-Scrap Recycling Market is shaped by several key trends, including the increasing integration of advanced recycling technologies, such as automated sorting systems and innovative materials recovery methods. Additionally, the growing interest in circular economy models encourages stakeholders to rethink electronic product lifecycle management. Furthermore, collaboration between public and private sectors is becoming more common, aiming to improve recycling rates and enhance awareness about e-waste management. These trends are vital in laying a robust foundation for the market's future.
Indonesia E-Scrap Recycling Market Opportunities
Opportunities for growth within the Indonesia E-Scrap Recycling Market are abundant. As regulations evolve, companies that invest in state-of-the-art recycling technologies can capitalize on the demand for efficient waste processing. Moreover, public-private partnerships can enhance infrastructure development, leading to improved service offerings. The increasing consumer inclination towards sustainability presents an opportunity for businesses to engage in e-waste awareness campaigns, fostering a community of responsible recyclers. Ultimately, these efforts will not only benefit the environment but also create new economic avenues within the sector.
Government Initiatives in the Indonesia E-Scrap Recycling Market
The Indonesian government is actively developing policies aimed at enhancing the e-scrap recycling sector. Recent initiatives include increased public funding for recycling projects and the establishment of regulatory frameworks that promote responsible e-waste disposal. Furthermore, educational programs are being launched to raise awareness about electronic waste management among consumers and businesses. These efforts reflect a commitment to fostering a sustainable recycling ecosystem that addresses the growing concerns surrounding e-waste.
Future Insights of the Indonesia E-Scrap Recycling Market
Looking forward, the Indonesia E-Scrap Recycling Market is set to witness significant transformations between 2026 and 2032. As technological advancements continue to reshape consumer electronics, the volume of electronic waste will correspondingly rise, necessitating more effective recycling solutions. Legislative developments will likely encourage better waste management practices, while greater corporate responsibility will lead to a collaborative approach in tackling the e-waste challenge. The future landscape will be characterized by innovation, sustainability, and a collective commitment to environmental stewardship.
Indonesia E-Scrap Recycling Market Latest Developments (2025 - 2026)
Recent developments in the Indonesia E-Scrap Recycling Market indicate a proactive shift towards enhancing recycling capabilities. Initiatives aimed at increasing stakeholder engagement are being launched, along with new public awareness campaigns focusing on the importance of e-waste recycling. Additionally, advancements in technology are facilitating improved processing methods, enabling more efficient recovery of valuable materials from electronic waste. As the landscape evolves, players in the market are focusing on building strategic partnerships to bolster recycling efforts.
Indonesia E-Scrap Recycling Market - Key Attractiveness of the Report
- 10 Years of Market Numbers
- Historical Data Starting from 2022 to 2025
- Base Year: 2025
- Forecast Data until 2032
- Key Performance Indicators Impacting the Market
- Major Upcoming Developments and Projects
Key Highlights of the Report:
- Indonesia E-Scrap Recycling Market Outlook
- Market Size of Indonesia E-Scrap Recycling Market, 2025
- Forecast of Indonesia E-Scrap Recycling Market, 2032
- Historical Data and Forecast of Indonesia E-Scrap Recycling Revenues & Volume for the Period 2022-2032F
- Indonesia E-Scrap Recycling Market Trend Evolution
- Indonesia E-Scrap Recycling Market Drivers and Challenges
- Indonesia E-Scrap Recycling Price Trends
- Indonesia E-Scrap Recycling Porter's Five Forces
- Indonesia E-Scrap Recycling Industry Life Cycle
- Historical Data and Forecast of Indonesia E-Scrap Recycling Market Revenues & Volume By Product Type for the Period 2022-2032F
- Historical Data and Forecast of Indonesia E-Scrap Recycling Market Revenues & Volume By Information Technology (IT) and Telecommunications Equipment for the Period 2022-2032F
- Historical Data and Forecast of Indonesia E-Scrap Recycling Market Revenues & Volume By Large White Goods for the Period 2022-2032F
- Historical Data and Forecast of Indonesia E-Scrap Recycling Market Revenues & Volume By Small Household Appliances for the Period 2022-2032F
- Historical Data and Forecast of Indonesia E-Scrap Recycling Market Revenues & Volume By Processed Materials for the Period 2022-2032F
- Historical Data and Forecast of Indonesia E-Scrap Recycling Market Revenues & Volume By Plastic for the Period 2022-2032F
- Historical Data and Forecast of Indonesia E-Scrap Recycling Market Revenues & Volume By Metal for the Period 2022-2032F
- Historical Data and Forecast of Indonesia E-Scrap Recycling Market Revenues & Volume By Glass for the Period 2022-2032F
- Historical Data and Forecast of Indonesia E-Scrap Recycling Market Revenues & Volume By Others for the Period 2022-2032F
- Indonesia E-Scrap Recycling Import Export Trade Statistics
- Market Opportunity Assessment By Product Type
- Market Opportunity Assessment By Processed Materials
- Indonesia E-Scrap Recycling Top Companies Market Share
- Indonesia E-Scrap Recycling Competitive Benchmarking By Technical and Operational Parameters
- Indonesia E-Scrap Recycling Company Profiles
- Indonesia E-Scrap Recycling Key Strategic Recommendations
Frequently Asked Questions About the Market Study (FAQs):
The market was estimated at USD 422 Million in 2025 and is projected to reach USD 562 Million by 2032, growing at a CAGR of 4.2% from 2026 to 2032.
The government is implementing policies aimed at improving e-waste management through public funding for recycling projects and establishing regulatory frameworks that encourage responsible disposal practices.
Major challenges include inadequate recycling infrastructure, low public awareness of e-waste disposal, and the need for greater corporate responsibility in adopting sustainable practices.
Current trends include the adoption of advanced recycling technologies, a shift towards circular economy principles, and greater collaboration between stakeholders to improve recycling rates.
Opportunities lie in technological investments for recycling processes, engaging in public-private partnerships for infrastructure development, and launching community awareness campaigns on e-waste management.
6Wresearch actively monitors the Indonesia E-Scrap Recycling Market and publishes its comprehensive annual report, highlighting emerging trends, growth drivers, revenue analysis, and forecast outlook. Our insights help businesses to make data-backed strategic decisions with ongoing market dynamics. Our analysts track relevent industries related to the Indonesia E-Scrap Recycling Market, allowing our clients with actionable intelligence and reliable forecasts tailored to emerging regional needs.
Yes, we provide customisation as per your requirements. To learn more, feel free to contact us on sales@6wresearch.com
1 Executive Summary |
2 Introduction |
2.1 Key Highlights of the Report |
2.2 Report Description |
2.3 Market Scope & Segmentation |
2.4 Research Methodology |
2.5 Assumptions |
3 Indonesia E-Scrap Recycling Market Overview |
3.1 Indonesia Country Macro Economic Indicators |
3.2 Indonesia E-Scrap Recycling Market Revenues & Volume, 2022 & 2032F |
3.3 Indonesia E-Scrap Recycling Market - Industry Life Cycle |
3.4 Indonesia E-Scrap Recycling Market - Porter's Five Forces |
3.5 Indonesia E-Scrap Recycling Market Revenues & Volume Share, By Product Type, 2022 & 2032F |
3.6 Indonesia E-Scrap Recycling Market Revenues & Volume Share, By Processed Materials, 2022 & 2032F |
4 Indonesia E-Scrap Recycling Market Dynamics |
4.1 Impact Analysis |
4.2 Market Drivers |
4.2.1 Increasing awareness and focus on environmental sustainability and waste management practices |
4.2.2 Government regulations promoting e-scrap recycling and circular economy initiatives |
4.2.3 Growing adoption of electronic devices leading to higher e-waste generation |
4.3 Market Restraints |
4.3.1 Lack of proper e-scrap collection infrastructure and recycling facilities |
4.3.2 Insufficient awareness and participation from consumers and businesses in e-scrap recycling efforts |
4.3.3 Limited technological capabilities for efficiently recycling complex electronic components |
5 Indonesia E-Scrap Recycling Market Trends |
6 Indonesia E-Scrap Recycling Market, By Types |
6.1 Indonesia E-Scrap Recycling Market, By Product Type |
6.1.1 Overview and Analysis |
6.1.2 Indonesia E-Scrap Recycling Market Revenues & Volume, By Product Type, 2022-2032F |
6.1.3 Indonesia E-Scrap Recycling Market Revenues & Volume, By Information Technology (IT) and Telecommunications Equipment, 2022-2032F |
6.1.4 Indonesia E-Scrap Recycling Market Revenues & Volume, By Large White Goods, 2022-2032F |
6.1.5 Indonesia E-Scrap Recycling Market Revenues & Volume, By Small Household Appliances, 2022-2032F |
6.2 Indonesia E-Scrap Recycling Market, By Processed Materials |
6.2.1 Overview and Analysis |
6.2.2 Indonesia E-Scrap Recycling Market Revenues & Volume, By Plastic, 2022-2032F |
6.2.3 Indonesia E-Scrap Recycling Market Revenues & Volume, By Metal, 2022-2032F |
6.2.4 Indonesia E-Scrap Recycling Market Revenues & Volume, By Glass, 2022-2032F |
6.2.5 Indonesia E-Scrap Recycling Market Revenues & Volume, By Others, 2022-2032F |
7 Indonesia E-Scrap Recycling Market Import-Export Trade Statistics |
7.1 Indonesia E-Scrap Recycling Market Export to Major Countries |
7.2 Indonesia E-Scrap Recycling Market Imports from Major Countries |
8 Indonesia E-Scrap Recycling Market Key Performance Indicators |
8.1 Percentage increase in the volume of e-scrap collected for recycling annually |
8.2 Adoption rate of e-scrap recycling programs by businesses and consumers |
8.3 Efficiency improvement in e-scrap recycling processes, measured by reduction in energy consumption or waste generation |
9 Indonesia E-Scrap Recycling Market - Opportunity Assessment |
9.1 Indonesia E-Scrap Recycling Market Opportunity Assessment, By Product Type, 2022 & 2032F |
9.2 Indonesia E-Scrap Recycling Market Opportunity Assessment, By Processed Materials, 2022 & 2032F |
10 Indonesia E-Scrap Recycling Market - Competitive Landscape |
10.1 Indonesia E-Scrap Recycling Market Revenue Share, By Companies, 2025 |
10.2 Indonesia E-Scrap Recycling Market Competitive Benchmarking, By Operating and Technical Parameters |
11 Company Profiles |
12 Recommendations |
13 Disclaimer |
Global Go To Market Strategy - 2030
Export potential enables firms to identify high-growth global markets with greater confidence by combining advanced trade intelligence with a structured quantitative methodology. The framework analyzes emerging demand trends and country-level import patterns while integrating macroeconomic and trade datasets such as GDP and population forecasts, bilateral import–export flows, tariff structures, elasticity differentials between developed and developing economies, geographic distance, and import demand projections. Using weighted trade values from 2020–2024 as the base period to project country-to-country export potential for 2030, these inputs are operationalized through calculated drivers such as gravity model parameters, tariff impact factors, and projected GDP per-capita growth. Through an analysis of hidden potentials, demand hotspots, and market conditions that are most favorable to success, this method enables firms to focus on target countries, maximize returns, and global expansion with data, backed by accuracy.
By factoring in the projected importer demand gap that is currently unmet and could be potential opportunity, it identifies the potential for the Exporter (Country) among 190 countries, against the general trade analysis, which identifies the biggest importer or exporter.
To discover high-growth global markets and optimize your business strategy:
Click Here
Pricing
- Single User License$ 1,995
- Department License$ 2,400
- Site License$ 3,120
- Global License$ 3,795

Leadership Perspectives from Industry Events
Search
Thought Leadership and Analyst Meet


Our Clients
6WResearch In News
- India Air Conditioner Market Set for Strong Rebound in 2026 After Weather-Led Correction and GST-Driven Recovery: 6Wresearch
- ADAS in India: How Automatic Emergency Braking, Blind Spot Detection & Driver Monitoring are Transforming Road Safety
- Doha a strategic location for EV manufacturing hub: IPA Qatar
- Demand for luxury TVs surging in the GCC, says Samsung
- Empowering Growth: The Thriving Journey of Bangladesh’s Cable Industry
- Demand for luxury TVs surging in the GCC, says Samsung
Latest Reports
- Nicaragua RPG Gaming Market (2026-2032)
- New Zealand RPG Gaming Market (2026-2032)
- Netherlands RPG Gaming Market (2026-2032)
- Nauru RPG Gaming Market (2026-2032)
- Namibia RPG Gaming Market (2026-2032)
- Mozambique RPG Gaming Market (2026-2032)
- Montenegro RPG Gaming Market (2026-2032)
- Mongolia RPG Gaming Market (2026-2032)
- Monaco RPG Gaming Market (2026-2032)
- Micronesia RPG Gaming Market (2026-2032)
Industry Events and Analyst Meet

EV India Expo 2026

HIMTEX 2026

India Refining Summit 2026

India EV Show 2026

EV tech India Expo 2026
Whitepaper
- Middle East & Africa Commercial Security Market Click here to view more.
- Middle East & Africa Fire Safety Systems & Equipment Market Click here to view more.
- GCC Drone Market Click here to view more.
- Middle East Lighting Fixture Market Click here to view more.
- GCC Physical & Perimeter Security Market Click here to view more.