Indonesia Electronic parts Market (2026-2032) | Forecast, Trends, Industry, Size, Analysis, Outlook, Share, Growth, Revenue, Value & Companies
Market Forecast By Type (Passive, Active, Electro Mechanic), By Application (Automotive, Communications, Computing Applications, Others) And Competitive Landscape
| Product Code: ETC035568 | Publication Date: Jul 2023 | Updated Date: Jun 2026 | Product Type: Report | |
| Publisher: 6Wresearch | Author: Ravi Bhandari | No. of Pages: 70 | No. of Figures: 35 | No. of Tables: 5 |
Indonesia Electronic parts Market Summary
The indonesia electronic parts market was estimated at USD 384 Million in 2025 and is projected to reach USD 508 Million by 2032, growing at a CAGR of 5.6% from 2026 to 2032.
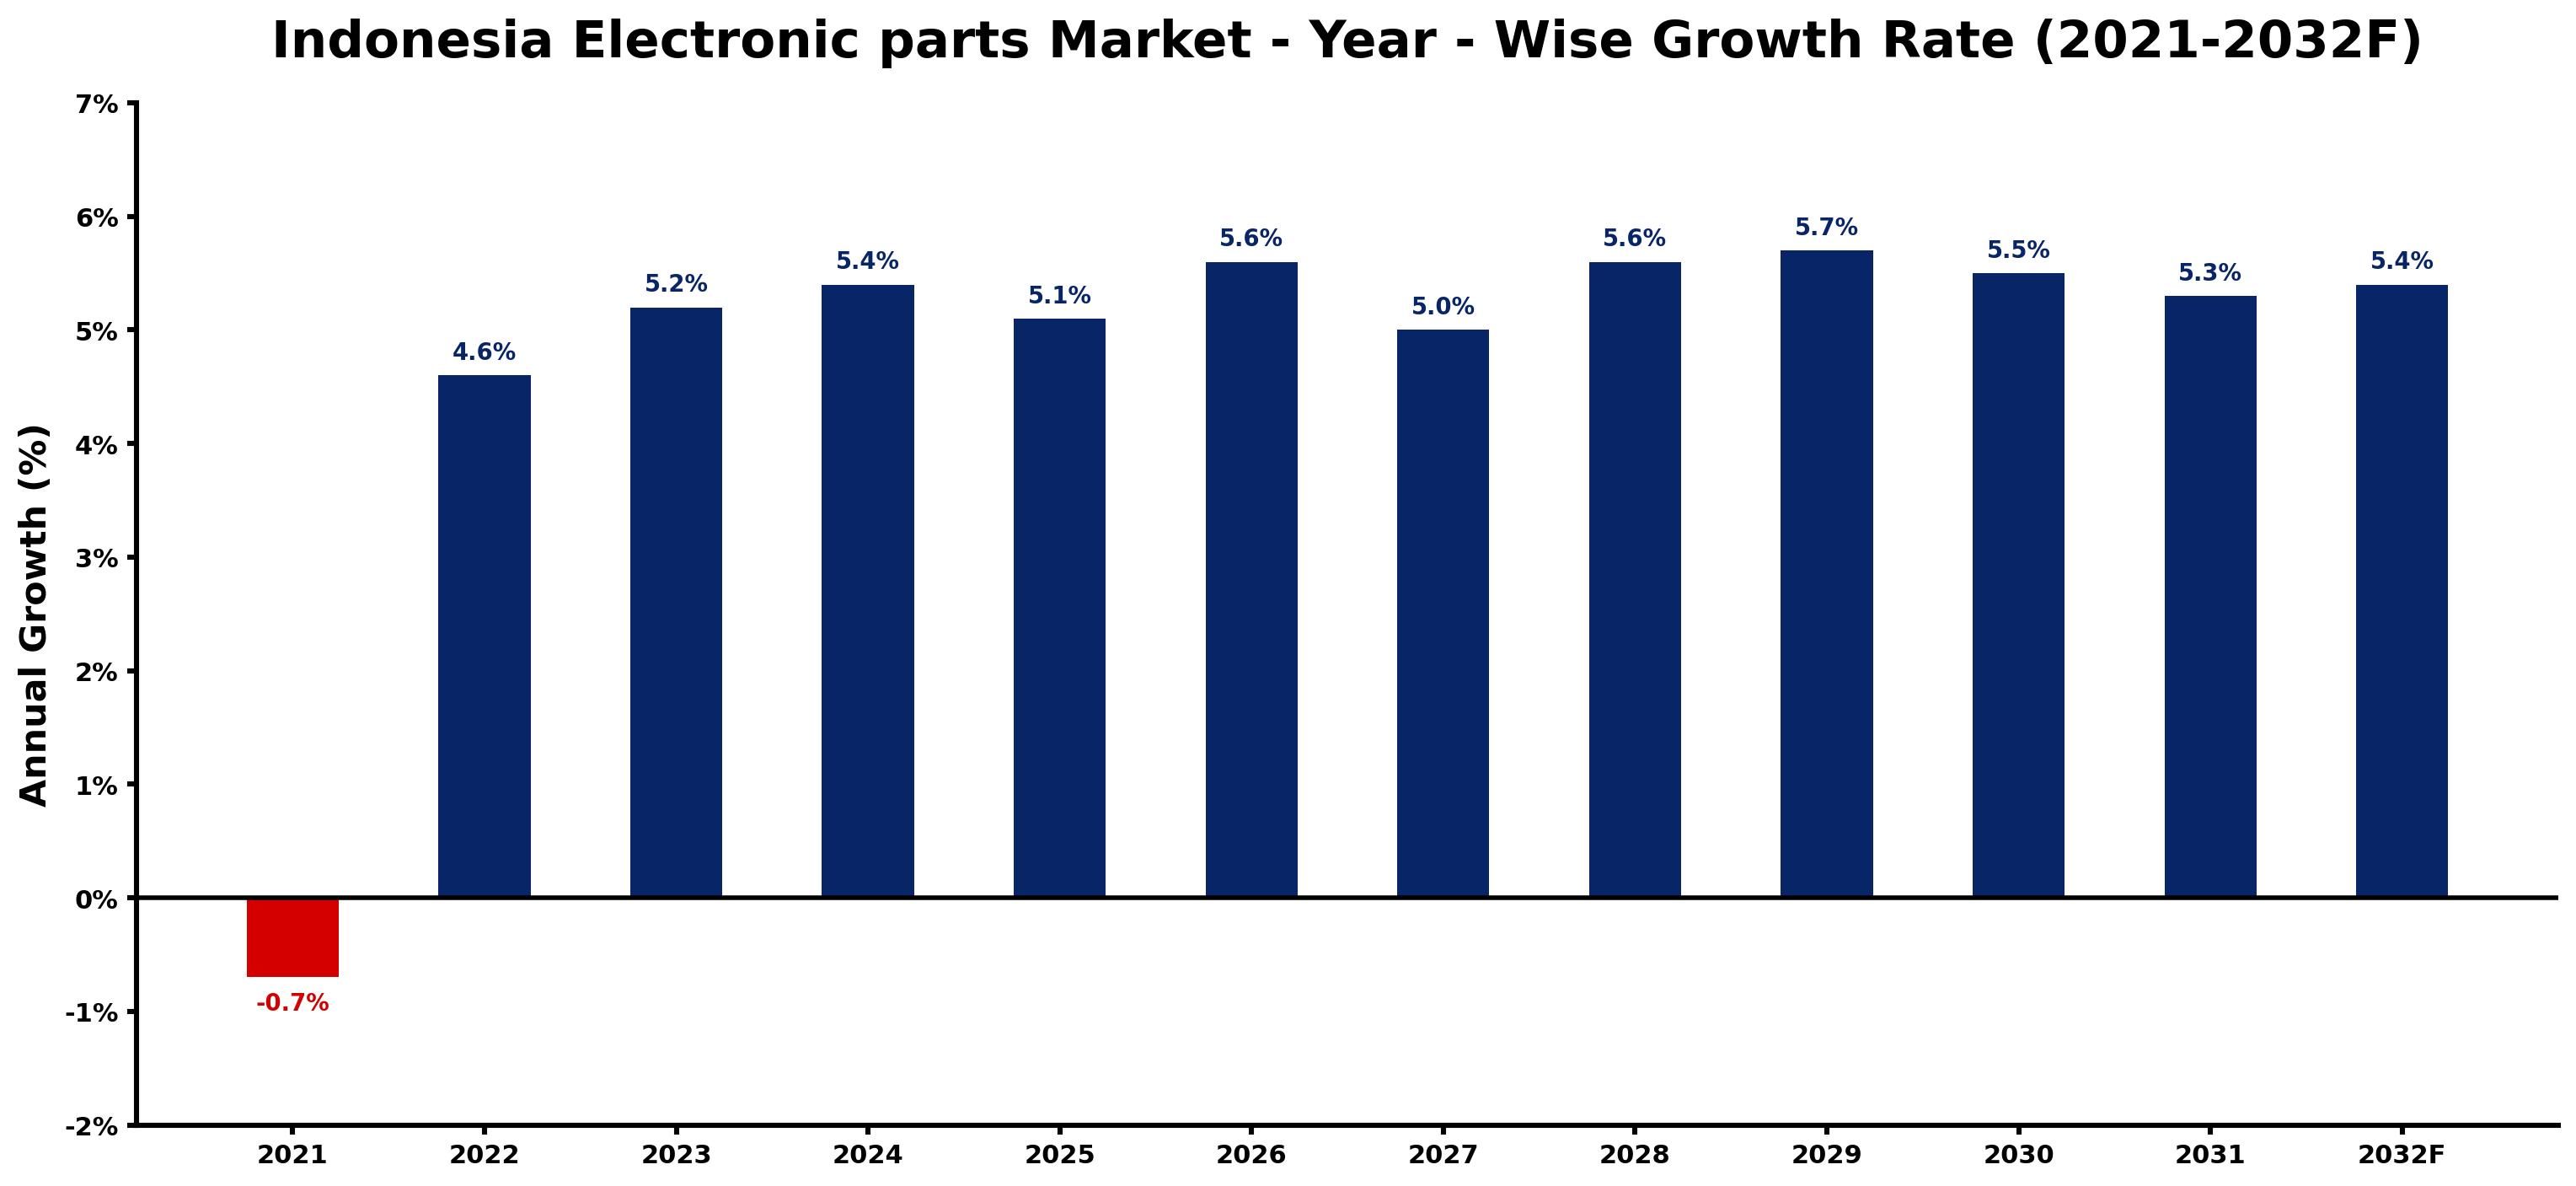
Indonesia Electronic parts Market Growth Rate Analysis (2021-2032)
The Indonesian electronic parts market has shown a significant recovery and upward trend following a brief decline of 0.7% in 2021. Driven by growing consumer demand and substantial investments in the local tech industry, the market rebounded with a remarkable growth of 4.6% in 2022. The momentum continued into 2023 with a rise of 5.2%, as increased adoption of digital technologies and advancements in infrastructure further fueled market dynamics. Projections indicate continued expansion, with growth rates hovering around 5.4% to 5.7% annually through 2032. This robust growth can be attributed to the energy transition and strong policy support for electronics manufacturing, enhancing Indonesia's position in the global supply chain.
Indonesia Electronic parts Market Year-wise Growth Rate and Key Drivers
This graph highlights how the Indonesia Electronic parts Market has steadily grown over the years, supported by major growth factors.
The table below presents the year wise growth rates along with the key drivers influencing the market
| Year | Growth Rate | Major Drivers |
| 2021 | -0.7% | Supply chain disruptions led to significant delays in product availability, negatively impacting consumer purchasing behavior. |
| 2022 | 4.6% | Increased smartphone penetration catalyzed shifts towards more advanced electronic components. |
| 2023 | 5.2% | Emergence of local startups fueled demand for innovative electronic solutions and products. |
| 2024 | 5.4% | Supply chain disruptions highlighted need for domestic production capabilities in electronics. |
| 2025 | 5.1% | Consumer electronics market expanded, with rising interest in smart home technologies. |
| 2026 | 5.6% | Government incentives encouraged local firms to invest in electronic component manufacturing. |
| 2027 | 5.0% | Collaboration between tech companies and educational institutions enhanced skilled workforce availability. |
| 2028 | 5.6% | Sustainability trends prompted shifts towards eco-friendly electronic components in production. |
| 2029 | 5.7% | Regional trade agreements opened doors for Indonesian electronics in Southeast Asian markets. |
| 2030 | 5.5% | Technological integration in industries pushed up demand for specialized electronic parts. |
| 2031 | 5.3% | Urbanization trends sparked growth in smart city projects requiring advanced electronic infrastructure. |
| 2032 | 5.4% | Diverse consumer preferences led to innovations in electronic products and component designs. |
Note - Market size estimations and growth projections presented in this report are based on 6Wresearch's advanced forecasting approach, validated with industry datasets as of June 2026.
Indonesia Electronic parts Market Synopsis
The Indonesia Electronic parts Market is projected to reach 5.6% and witness significant growth during the forecast period (2026-2032). This expansion is largely fueled by the rising demand for consumer electronics, automotive components, and industrial automation throughout the nation. Additionally, the surge in mobile phone sales, paired with increasing disposable incomes, is further propelling the electronic parts market in Indonesia.
Indonesia Electronic parts Market Growth Drivers
The multifaceted growth of the Indonesia Electronic parts Market can be attributed to several key drivers:
- The burgeoning demand for consumer electronics, including smartphones and tablets, plays a pivotal role in expanding market opportunities. As consumer preferences shift towards advanced electronic gadgets, manufacturers are ramping up production.
- Increased investments from both domestic and foreign entities in the manufacturing sector are stimulating production activities. This influx of capital not only enhances manufacturing capabilities but also aligns with global technological advancements.
- Rapid urbanization across Indonesia encourages higher consumption of electronic products, with urban dwellers more inclined towards adopting modern technology in their daily lives.
- Government initiatives aimed at promoting the digital economy and e-commerce significantly contribute to the demand for electronic parts. Such programs foster a conducive environment for innovation and growth within the sector.
- The rising disposable income among Indonesian consumers allows more households to invest in electronic appliances, thereby driving the demand for a wide range of electronic components.
Indonesia Electronic parts Market Challenges and Restraints
Despite its promising outlook, the Indonesia Electronic parts Market faces several challenges that could impede its progress over the coming years:
- A significant constraint is the lack of skilled labor in the manufacturing sector. As technology rapidly evolves, the necessity for a proficient workforce becomes paramount, posing challenges for companies seeking to maintain competitive production standards.
- The high initial costs associated with establishing new manufacturing facilities may deter potential investors. Financial barriers in setting up operations can limit market entry for foreign companies, thus impacting overall market growth.
- Supply chain disruptions, exacerbated by global events, could lead to delays and increased costs in obtaining essential electronic components, affecting production timelines.
- Market competition may intensify as more firms enter the landscape, potentially resulting in price wars that could adversely affect profit margins for existing players.
- Regulatory challenges and compliance with local policies can complicate operations for foreign investors, requiring thorough understanding and adaptation to the local business environment.
Indonesia Electronic parts Market Government Investment and Initiatives
The Indonesian government is undertaking various initiatives aimed at bolstering the electronic parts market. Policies promoting foreign direct investment (FDI) are designed to enhance manufacturing capabilities and attract global players into the sector. Furthermore, public spending on infrastructure improvements supports logistics and supply chain efficiencies that are critical for the electronic parts industry.
The government has also introduced incentives for companies investing in research and development, which is crucial for innovation in electronic technologies. These efforts, coupled with strategic collaborations between different stakeholder groups, are expected to create a more vibrant and competitive electronic parts ecosystem in Indonesia.
Indonesia Electronic parts Market Latest Developments (May 2025 - June 2026)
Recent developments in the Indonesia Electronic parts Market between May 2025 and June 2026 indicate a focused shift towards sustainability and green technology. Manufacturers are increasingly prioritizing eco-friendly materials and processes in response to global sustainability trends.
Additionally, advancements in automation technologies have been seen, driving efficiency in production processes. This trend is supported by government initiatives promoting smart manufacturing practices aimed at enhancing the competitiveness of Indonesian manufacturers in the global marketplace.
The rise of local startups specializing in electronic components has also emerged as a significant development, reflecting Indonesia's capacity for innovation and self-sufficiency in this sector.
Indonesia Electronic parts Market - Key Attractiveness of the Report
- 10 Years of Market Numbers
- Historical Data Starting from 2022 to 2025
- Base Year: 2025
- Forecast Data until 2032
- Key Performance Indicators Impacting the Market
- Major Upcoming Developments and Projects
Key Highlights of the Report:
- Indonesia Electronic parts Market Outlook
- Market Size of Indonesia Electronic parts Market, 2025
- Forecast of Indonesia Electronic parts Market, 2032F
- Historical Data and Forecast of Indonesia Electronic parts Revenues & Volume for the Period 2022-2032F
- Indonesia Electronic parts Market Trend Evolution
- Indonesia Electronic parts Market Drivers and Challenges
- Indonesia Electronic parts Price Trends
- Indonesia Electronic parts Porter's Five Forces
- Indonesia Electronic parts Industry Life Cycle
- Historical Data and Forecast of Indonesia Electronic parts Market Revenues & Volume By Type for the Period 2022-2032F
- Historical Data and Forecast of Indonesia Electronic parts Market Revenues & Volume By Passive for the Period 2022-2032F
- Historical Data and Forecast of Indonesia Electronic parts Market Revenues & Volume By Active for the Period 2022-2032F
- Historical Data and Forecast of Indonesia Electronic parts Market Revenues & Volume By Electro Mechanic for the Period 2022-2032F
- Historical Data and Forecast of Indonesia Electronic parts Market Revenues & Volume By Application for the Period 2022-2032F
- Historical Data and Forecast of Indonesia Electronic parts Market Revenues & Volume By Automotive for the Period 2022-2032F
- Historical Data and Forecast of Indonesia Electronic parts Market Revenues & Volume By Communications for the Period 2022-2032F
- Historical Data and Forecast of Indonesia Electronic parts Market Revenues & Volume By Computing Applications for the Period 2022-2032F
- Historical Data and Forecast of Indonesia Electronic parts Market Revenues & Volume By Others for the Period 2022-2032F
- Indonesia Electronic parts Import Export Trade Statistics
- Market Opportunity Assessment By Type
- Market Opportunity Assessment By Application
- Indonesia Electronic parts Top Companies Market Share
- Indonesia Electronic parts Competitive Benchmarking By Technical and Operational Parameters
- Indonesia Electronic parts Company Profiles
- Indonesia Electronic parts Key Strategic Recommendations
Frequently Asked Questions About the Market Study (FAQs):
Increased demand for consumer electronics, investments in manufacturing, and government initiatives to support the digital economy are key factors driving growth.
The government is implementing policies to attract foreign investment, enhance manufacturing capabilities, and incentivize research and development in the electronic parts industry.
Lack of skilled labor, high manufacturing costs, and supply chain disruptions are notable challenges that could hinder market growth.
6Wresearch actively monitors the Indonesia Electronic parts Market and publishes its comprehensive annual report, highlighting emerging trends, growth drivers, revenue analysis, and forecast outlook. Our insights help businesses to make data-backed strategic decisions with ongoing market dynamics. Our analysts track relevent industries related to the Indonesia Electronic parts Market, allowing our clients with actionable intelligence and reliable forecasts tailored to emerging regional needs.
Yes, we provide customisation as per your requirements. To learn more, feel free to contact us on sales@6wresearch.com
1 Executive Summary |
2 Introduction |
2.1 Key Highlights of the Report |
2.2 Report Description |
2.3 Market Scope & Segmentation |
2.4 Research Methodology |
2.5 Assumptions |
3 Indonesia Electronic parts Market Overview |
3.1 Indonesia Country Macro Economic Indicators |
3.2 Indonesia Electronic parts Market Revenues & Volume, 2022 & 2032F |
3.3 Indonesia Electronic parts Market - Industry Life Cycle |
3.4 Indonesia Electronic parts Market - Porter's Five Forces |
3.5 Indonesia Electronic parts Market Revenues & Volume Share, By Type, 2022 & 2032F |
3.6 Indonesia Electronic parts Market Revenues & Volume Share, By Application, 2022 & 2032F |
4 Indonesia Electronic parts Market Dynamics |
4.1 Impact Analysis |
4.2 Market Drivers |
4.3 Market Restraints |
5 Indonesia Electronic parts Market Trends |
6 Indonesia Electronic parts Market, By Types |
6.1 Indonesia Electronic parts Market, By Type |
6.1.1 Overview and Analysis |
6.1.2 Indonesia Electronic parts Market Revenues & Volume, By Type, 2022-2032F |
6.1.3 Indonesia Electronic parts Market Revenues & Volume, By Passive, 2022-2032F |
6.1.4 Indonesia Electronic parts Market Revenues & Volume, By Active, 2022-2032F |
6.1.5 Indonesia Electronic parts Market Revenues & Volume, By Electro Mechanic, 2022-2032F |
6.2 Indonesia Electronic parts Market, By Application |
6.2.1 Overview and Analysis |
6.2.2 Indonesia Electronic parts Market Revenues & Volume, By Automotive, 2022-2032F |
6.2.3 Indonesia Electronic parts Market Revenues & Volume, By Communications, 2022-2032F |
6.2.4 Indonesia Electronic parts Market Revenues & Volume, By Computing Applications, 2022-2032F |
6.2.5 Indonesia Electronic parts Market Revenues & Volume, By Others, 2022-2032F |
7 Indonesia Electronic parts Market Import-Export Trade Statistics |
7.1 Indonesia Electronic parts Market Export to Major Countries |
7.2 Indonesia Electronic parts Market Imports from Major Countries |
8 Indonesia Electronic parts Market Key Performance Indicators |
9 Indonesia Electronic parts Market - Opportunity Assessment |
9.1 Indonesia Electronic parts Market Opportunity Assessment, By Type, 2022 & 2032F |
9.2 Indonesia Electronic parts Market Opportunity Assessment, By Application, 2022 & 2032F |
10 Indonesia Electronic parts Market - Competitive Landscape |
10.1 Indonesia Electronic parts Market Revenue Share, By Companies, 2025 |
10.2 Indonesia Electronic parts Market Competitive Benchmarking, By Operating and Technical Parameters |
11 Company Profiles |
12 Recommendations |
13 Disclaimer |
Global Go To Market Strategy - 2030
Export potential enables firms to identify high-growth global markets with greater confidence by combining advanced trade intelligence with a structured quantitative methodology. The framework analyzes emerging demand trends and country-level import patterns while integrating macroeconomic and trade datasets such as GDP and population forecasts, bilateral import–export flows, tariff structures, elasticity differentials between developed and developing economies, geographic distance, and import demand projections. Using weighted trade values from 2020–2024 as the base period to project country-to-country export potential for 2030, these inputs are operationalized through calculated drivers such as gravity model parameters, tariff impact factors, and projected GDP per-capita growth. Through an analysis of hidden potentials, demand hotspots, and market conditions that are most favorable to success, this method enables firms to focus on target countries, maximize returns, and global expansion with data, backed by accuracy.
By factoring in the projected importer demand gap that is currently unmet and could be potential opportunity, it identifies the potential for the Exporter (Country) among 190 countries, against the general trade analysis, which identifies the biggest importer or exporter.
To discover high-growth global markets and optimize your business strategy:
Click Here
Pricing
- Single User License$ 1,995
- Department License$ 2,400
- Site License$ 3,120
- Global License$ 3,795

Leadership Perspectives from Industry Events
Search
Thought Leadership and Analyst Meet


Our Clients
6WResearch In News
- India Air Conditioner Market Set for Strong Rebound in 2026 After Weather-Led Correction and GST-Driven Recovery: 6Wresearch
- ADAS in India: How Automatic Emergency Braking, Blind Spot Detection & Driver Monitoring are Transforming Road Safety
- Doha a strategic location for EV manufacturing hub: IPA Qatar
- Demand for luxury TVs surging in the GCC, says Samsung
- Empowering Growth: The Thriving Journey of Bangladesh’s Cable Industry
- Demand for luxury TVs surging in the GCC, says Samsung
Latest Reports
- Nicaragua RPG Gaming Market (2026-2032)
- New Zealand RPG Gaming Market (2026-2032)
- Netherlands RPG Gaming Market (2026-2032)
- Nauru RPG Gaming Market (2026-2032)
- Namibia RPG Gaming Market (2026-2032)
- Mozambique RPG Gaming Market (2026-2032)
- Montenegro RPG Gaming Market (2026-2032)
- Mongolia RPG Gaming Market (2026-2032)
- Monaco RPG Gaming Market (2026-2032)
- Micronesia RPG Gaming Market (2026-2032)
Industry Events and Analyst Meet

HIMTEX 2026

India Refining Summit 2026

India EV Show 2026

EV tech India Expo 2026

Auto Tech Asia 2026
Whitepaper
- Middle East & Africa Commercial Security Market Click here to view more.
- Middle East & Africa Fire Safety Systems & Equipment Market Click here to view more.
- GCC Drone Market Click here to view more.
- Middle East Lighting Fixture Market Click here to view more.
- GCC Physical & Perimeter Security Market Click here to view more.