Indonesia Fiber Optic Components Market (2026-2032) Outlook | Industry, Forecast, Growth, Companies, Analysis, Revenue, Trends, Value, Share & Size
Market Forecast By Type (Cables, Active Optical Cables, Amplifiers, Splitters, Connectors, Circulators, Transceivers, Others), By Data Rate (Less than 10Gbps, 10 Gbps to 40Gbps, 41 Gbps to 100Gbps, More than 100 Gbps), By Application (Distributed Sensing, Analytical and Medical Equipment, Lighting, Communications) And Competitive Landscape
| Product Code: ETC291988 | Publication Date: Aug 2022 | Updated Date: Mar 2026 | Product Type: Market Research Report | |
| Publisher: 6Wresearch | Author: Ravi Bhandari | No. of Pages: 75 | No. of Figures: 35 | No. of Tables: 20 |
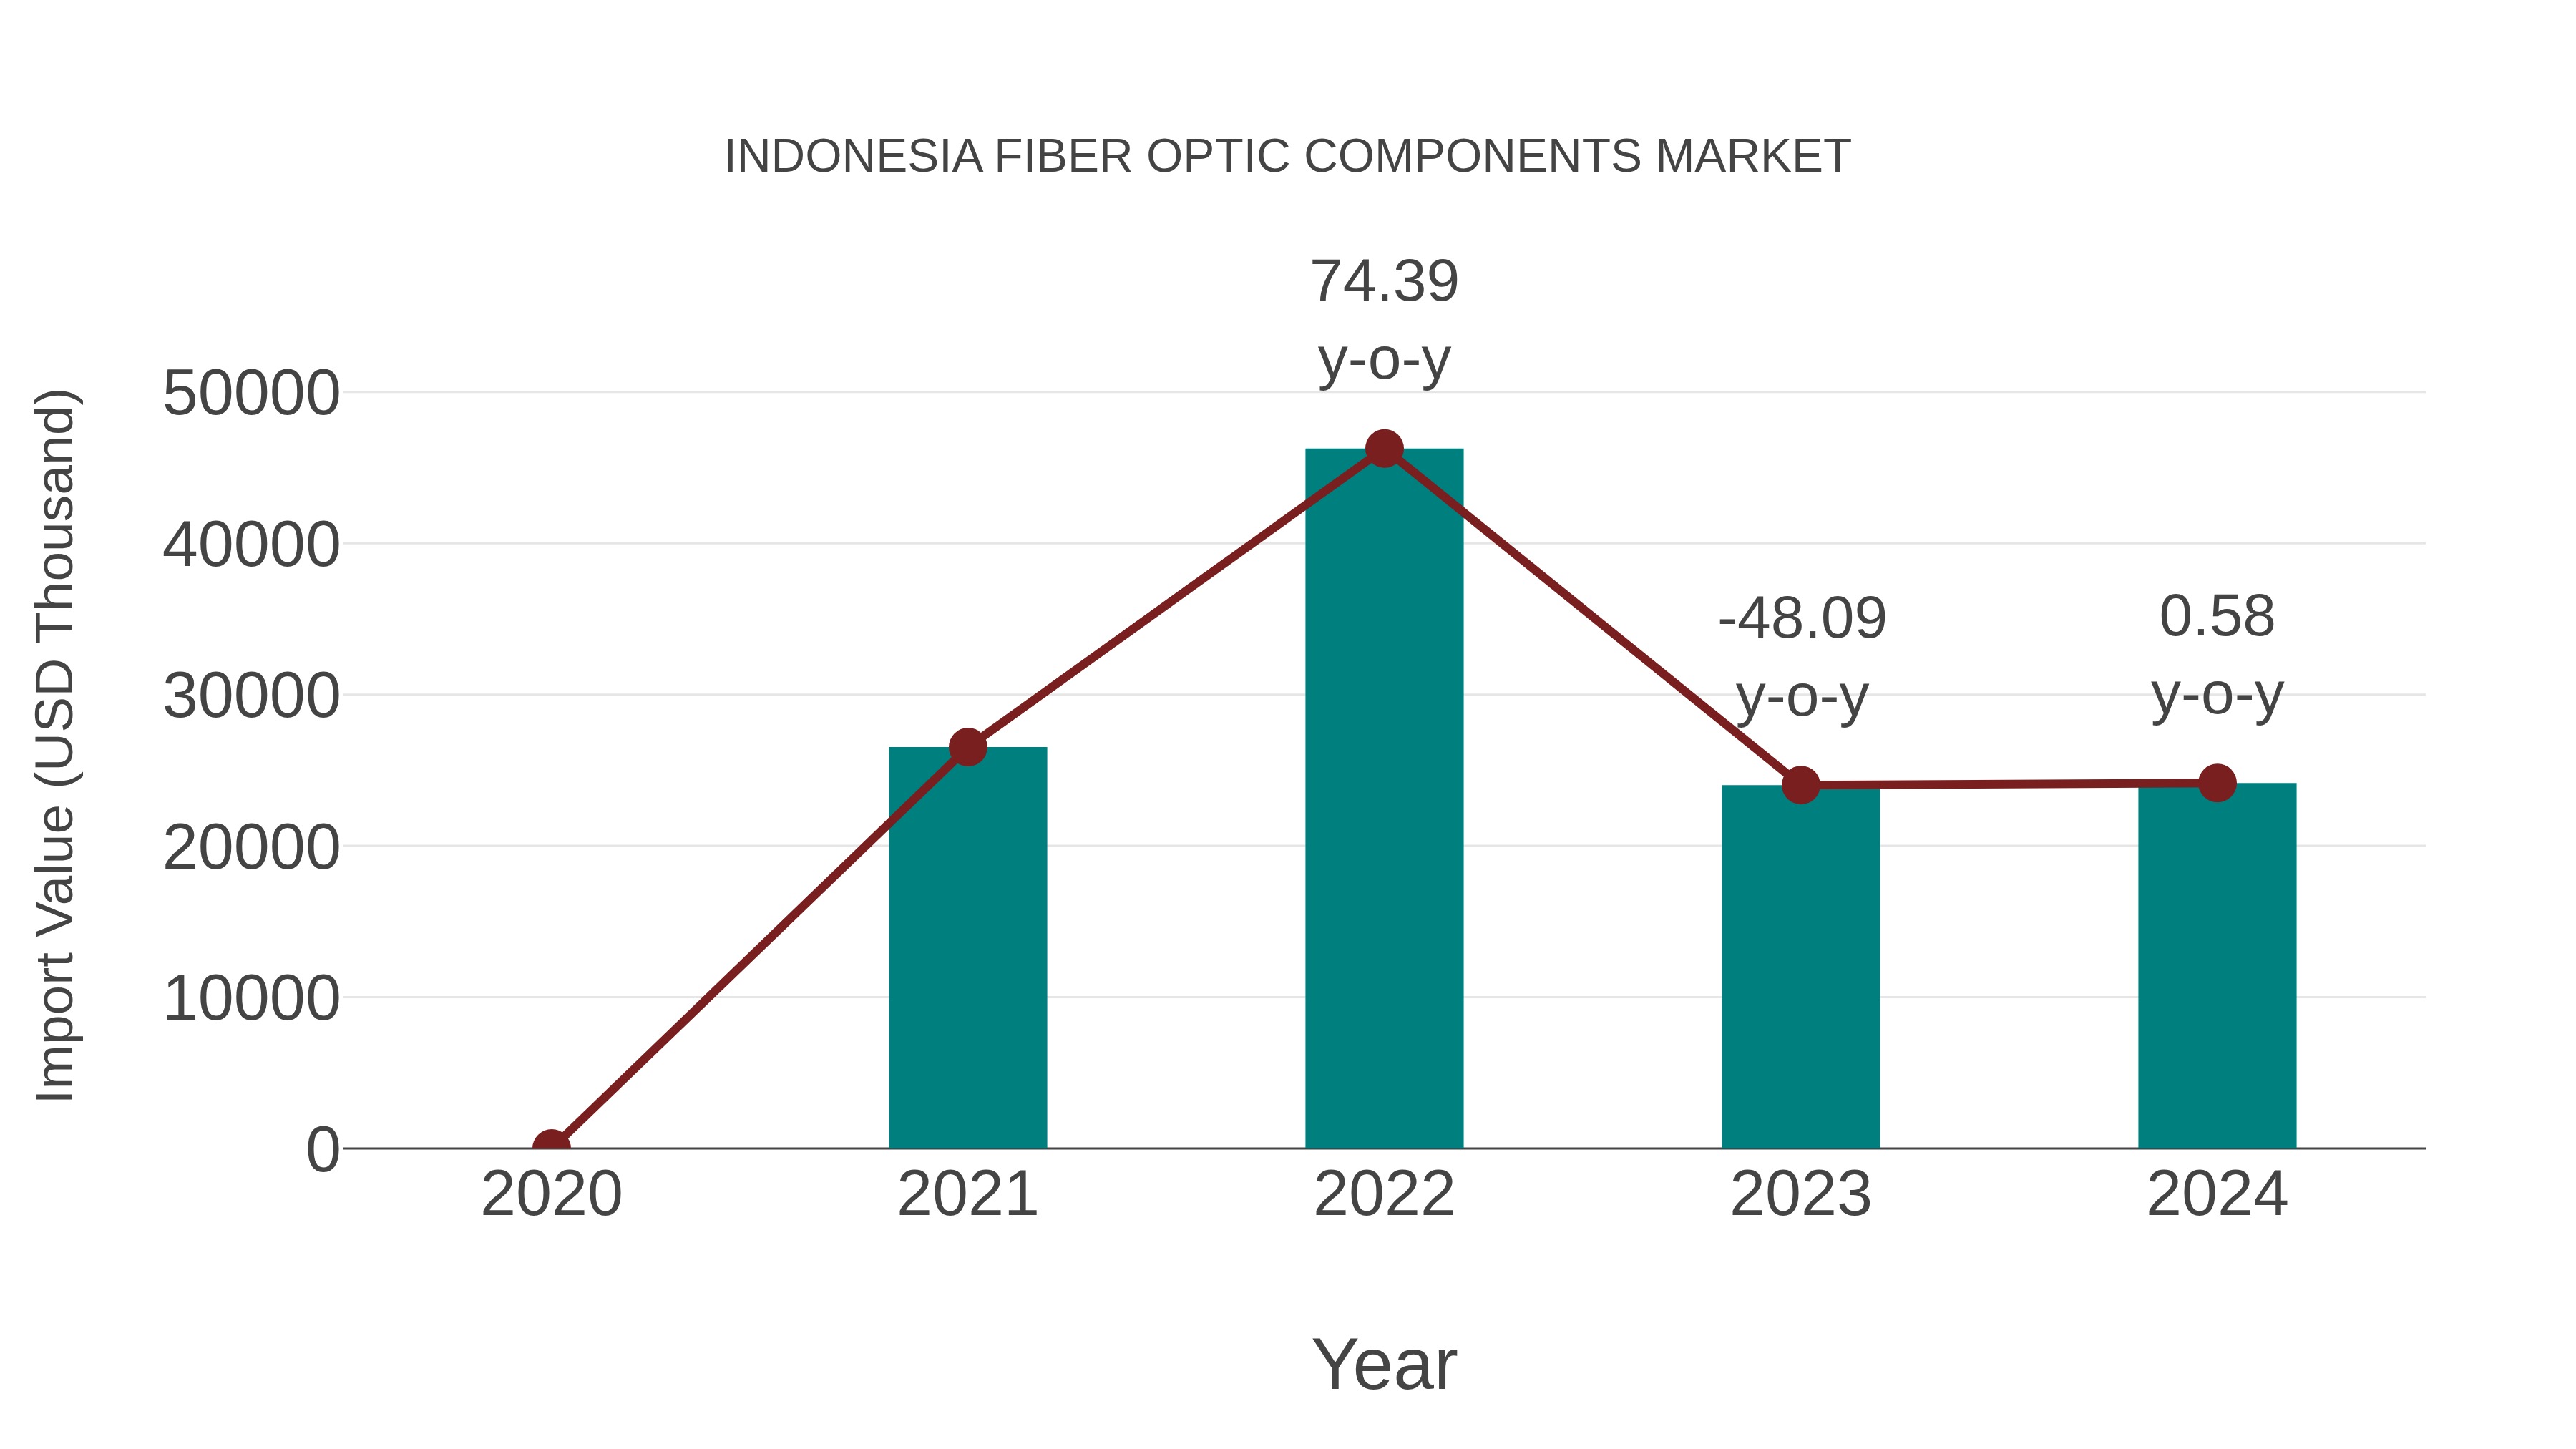
Indonesia Fiber Optic Components Market: Import Trend Analysis
In the Indonesia fiber optic components market, the import trend showed a growth rate of 0.58% from 2023 to 2024, with a compound annual growth rate (CAGR) of -3.08% from 2020 to 2024. This decline in CAGR may be attributed to shifts in demand or market stabilization efforts.
Indonesia Fiber Optic Components Market Synopsis
The fiber optic components market in Indonesia was worth US$ 81 million in 2025 and is expected to reach a value of US$ 108 million by 2031 with a compound annual growth rate (CAGR) of 4.1%. This rise can be attributed to increasing investments made into communication infrastructure throughout Indonesia as well as rising demand from industries such as medicine, telecommunications, oil & gas exploration, etc., resulting in increased adoption of fiber optic technologies amongst these sectors. Additionally, an increase in government initiatives encouraging digital transformation among businesses is also driving this trend forward furthering it?s reach within various areas leading up until 2031 ? making it increasingly popular compared to traditional copper wires or other mediums deployed due its transmission speed and reliability characteristics allowing users/services providers transfer data efficiently reducing time taken during operations significantly - therefore contributing towards more cost savings overall.
Drivers of the Market
The growing demand for high-speed internet and data transmission, increasing smartphone and mobile device penetration, government initiatives to expand digital infrastructure, and the rise of e-commerce are driving the demand for fiber optic components.
Challenges of the Market
The challenge lies in keeping up with the increasing demand for high-speed internet and data transmission services. Companies in this sector need to invest in research and development to stay competitive and provide cutting-edge products to meet the growing demand.
COVID-19 Impact on the Market
The increased reliance on remote work and digital communication during the pandemic may have driven demand for high-speed internet and data transmission, potentially boosting the fiber optic components market.
Key Players in the Market
The fiber optic components market in Indonesia is expected to see growth due to increasing demand for high-speed data transmission and communication networks. PT Telkom Indonesia, PT Indosat Tbk, PT XL Axiata Tbk, Huawei Technologies Co., Ltd., FiberStar, and Prysmian Group.
Key Highlights of the Report:
- Indonesia Fiber Optic Components Market Outlook
- Market Size of Indonesia Fiber Optic Components Market, 2025
- Forecast of Indonesia Fiber Optic Components Market, 2032
- Historical Data and Forecast of Indonesia Fiber Optic Components Revenues & Volume for the Period 2022-2032F
- Indonesia Fiber Optic Components Market Trend Evolution
- Indonesia Fiber Optic Components Market Drivers and Challenges
- Indonesia Fiber Optic Components Price Trends
- Indonesia Fiber Optic Components Porter's Five Forces
- Indonesia Fiber Optic Components Industry Life Cycle
- Historical Data and Forecast of Indonesia Fiber Optic Components Market Revenues & Volume By Type for the Period 2022-2032F
- Historical Data and Forecast of Indonesia Fiber Optic Components Market Revenues & Volume By Cables for the Period 2022-2032F
- Historical Data and Forecast of Indonesia Fiber Optic Components Market Revenues & Volume By Active Optical Cables for the Period 2022-2032F
- Historical Data and Forecast of Indonesia Fiber Optic Components Market Revenues & Volume By Amplifiers for the Period 2022-2032F
- Historical Data and Forecast of Indonesia Fiber Optic Components Market Revenues & Volume By Splitters for the Period 2022-2032F
- Historical Data and Forecast of Indonesia Fiber Optic Components Market Revenues & Volume By Connectors for the Period 2022-2032F
- Historical Data and Forecast of Indonesia Fiber Optic Components Market Revenues & Volume By Circulators for the Period 2022-2032F
- Historical Data and Forecast of Indonesia Fiber Optic Components Market Revenues & Volume By Transceivers for the Period 2022-2032F
- Historical Data and Forecast of Indonesia Cables Fiber Optic Components Market Revenues & Volume By Others for the Period 2022-2032F
- Historical Data and Forecast of Indonesia Fiber Optic Components Market Revenues & Volume By Data Rate for the Period 2022-2032F
- Historical Data and Forecast of Indonesia Fiber Optic Components Market Revenues & Volume By Less than 10Gbps for the Period 2022-2032F
- Historical Data and Forecast of Indonesia Fiber Optic Components Market Revenues & Volume By 10 Gbps to 40Gbps for the Period 2022-2032F
- Historical Data and Forecast of Indonesia Fiber Optic Components Market Revenues & Volume By 41 Gbps to 100Gbps for the Period 2022-2032F
- Historical Data and Forecast of Indonesia Fiber Optic Components Market Revenues & Volume By More than 100 Gbps for the Period 2022-2032F
- Historical Data and Forecast of Indonesia Fiber Optic Components Market Revenues & Volume By Application for the Period 2022-2032F
- Historical Data and Forecast of Indonesia Fiber Optic Components Market Revenues & Volume By Distributed Sensing for the Period 2022-2032F
- Historical Data and Forecast of Indonesia Fiber Optic Components Market Revenues & Volume By Analytical and Medical Equipment for the Period 2022-2032F
- Historical Data and Forecast of Indonesia Fiber Optic Components Market Revenues & Volume By Lighting for the Period 2022-2032F
- Historical Data and Forecast of Indonesia Fiber Optic Components Market Revenues & Volume By Communications for the Period 2022-2032F
- Indonesia Fiber Optic Components Import Export Trade Statistics
- Market Opportunity Assessment By Type
- Market Opportunity Assessment By Data Rate
- Market Opportunity Assessment By Application
- Indonesia Fiber Optic Components Top Companies Market Share
- Indonesia Fiber Optic Components Competitive Benchmarking By Technical and Operational Parameters
- Indonesia Fiber Optic Components Company Profiles
- Indonesia Fiber Optic Components Key Strategic Recommendations
Indonesia Fiber Optic Components Market (2026-2032): FAQs
6Wresearch actively monitors the Indonesia Fiber Optic Components Market and publishes its comprehensive annual report, highlighting emerging trends, growth drivers, revenue analysis, and forecast outlook. Our insights help businesses to make data-backed strategic decisions with ongoing market dynamics. Our analysts track relevent industries related to the Indonesia Fiber Optic Components Market, allowing our clients with actionable intelligence and reliable forecasts tailored to emerging regional needs.
Yes, we provide customisation as per your requirements. To learn more, feel free to contact us on sales@6wresearch.com
1 Executive Summary |
2 Introduction |
2.1 Key Highlights of the Report |
2.2 Report Description |
2.3 Market Scope & Segmentation |
2.4 Research Methodology |
2.5 Assumptions |
3 Indonesia Fiber Optic Components Market Overview |
3.1 Indonesia Country Macro Economic Indicators |
3.2 Indonesia Fiber Optic Components Market Revenues & Volume, 2022 & 2032F |
3.3 Indonesia Fiber Optic Components Market - Industry Life Cycle |
3.4 Indonesia Fiber Optic Components Market - Porter's Five Forces |
3.5 Indonesia Fiber Optic Components Market Revenues & Volume Share, By Type, 2022 & 2032F |
3.6 Indonesia Fiber Optic Components Market Revenues & Volume Share, By Data Rate, 2022 & 2032F |
3.7 Indonesia Fiber Optic Components Market Revenues & Volume Share, By Application, 2022 & 2032F |
4 Indonesia Fiber Optic Components Market Dynamics |
4.1 Impact Analysis |
4.2 Market Drivers |
4.2.1 Increasing demand for high-speed internet services in Indonesia |
4.2.2 Government initiatives to improve digital infrastructure |
4.2.3 Growing adoption of cloud services and data centers in the country |
4.3 Market Restraints |
4.3.1 High initial investment costs for setting up fiber optic networks |
4.3.2 Limited skilled workforce for managing and maintaining fiber optic components |
4.3.3 Regulatory hurdles and licensing requirements for telecom infrastructure development |
5 Indonesia Fiber Optic Components Market Trends |
6 Indonesia Fiber Optic Components Market, By Types |
6.1 Indonesia Fiber Optic Components Market, By Type |
6.1.1 Overview and Analysis |
6.1.2 Indonesia Fiber Optic Components Market Revenues & Volume, By Type, 2022-2032F |
6.1.3 Indonesia Fiber Optic Components Market Revenues & Volume, By Cables, 2022-2032F |
6.1.4 Indonesia Fiber Optic Components Market Revenues & Volume, By Active Optical Cables, 2022-2032F |
6.1.5 Indonesia Fiber Optic Components Market Revenues & Volume, By Amplifiers, 2022-2032F |
6.1.6 Indonesia Fiber Optic Components Market Revenues & Volume, By Splitters, 2022-2032F |
6.1.7 Indonesia Fiber Optic Components Market Revenues & Volume, By Connectors, 2022-2032F |
6.1.8 Indonesia Fiber Optic Components Market Revenues & Volume, By Circulators, 2022-2032F |
6.1.9 Indonesia Fiber Optic Components Market Revenues & Volume, By Others, 2022-2032F |
6.1.10 Indonesia Fiber Optic Components Market Revenues & Volume, By Others, 2022-2032F |
6.2 Indonesia Fiber Optic Components Market, By Data Rate |
6.2.1 Overview and Analysis |
6.2.2 Indonesia Fiber Optic Components Market Revenues & Volume, By Less than 10Gbps, 2022-2032F |
6.2.3 Indonesia Fiber Optic Components Market Revenues & Volume, By 10 Gbps to 40Gbps, 2022-2032F |
6.2.4 Indonesia Fiber Optic Components Market Revenues & Volume, By 41 Gbps to 100Gbps, 2022-2032F |
6.2.5 Indonesia Fiber Optic Components Market Revenues & Volume, By More than 100 Gbps, 2022-2032F |
6.3 Indonesia Fiber Optic Components Market, By Application |
6.3.1 Overview and Analysis |
6.3.2 Indonesia Fiber Optic Components Market Revenues & Volume, By Distributed Sensing, 2022-2032F |
6.3.3 Indonesia Fiber Optic Components Market Revenues & Volume, By Analytical and Medical Equipment, 2022-2032F |
6.3.4 Indonesia Fiber Optic Components Market Revenues & Volume, By Lighting, 2022-2032F |
6.3.5 Indonesia Fiber Optic Components Market Revenues & Volume, By Communications, 2022-2032F |
7 Indonesia Fiber Optic Components Market Import-Export Trade Statistics |
7.1 Indonesia Fiber Optic Components Market Export to Major Countries |
7.2 Indonesia Fiber Optic Components Market Imports from Major Countries |
8 Indonesia Fiber Optic Components Market Key Performance Indicators |
8.1 Average revenue per user (ARPU) for fiber optic services |
8.2 Percentage of population covered by fiber optic networks |
8.3 Average network uptime and reliability metrics |
9 Indonesia Fiber Optic Components Market - Opportunity Assessment |
9.1 Indonesia Fiber Optic Components Market Opportunity Assessment, By Type, 2022 & 2032F |
9.2 Indonesia Fiber Optic Components Market Opportunity Assessment, By Data Rate, 2022 & 2032F |
9.3 Indonesia Fiber Optic Components Market Opportunity Assessment, By Application, 2022 & 2032F |
10 Indonesia Fiber Optic Components Market - Competitive Landscape |
10.1 Indonesia Fiber Optic Components Market Revenue Share, By Companies, 2025 |
10.2 Indonesia Fiber Optic Components Market Competitive Benchmarking, By Operating and Technical Parameters |
11 Company Profiles |
12 Recommendations |
13 Disclaimer |
Global Go To Market Strategy - 2030
Export potential enables firms to identify high-growth global markets with greater confidence by combining advanced trade intelligence with a structured quantitative methodology. The framework analyzes emerging demand trends and country-level import patterns while integrating macroeconomic and trade datasets such as GDP and population forecasts, bilateral import–export flows, tariff structures, elasticity differentials between developed and developing economies, geographic distance, and import demand projections. Using weighted trade values from 2020–2024 as the base period to project country-to-country export potential for 2030, these inputs are operationalized through calculated drivers such as gravity model parameters, tariff impact factors, and projected GDP per-capita growth. Through an analysis of hidden potentials, demand hotspots, and market conditions that are most favorable to success, this method enables firms to focus on target countries, maximize returns, and global expansion with data, backed by accuracy.
By factoring in the projected importer demand gap that is currently unmet and could be potential opportunity, it identifies the potential for the Exporter (Country) among 190 countries, against the general trade analysis, which identifies the biggest importer or exporter.
To discover high-growth global markets and optimize your business strategy:
Click Here
Pricing
- Single User License$ 1,995
- Department License$ 2,400
- Site License$ 3,120
- Global License$ 3,795

Leadership Perspectives from Industry Events
Search
Thought Leadership and Analyst Meet


Our Clients
6WResearch In News
- India Air Conditioner Market Set for Strong Rebound in 2026 After Weather-Led Correction and GST-Driven Recovery: 6Wresearch
- ADAS in India: How Automatic Emergency Braking, Blind Spot Detection & Driver Monitoring are Transforming Road Safety
- Doha a strategic location for EV manufacturing hub: IPA Qatar
- Demand for luxury TVs surging in the GCC, says Samsung
- Empowering Growth: The Thriving Journey of Bangladesh’s Cable Industry
- Demand for luxury TVs surging in the GCC, says Samsung
Latest Reports
- Poland Fire Protection Systems Market (2026-2032)
- Cape Verde Portable Hand-Thrown Extinguisher Market (2026-2032)
- Canada Portable Hand-Thrown Extinguisher Market (2026-2032)
- Cameroon Portable Hand-Thrown Extinguisher Market (2026-2032)
- Burundi Portable Hand-Thrown Extinguisher Market (2026-2032)
- Burkina Faso Portable Hand-Thrown Extinguisher Market (2026-2032)
- Bulgaria Portable Hand-Thrown Extinguisher Market (2026-2032)
- Brunei Portable Hand-Thrown Extinguisher Market (2026-2032)
- Botswana Portable Hand-Thrown Extinguisher Market (2026-2032)
- Bosnia and Herzegovina Portable Hand-Thrown Extinguisher Market (2026-2032)
Industry Events and Analyst Meet

HIMTEX 2026

India Refining Summit 2026

India EV Show 2026

EV tech India Expo 2026

Auto Tech Asia 2026
Whitepaper
- Middle East & Africa Commercial Security Market Click here to view more.
- Middle East & Africa Fire Safety Systems & Equipment Market Click here to view more.
- GCC Drone Market Click here to view more.
- Middle East Lighting Fixture Market Click here to view more.
- GCC Physical & Perimeter Security Market Click here to view more.