Indonesia Fibre Optic Cables Market (2026-2032) | Trends, Revenue, Forecast, Analysis, Value, Size, Industry, Growth, Companies, Share & Outlook
Market Forecast By Cable Type (Single-mode Cable, Multi-mode Cable), By Material Type (Plastics Optical Fiber, Glass Optical Fiber), By End-users (IT and Telecom, BFSI, Defense and Aerospace, Manufacturing, Other ) And Competitive Landscape
| Product Code: ETC026448 | Publication Date: Jul 2023 | Updated Date: Jun 2026 | Product Type: Report | |
| Publisher: 6Wresearch | Author: Ravi Bhandari | No. of Pages: 70 | No. of Figures: 35 | No. of Tables: 5 |
Indonesia Fibre Optic Cables Market Summary
The indonesia fibre optic cables market was estimated at USD 276 Million in 2025 and is projected to reach USD 363 Million by 2032, growing at a CAGR of 5.5% from 2026 to 2032.
Indonesia Fibre Optic Cables Market Year-wise Growth Rate and Key Drivers
This graph highlights how the Indonesia Fibre Optic Cables Market has steadily grown over the past five years, supported by major growth factors.
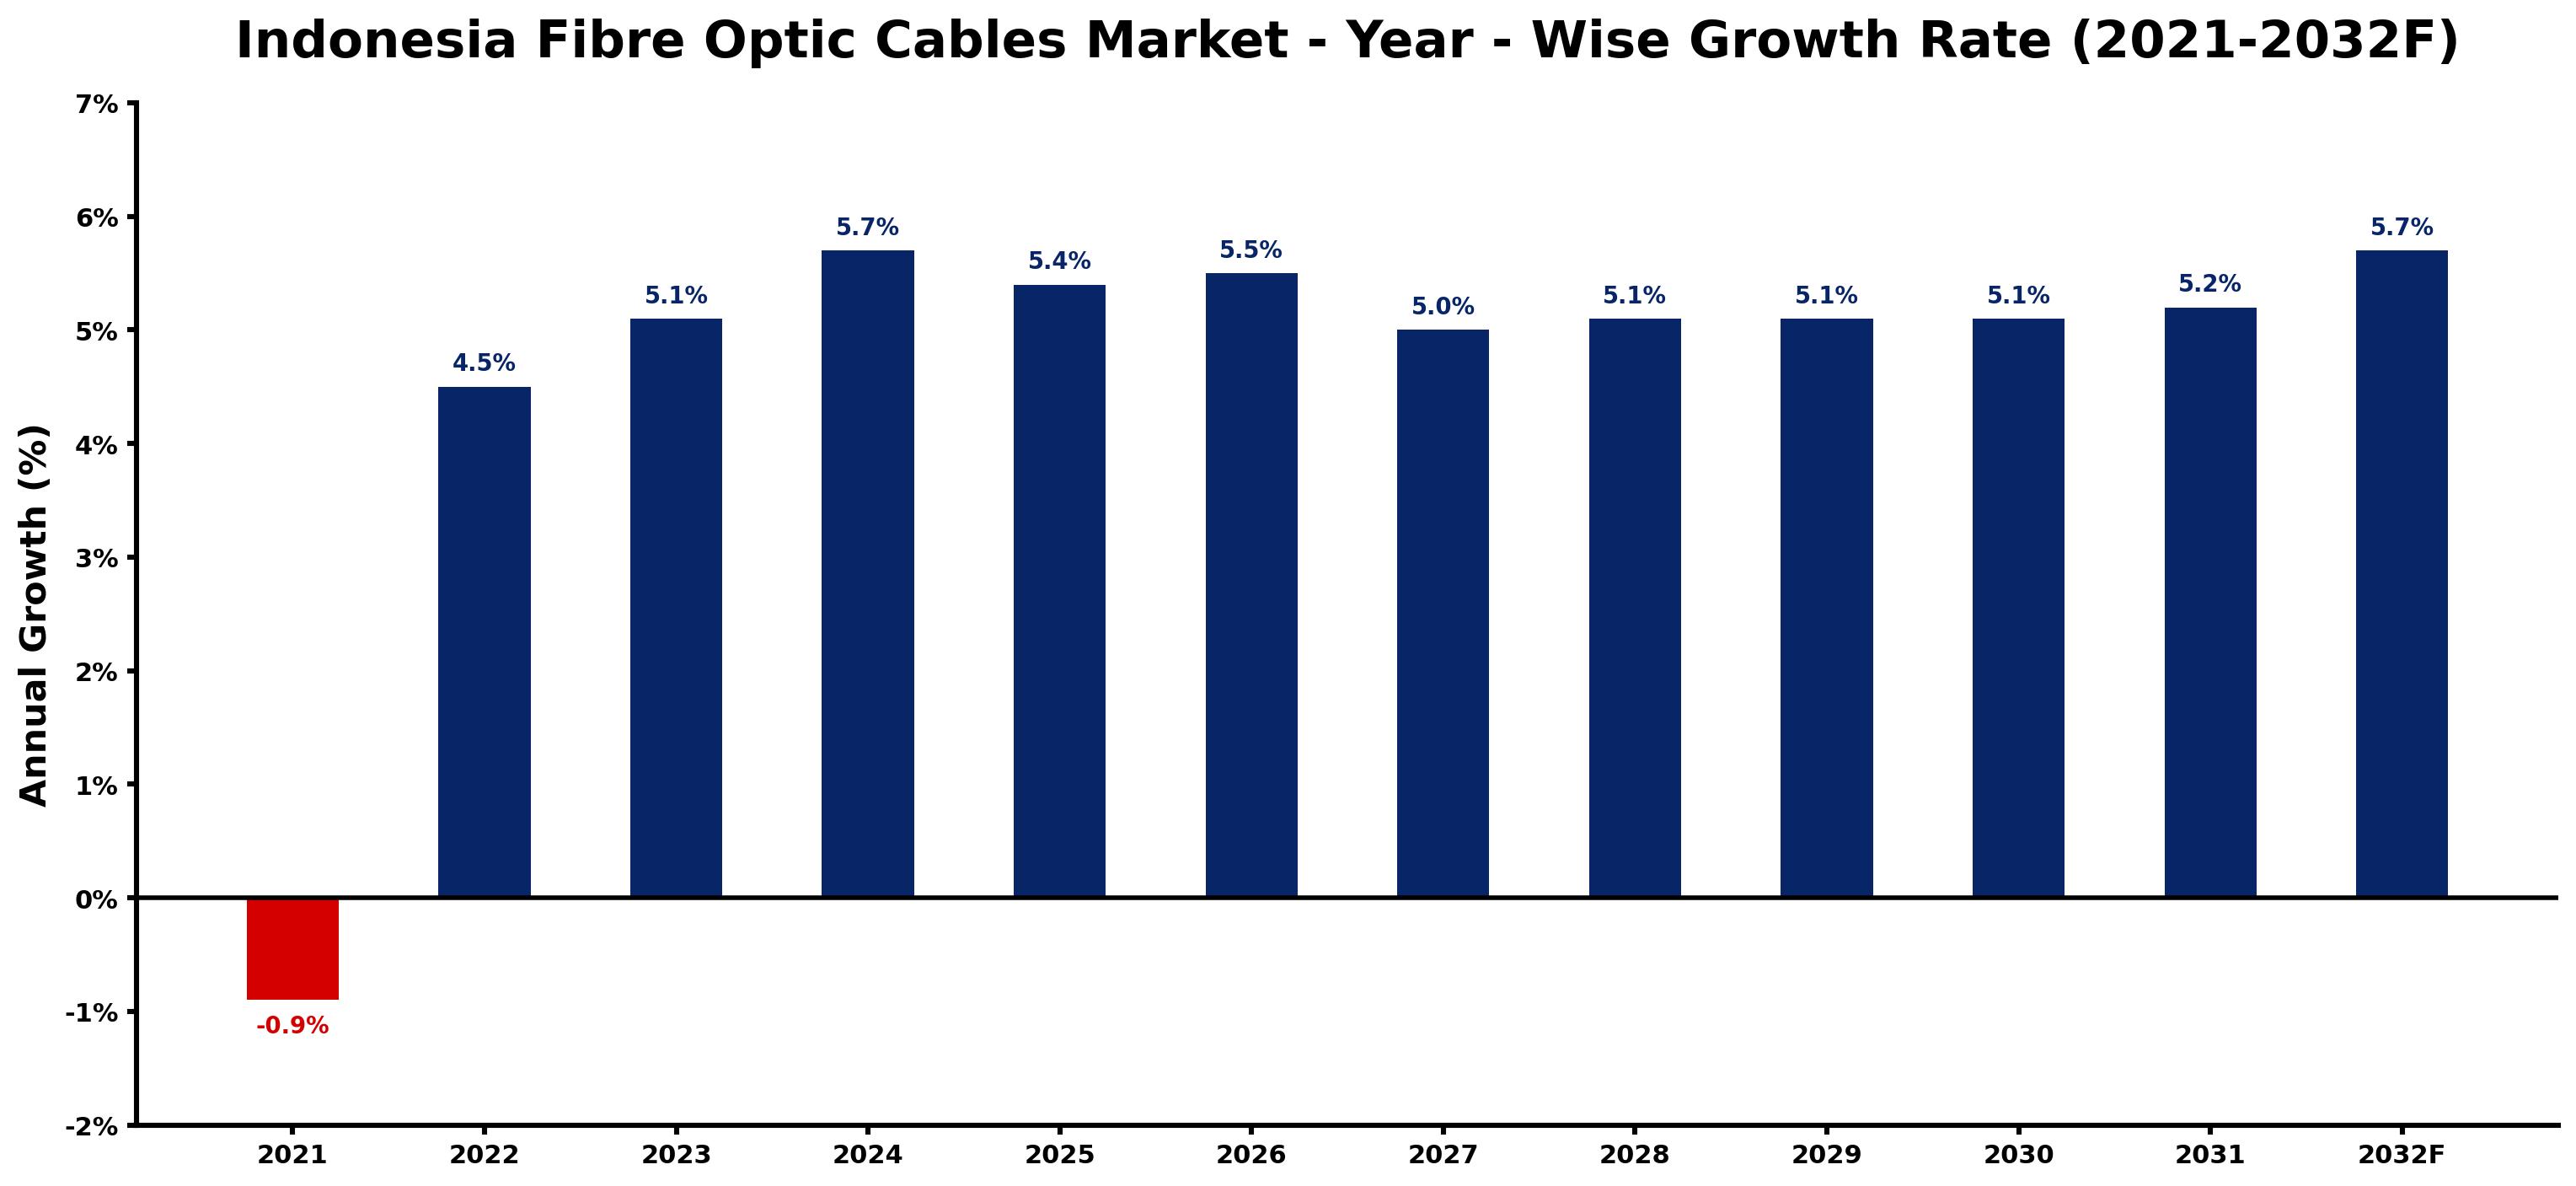
The table below presents the year wise growth rates along with the key drivers influencing the market
| Year | Growth Rate | Major Drivers |
| 2021 | -0.9% | Intensified supply chain disruptions hindered infrastructure projects, leading to reduced demand for fibre optic cables. |
| 2022 | 4.5% | Telecommunications companies expanded fiber networks to enhance connectivity in urban regions. |
| 2023 | 5.1% | Investment in smart city initiatives spurred demand for reliable fiber optic infrastructure. |
| 2024 | 5.7% | Increasing reliance on remote work heightened interest in high-speed internet access solutions. |
| 2025 | 5.4% | E-commerce expansion propelled the need for robust telecommunications infrastructure nationwide. |
| 2026 | 5.5% | Technological advancements in fiber cable production improved cost-efficiency and installation speed. |
| 2027 | 5.0% | Corporate partnerships emerged, pushing collaborative projects focused on fiber network expansion. |
| 2028 | 5.1% | Emerging tech startups demanded scalable fiber optic solutions for innovative service delivery. |
| 2029 | 5.1% | Rural electrification programs included fiber connectivity to bridge digital divides between regions. |
| 2030 | 5.1% | Smart grid systems required extensive fiber networking for enhanced data transmission capabilities. |
| 2031 | 5.2% | International investments in Indonesian technology sectors led to increased fiber optic system needs. |
| 2032 | 5.7% | Consumer behaviors shifted towards high-definition streaming, driving fiber optic market growth. |
Note - Market size estimations and growth projections presented in this report are based on 6Wresearch's advanced forecasting approach, validated with industry datasets as of June 2026.
Indonesia Fibre Optic Cables Market Synopsis
The Indonesia Fibre Optic Cables Market is projected to reach 5.5% and witness significant growth during the forecast period (2026-2032). The anticipated growth at a CAGR of 10.8% can be attributed to a combination of increasing investments in telecom infrastructure, the rising demand for high-speed internet and broadband services, the emergence of technologies such as 5G and IoT networks, and the trend of growing digitalization across various industries. Furthermore, government initiatives aimed at modernizing the IT infrastructure play a crucial role in driving the market. Despite these positive indicators, challenges such as a lack of awareness about newer technologies, the limited number of vendors, and economic instability pose risks to market growth.
Indonesia Fibre Optic Cables Market Growth Drivers
Several factors are contributing to the growth of the Indonesia Fibre Optic Cables Market. Key drivers include:
- Government Investment: The Indonesian government has heavily invested in upgrading telecommunication networks by replacing conventional copper cables with fiber optics. This transition is driven by fiber optics' superior transmission capabilities, which enable faster speeds and higher bandwidth to support multiple applications such as voice communication, data transfer, and video transmission.
- Urbanization: The growing urban population in Indonesia has led to increased mobile connectivity penetration rates. The proliferation of 4G technology has opened new opportunities for operators to launch innovative products that provide faster internet access, further driving demand for fiber optic cables.
- Technological Advancements: The development of next-generation wireless systems, particularly 5G, is reshaping existing networking environments. The implementation of IoT devices across diverse sectors necessitates the establishment of robust, high-performance optical networks, thereby increasing demand for advanced-grade optical fibers.
- Digitalization Trends: The ongoing digital transformation across industries is prompting businesses to adopt advanced technologies that improve operational efficiency. This trend requires reliable and high-speed internet infrastructure, which can be effectively supported by fibre optic cables.
- Increased Data Consumption: The surge in data consumption driven by streaming services, cloud computing, and online gaming has heightened the need for upgraded telecommunications infrastructure. Fiber optic cables serve as a vital solution to meet these rising demands for data bandwidth and speed.
Indonesia Fibre Optic Cables Market Challenges and Restraints
While the Indonesia Fibre Optic Cables Market shows promising growth potential, it also faces several challenges. These include:
- Lack of Awareness: A significant degree of unawareness among users regarding the benefits of transitioning from traditional copper cables to fiber optics inhibits market penetration. Many potential users remain unfamiliar with the advantages offered by newer technologies.
- Technical Expertise: The absence of technical expertise to deploy and maintain optical systems can lead to a lower adoption rate of fiber optic cables despite their advantages. Many users opt for familiar technologies to avoid the perceived complexities of newer solutions.
- Vendor Limitations: The market is characterized by a limited number of vendors, which can restrict competition and innovation. This lack of supplier diversity could hinder the availability of advanced products in the market.
- Economic Instability: Periods of economic volatility have the potential to impact public and private investment in telecommunication infrastructure. This instability may lead to delays in project implementation and a cautious approach to adopting new technologies.
- Regulatory Challenges: Navigating the regulatory framework concerning telecommunications can pose challenges for companies wishing to introduce fibre optic technologies, impacting the pace of market growth.
Indonesia Fibre Optic Cables Market Government Investment and Initiatives
The Indonesian government has played a vital role in advancing the fibre optic cables market through various investments and initiatives aimed at enhancing the country's telecommunications capabilities. Major components of these initiatives include:
- Infrastructure Development Projects: Significant public spending on telecommunications infrastructure has been directed toward modernizing existing networks and expanding services to underserved areas.
- Policy Frameworks: The government has implemented policies that encourage the adoption of fibre optic technologies, fostering an environment conducive to private investment in telecommunications.
- Public-Private Partnerships: Collaborative efforts between the government and private sector have been established to facilitate the deployment of fiber optic networks, making it easier to access funding and technical expertise.
- Incentives for Innovation: Initiatives promoting research and development in telecommunications have been introduced, aimed at encouraging the creation of cutting-edge solutions that incorporate fibre optic technologies.
- Regulatory Support: The government has undertaken measures to simplify the regulatory process surrounding telecommunications, making it easier for companies to navigate compliance issues while implementing fiber optic solutions.
Indonesia Fibre Optic Cables Market Latest Developments (May 2025 - June 2026)
Recent developments within the Indonesia Fibre Optic Cables Market indicate a dynamic shift toward growth and modernization. Key trends during this period include:
- Accelerated Network Upgrades: Efforts to replace aging telecommunications infrastructure with fiber optic networks have intensified, particularly in urban areas, driven by both government initiatives and private sector investments.
- Enhanced 5G Rollouts: The rollout of 5G technology has gained momentum, with focused implementations in metropolitan regions, leveraging the capabilities of fibre optic cables to support high data speeds.
- Increased Investments: Both domestic and foreign investment in the telecommunications sector surged, facilitating greater deployment of fiber optic systems to meet increasing data demands.
- Focus on Smart City Initiatives: As part of smart city initiatives, local governments are prioritizing the integration of fiber optic cables into urban infrastructures to promote connectivity and innovation.
- Collaborative Projects: Public-private partnerships are on the rise, enhancing collaboration for the development of advanced fiber optic networks to support IoT applications and smart solutions.
Indonesia Fibre Optic Cables Market - Key Attractiveness of the Report
- 10 Years of Market Numbers
- Historical Data Starting from 2022 to 2025
- Base Year: 2025
- Forecast Data until 2032
- Key Performance Indicators Impacting the Market
- Major Upcoming Developments and Projects
Key Highlights of the Report:
- Indonesia Fibre Optic Cables Market Outlook
- Market Size of Indonesia Fibre Optic Cables Market, 2025
- Forecast of Indonesia Fibre Optic Cables Market, 2032F
- Historical Data and Forecast of Indonesia Fibre Optic Cables Revenues & Volume for the Period 2022-2032F
- Indonesia Fibre Optic Cables Market Trend Evolution
- Indonesia Fibre Optic Cables Market Drivers and Challenges
- Indonesia Fibre Optic Cables Price Trends
- Indonesia Fibre Optic Cables Porter's Five Forces
- Indonesia Fibre Optic Cables Industry Life Cycle
- Historical Data and Forecast of Indonesia Fibre Optic Cables Market Revenues & Volume By Cable Type for the Period 2022-2032F
- Historical Data and Forecast of Indonesia Fibre Optic Cables Market Revenues & Volume By Single-mode Cable for the Period 2022-2032F
- Historical Data and Forecast of Indonesia Fibre Optic Cables Market Revenues & Volume By Multi-mode Cable for the Period 2022-2032F
- Historical Data and Forecast of Indonesia Fibre Optic Cables Market Revenues & Volume By Material Type for the Period 2022-2032F
- Historical Data and Forecast of Indonesia Fibre Optic Cables Market Revenues & Volume By Plastics Optical Fiber for the Period 2022-2032F
- Historical Data and Forecast of Indonesia Fibre Optic Cables Market Revenues & Volume By Glass Optical Fiber for the Period 2022-2032F
- Historical Data and Forecast of Indonesia Fibre Optic Cables Market Revenues & Volume By End-users for the Period 2022-2032F
- Historical Data and Forecast of Indonesia Fibre Optic Cables Market Revenues & Volume By IT and Telecom for the Period 2022-2032F
- Historical Data and Forecast of Indonesia Fibre Optic Cables Market Revenues & Volume By BFSI for the Period 2022-2032F
- Historical Data and Forecast of Indonesia Fibre Optic Cables Market Revenues & Volume By Defense and Aerospace for the Period 2022-2032F
- Historical Data and Forecast of Indonesia Fibre Optic Cables Market Revenues & Volume By Manufacturing for the Period 2022-2032F
- Historical Data and Forecast of Indonesia Fibre Optic Cables Market Revenues & Volume By Other for the Period 2022-2032F
- Indonesia Fibre Optic Cables Import Export Trade Statistics
- Market Opportunity Assessment By Cable Type
- Market Opportunity Assessment By Material Type
- Market Opportunity Assessment By End-users
- Indonesia Fibre Optic Cables Top Companies Market Share
- Indonesia Fibre Optic Cables Competitive Benchmarking By Technical and Operational Parameters
- Indonesia Fibre Optic Cables Company Profiles
- Indonesia Fibre Optic Cables Key Strategic Recommendations
Frequently Asked Questions About the Market Study (FAQs):
The market is projected to experience a CAGR of 10.8% during the forecast period of 2026-2032.
Key drivers include government investments, technological advancements, and the growing demand for high-speed internet among consumers.
Challenges include a lack of awareness about new technologies, limited vendor options, and economic instability affecting investment patterns.
The government is investing in infrastructure development and implementing policies to foster public-private partnerships that enhance the deployment of fiber optic networks.
6Wresearch actively monitors the Indonesia Fibre Optic Cables Market and publishes its comprehensive annual report, highlighting emerging trends, growth drivers, revenue analysis, and forecast outlook. Our insights help businesses to make data-backed strategic decisions with ongoing market dynamics. Our analysts track relevent industries related to the Indonesia Fibre Optic Cables Market, allowing our clients with actionable intelligence and reliable forecasts tailored to emerging regional needs.
Yes, we provide customisation as per your requirements. To learn more, feel free to contact us on sales@6wresearch.com
1 Executive Summary |
2 Introduction |
2.1 Key Highlights of the Report |
2.2 Report Description |
2.3 Market Scope & Segmentation |
2.4 Research Methodology |
2.5 Assumptions |
3 Indonesia Fibre Optic Cables Market Overview |
3.1 Indonesia Country Macro Economic Indicators |
3.2 Indonesia Fibre Optic Cables Market Revenues & Volume, 2022 & 2032F |
3.3 Indonesia Fibre Optic Cables Market - Industry Life Cycle |
3.4 Indonesia Fibre Optic Cables Market - Porter's Five Forces |
3.5 Indonesia Fibre Optic Cables Market Revenues & Volume Share, By Cable Type, 2022 & 2032F |
3.6 Indonesia Fibre Optic Cables Market Revenues & Volume Share, By Material Type, 2022 & 2032F |
3.7 Indonesia Fibre Optic Cables Market Revenues & Volume Share, By End-users, 2022 & 2032F |
4 Indonesia Fibre Optic Cables Market Dynamics |
4.1 Impact Analysis |
4.2 Market Drivers |
4.3 Market Restraints |
5 Indonesia Fibre Optic Cables Market Trends |
6 Indonesia Fibre Optic Cables Market, By Types |
6.1 Indonesia Fibre Optic Cables Market, By Cable Type |
6.1.1 Overview and Analysis |
6.1.2 Indonesia Fibre Optic Cables Market Revenues & Volume, By Cable Type, 2022-2032F |
6.1.3 Indonesia Fibre Optic Cables Market Revenues & Volume, By Single-mode Cable, 2022-2032F |
6.1.4 Indonesia Fibre Optic Cables Market Revenues & Volume, By Multi-mode Cable, 2022-2032F |
6.2 Indonesia Fibre Optic Cables Market, By Material Type |
6.2.1 Overview and Analysis |
6.2.2 Indonesia Fibre Optic Cables Market Revenues & Volume, By Plastics Optical Fiber, 2022-2032F |
6.2.3 Indonesia Fibre Optic Cables Market Revenues & Volume, By Glass Optical Fiber, 2022-2032F |
6.3 Indonesia Fibre Optic Cables Market, By End-users |
6.3.1 Overview and Analysis |
6.3.2 Indonesia Fibre Optic Cables Market Revenues & Volume, By IT and Telecom, 2022-2032F |
6.3.3 Indonesia Fibre Optic Cables Market Revenues & Volume, By BFSI, 2022-2032F |
6.3.4 Indonesia Fibre Optic Cables Market Revenues & Volume, By Defense and Aerospace, 2022-2032F |
6.3.5 Indonesia Fibre Optic Cables Market Revenues & Volume, By Manufacturing, 2022-2032F |
6.3.6 Indonesia Fibre Optic Cables Market Revenues & Volume, By Other , 2022-2032F |
7 Indonesia Fibre Optic Cables Market Import-Export Trade Statistics |
7.1 Indonesia Fibre Optic Cables Market Export to Major Countries |
7.2 Indonesia Fibre Optic Cables Market Imports from Major Countries |
8 Indonesia Fibre Optic Cables Market Key Performance Indicators |
9 Indonesia Fibre Optic Cables Market - Opportunity Assessment |
9.1 Indonesia Fibre Optic Cables Market Opportunity Assessment, By Cable Type, 2022 & 2032F |
9.2 Indonesia Fibre Optic Cables Market Opportunity Assessment, By Material Type, 2022 & 2032F |
9.3 Indonesia Fibre Optic Cables Market Opportunity Assessment, By End-users, 2022 & 2032F |
10 Indonesia Fibre Optic Cables Market - Competitive Landscape |
10.1 Indonesia Fibre Optic Cables Market Revenue Share, By Companies, 2025 |
10.2 Indonesia Fibre Optic Cables Market Competitive Benchmarking, By Operating and Technical Parameters |
11 Company Profiles |
12 Recommendations |
13 Disclaimer |
Global Go To Market Strategy - 2030
Export potential enables firms to identify high-growth global markets with greater confidence by combining advanced trade intelligence with a structured quantitative methodology. The framework analyzes emerging demand trends and country-level import patterns while integrating macroeconomic and trade datasets such as GDP and population forecasts, bilateral import–export flows, tariff structures, elasticity differentials between developed and developing economies, geographic distance, and import demand projections. Using weighted trade values from 2020–2024 as the base period to project country-to-country export potential for 2030, these inputs are operationalized through calculated drivers such as gravity model parameters, tariff impact factors, and projected GDP per-capita growth. Through an analysis of hidden potentials, demand hotspots, and market conditions that are most favorable to success, this method enables firms to focus on target countries, maximize returns, and global expansion with data, backed by accuracy.
By factoring in the projected importer demand gap that is currently unmet and could be potential opportunity, it identifies the potential for the Exporter (Country) among 190 countries, against the general trade analysis, which identifies the biggest importer or exporter.
To discover high-growth global markets and optimize your business strategy:
Click Here
Pricing
- Single User License$ 1,995
- Department License$ 2,400
- Site License$ 3,120
- Global License$ 3,795

Leadership Perspectives from Industry Events
Search
Thought Leadership and Analyst Meet


Our Clients
6WResearch In News
- India Air Conditioner Market Set for Strong Rebound in 2026 After Weather-Led Correction and GST-Driven Recovery: 6Wresearch
- ADAS in India: How Automatic Emergency Braking, Blind Spot Detection & Driver Monitoring are Transforming Road Safety
- Doha a strategic location for EV manufacturing hub: IPA Qatar
- Demand for luxury TVs surging in the GCC, says Samsung
- Empowering Growth: The Thriving Journey of Bangladesh’s Cable Industry
- Demand for luxury TVs surging in the GCC, says Samsung
Latest Reports
- Nicaragua RPG Gaming Market (2026-2032)
- New Zealand RPG Gaming Market (2026-2032)
- Netherlands RPG Gaming Market (2026-2032)
- Nauru RPG Gaming Market (2026-2032)
- Namibia RPG Gaming Market (2026-2032)
- Mozambique RPG Gaming Market (2026-2032)
- Montenegro RPG Gaming Market (2026-2032)
- Mongolia RPG Gaming Market (2026-2032)
- Monaco RPG Gaming Market (2026-2032)
- Micronesia RPG Gaming Market (2026-2032)
Industry Events and Analyst Meet

EV India Expo 2026

HIMTEX 2026

India Refining Summit 2026

India EV Show 2026

EV tech India Expo 2026
Whitepaper
- Middle East & Africa Commercial Security Market Click here to view more.
- Middle East & Africa Fire Safety Systems & Equipment Market Click here to view more.
- GCC Drone Market Click here to view more.
- Middle East Lighting Fixture Market Click here to view more.
- GCC Physical & Perimeter Security Market Click here to view more.