Indonesia Filtration Paper Market (2026-2032) Outlook | Share, Analysis, Revenue, Growth, Trends, Forecast, Companies, Industry, Size & Value
Market Forecast By Used (Hardwood, Softwood, Mineral Fibers, Fiber Crops), By Grade (Quantitative, Ash Less Grades, Low Ash Grades, Qualitative), By Size (Less Than 1.5 œ (Microns), 1.5 œ To 10 œ, 10 œ To 20 œ, 20 œ & Above), By End Use (Food & Beverages, Healthcare, Laboratories, Automotive, Others) And Competitive Landscape
| Product Code: ETC324928 | Publication Date: Aug 2022 | Updated Date: Jul 2026 | Product Type: Market Research Report | |
| Publisher: 6Wresearch | Author: Ravi Bhandari | No. of Pages: 75 | No. of Figures: 35 | No. of Tables: 20 |
Indonesia Filtration Paper Market Size, Share & Growth Rate
The Indonesia Filtration Paper Market was estimated at USD 404 Million in 2025 and is projected to reach USD 540 Million by 2032, growing at a CAGR of 4.2% from 2026 to 2032. This growth trajectory is propelled by the increasing demand for stringent quality assurance processes across critical sectors such as food and beverage processing, pharmaceuticals, and healthcare. Furthermore, a heightened awareness of environmental issues has led industries to adopt filtration papers for both air and water purification, positioning the market for robust future growth.
Indonesia Filtration Paper Market Year-wise Growth Rate and Key Drivers
This graph highlights how the Indonesia Filtration Paper Market has steadily grown over the years, supported by major growth factors.
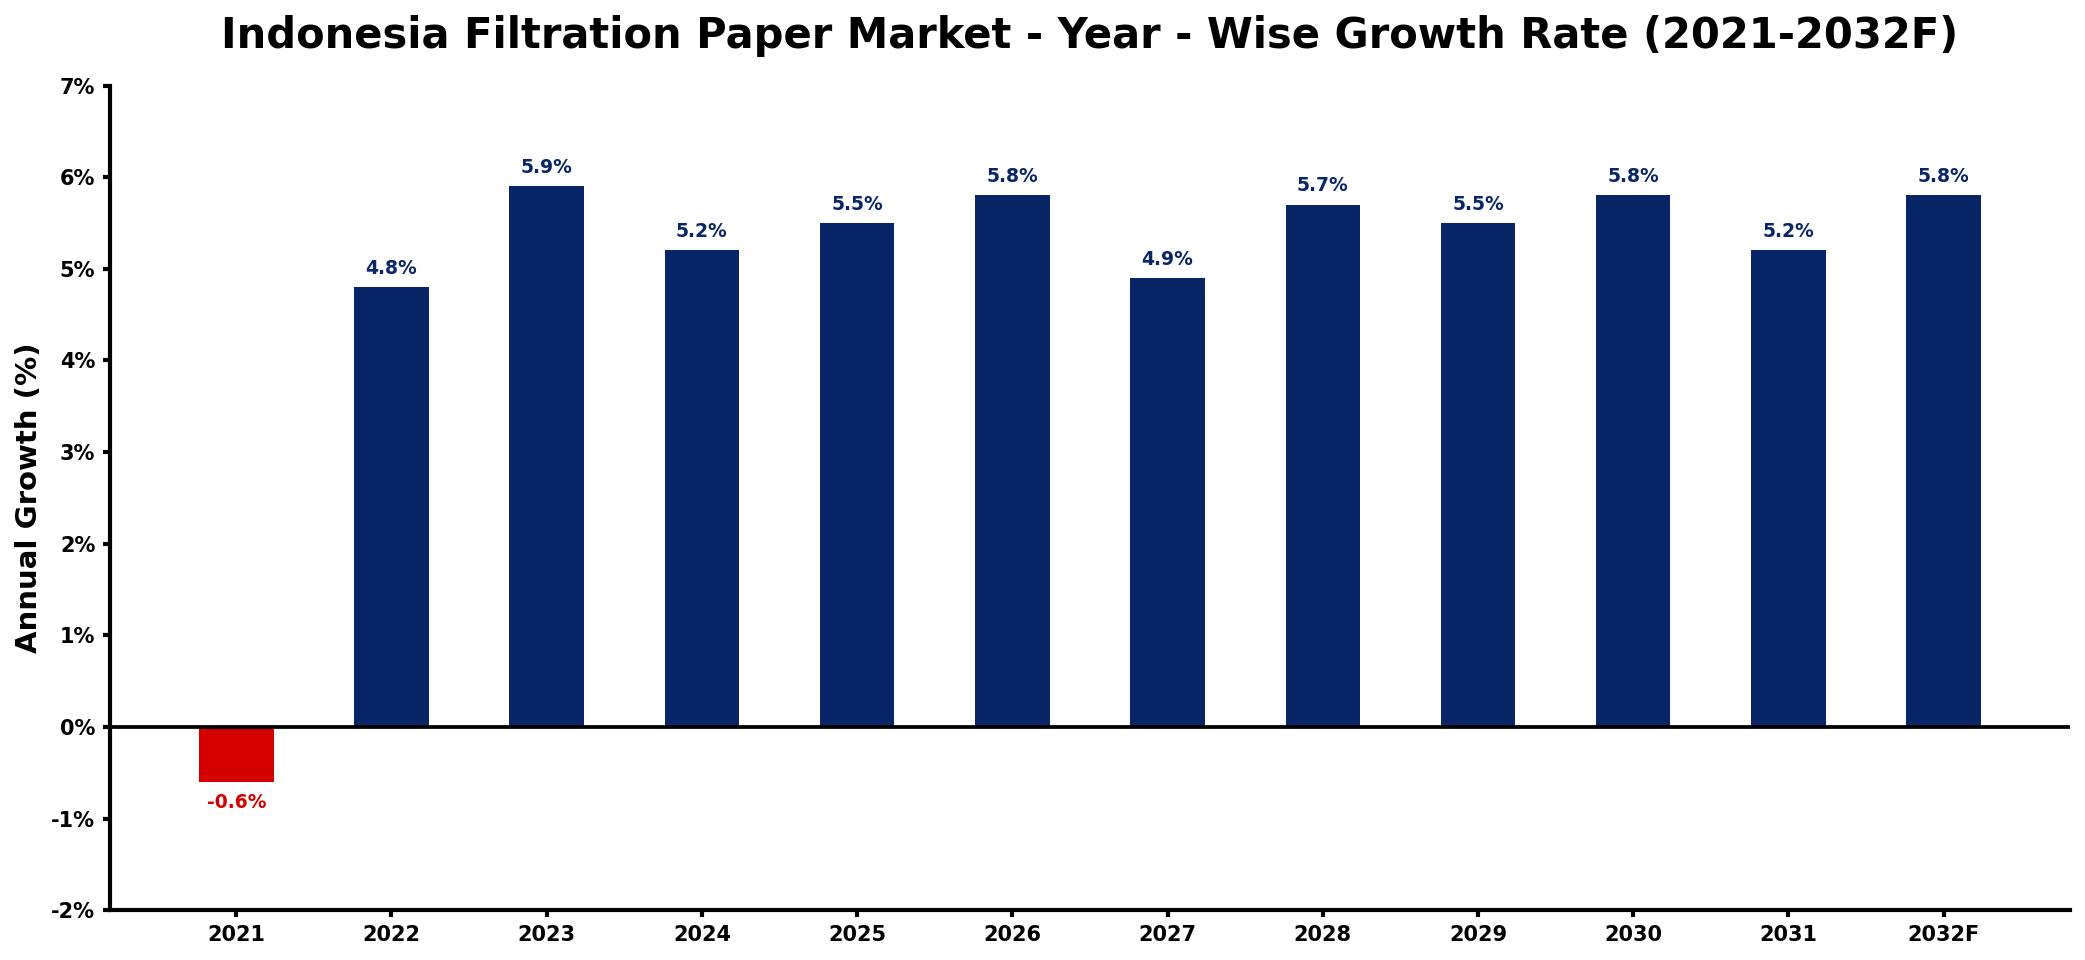
The table below presents the year‑wise growth rates along with the key drivers influencing the market
| Year | Growth Rate | Major Drivers |
| 2021 | -0.6% | decreased industrial production levels |
| 2022 | 4.8% | growing consumer health awareness |
| 2023 | 5.9% | increased manufacturing output demand |
| 2024 | 5.2% | expansion of beverage industry |
| 2025 | 5.5% | rising environmental regulations adoption |
| 2026 | 5.8% | enhanced technological innovations emergence |
| 2027 | 4.9% | growing demand for sustainable solutions |
| 2028 | 5.7% | rising procurement volume requirements |
| 2029 | 5.5% | increased investment in R&D |
| 2030 | 5.8% | rising popularity of eco-friendly products |
| 2031 | 5.2% | growing export market opportunities |
| 2032 | 5.8% | increased automation in production |
Note: Market size estimations and growth projections presented in this report are based on 6Wresearch's proprietary forecasting methodology, utilizing the latest available industry data, government publications, and primary research inputs.
Indonesia Filtration Paper Market Synopsis
The filtration paper market in Indonesia is characterized by a surge in investments aimed at improving water treatment facilities, largely driven by rising awareness of waterborne diseases. This trend has resulted in increased consumption of industrial-grade filter papers, particularly for pre-filtration processes in wastewater treatment systems.
Moreover, industries such as automotive are witnessing a growing need for filtration solutions, which further stimulates demand for specialized filtration papers used in oil and fuel filters. As these diverse applications expand, the market is set to benefit significantly from technological advancements and a focus on sustainability.
Indonesia Filtration Paper Market Key Takeaways
- The market is expected to witness consistent growth driven by industrial demand across multiple sectors.
- Growing environmental regulations are influencing the adoption of filtration solutions, emphasizing quality and efficiency.
- Innovative manufacturing practices are likely to lead to the development of biodegradable and eco-friendly filtration papers.
- The healthcare sector's expansion underscores the importance of filtration papers in diagnostics and laboratory applications.
- There is a notable trend towards automation and technological advancements in filtration processes across industries.
Evaluation of Restraints in Indonesia Filtration Paper Market
Despite the positive outlook, the Indonesia Filtration Paper Market faces notable restraints that could impede growth. Meeting strict quality and performance standards poses a significant challenge for manufacturers who must continuously innovate to ensure their products remain competitive. Furthermore, the market's fragmented nature and the presence of numerous players offering similar products necessitate a focus on differentiation to capture market share. Companies will need to invest in research and development to create filtration papers that not only meet but exceed current efficiency and reliability expectations.
Indonesia Filtration Paper Market Trends
Current trends in the Indonesia Filtration Paper Market reflect a clear shift towards sustainability and environmental consciousness. Manufacturers are increasingly investing in technologies that produce biodegradable and recyclable filtration products. Additionally, the integration of advanced filtration technologies, such as nanofilters, is gaining traction due to their superior efficiency in various applications. The move towards automation within the manufacturing processes is also reshaping the landscape, enhancing productivity and performance.
Indonesia Filtration Paper Market Opportunities
Significant growth opportunities are emerging within the Indonesia Filtration Paper Market, particularly in sectors emphasizing sustainability. The ongoing push for cleaner industrial practices and environmental stewardship is creating a fertile ground for innovative filtration solutions. Investments in infrastructure, particularly in water treatment facilities and healthcare, are likely to yield substantial returns for companies offering cutting-edge filtration products. Moreover, collaboration with local governments and NGOs focused on health and safety initiatives presents avenues for strategic partnerships and market expansion.
Government Initiatives in the Indonesia Filtration Paper Market
The Indonesian government is increasingly prioritizing environmental initiatives, including regulations aimed at improving water quality and air purity. Public spending on infrastructure development, particularly in water treatment and public health sectors, has risen significantly. These initiatives are aligned with national goals to enhance the quality of life for citizens and promote sustainable industrial practices. Such government focus not only strengthens the regulatory framework but also encourages investments in eco-friendly filtration technologies.
Future Insights of the Indonesia Filtration Paper Market
Looking ahead to 2026-2032, the Indonesia Filtration Paper Market is poised for continued growth fueled by advancements in technology and a firm commitment to sustainability. The shift towards eco-friendly products will likely drive innovation, enhancing performance and efficiency across applications. As industries increasingly recognize the importance of quality filtration in health and environmental safety, the demand for specialized filtration papers is expected to rise significantly. Furthermore, strategic investments in research and development will be critical in maintaining a competitive edge in this dynamic market.
Indonesia Filtration Paper Market Latest Developments (2025 - 2026)
Recent industry developments indicate a trend towards consolidation among key players, with several companies exploring partnerships to enhance their product offerings and market reach. Furthermore, the launch of innovative, sustainable filtration products has gained momentum, reflecting the industry's shift towards environmental responsibility. Initiatives aimed at improving production efficiencies through automation and technology integration have also gained traction, setting the stage for a more competitive landscape as companies seek to capitalize on emerging opportunities.
Indonesia Filtration Paper Market - Key Attractiveness of the Report
- 10 Years of Market Numbers
- Historical Data Starting from 2022 to 2025
- Base Year: 2025
- Forecast Data until 2032
- Key Performance Indicators Impacting the Market
- Major Upcoming Developments and Projects
Key Highlights of the Report:
- Indonesia Filtration Paper Market Outlook
- Market Size of Indonesia Filtration Paper Market, 2025
- Forecast of Indonesia Filtration Paper Market, 2032
- Historical Data and Forecast of Indonesia Filtration Paper Revenues & Volume for the Period 2022-2032F
- Indonesia Filtration Paper Market Trend Evolution
- Indonesia Filtration Paper Market Drivers and Challenges
- Indonesia Filtration Paper Price Trends
- Indonesia Filtration Paper Porter's Five Forces
- Indonesia Filtration Paper Industry Life Cycle
- Historical Data and Forecast of Indonesia Filtration Paper Market Revenues & Volume By Used for the Period 2022-2032F
- Historical Data and Forecast of Indonesia Filtration Paper Market Revenues & Volume By Hardwood for the Period 2022-2032F
- Historical Data and Forecast of Indonesia Filtration Paper Market Revenues & Volume By Softwood for the Period 2022-2032F
- Historical Data and Forecast of Indonesia Filtration Paper Market Revenues & Volume By Mineral Fibers for the Period 2022-2032F
- Historical Data and Forecast of Indonesia Filtration Paper Market Revenues & Volume By Fiber Crops for the Period 2022-2032F
- Historical Data and Forecast of Indonesia Filtration Paper Market Revenues & Volume By Grade for the Period 2022-2032F
- Historical Data and Forecast of Indonesia Filtration Paper Market Revenues & Volume By Quantitative for the Period 2022-2032F
- Historical Data and Forecast of Indonesia Filtration Paper Market Revenues & Volume By Ash Less Grades for the Period 2022-2032F
- Historical Data and Forecast of Indonesia Filtration Paper Market Revenues & Volume By Low Ash Grades for the Period 2022-2032F
- Historical Data and Forecast of Indonesia Filtration Paper Market Revenues & Volume By Qualitative for the Period 2022-2032F
- Historical Data and Forecast of Indonesia Filtration Paper Market Revenues & Volume By Size for the Period 2022-2032F
- Historical Data and Forecast of Indonesia Filtration Paper Market Revenues & Volume By Less Than 1.5 ? (Microns) for the Period 2022-2032F
- Historical Data and Forecast of Indonesia Filtration Paper Market Revenues & Volume By 1.5 ? To 10 ? for the Period 2022-2032F
- Historical Data and Forecast of Indonesia Filtration Paper Market Revenues & Volume By 10 ? To 20 ? for the Period 2022-2032F
- Historical Data and Forecast of Indonesia Filtration Paper Market Revenues & Volume By 20 ? & Above for the Period 2022-2032F
- Historical Data and Forecast of Indonesia Filtration Paper Market Revenues & Volume By End Use for the Period 2022-2032F
- Historical Data and Forecast of Indonesia Filtration Paper Market Revenues & Volume By Food & Beverages for the Period 2022-2032F
- Historical Data and Forecast of Indonesia Filtration Paper Market Revenues & Volume By Healthcare for the Period 2022-2032F
- Historical Data and Forecast of Indonesia Filtration Paper Market Revenues & Volume By Laboratories for the Period 2022-2032F
- Historical Data and Forecast of Indonesia Filtration Paper Market Revenues & Volume By Automotive for the Period 2022-2032F
- Historical Data and Forecast of Indonesia Filtration Paper Market Revenues & Volume By Others for the Period 2022-2032F
- Indonesia Filtration Paper Import Export Trade Statistics
- Market Opportunity Assessment By Used
- Market Opportunity Assessment By Grade
- Market Opportunity Assessment By Size
- Market Opportunity Assessment By End Use
- Indonesia Filtration Paper Top Companies Market Share
- Indonesia Filtration Paper Competitive Benchmarking By Technical and Operational Parameters
- Indonesia Filtration Paper Company Profiles
- Indonesia Filtration Paper Key Strategic Recommendations
Frequently Asked Questions About the Market Study (FAQs):
The market is estimated at USD 404 Million in 2025 and is projected to reach USD 540 Million by 2032, growing at a CAGR of 4.2% from 2026 to 2032.
Key sectors include food and beverage processing, pharmaceuticals, automotive, and healthcare, each requiring high-quality filtration solutions to ensure product safety and compliance.
The government is promoting environmental regulations that bolster water and air quality, which in turn drives demand for effective filtration solutions in various industries.
Manufacturers must navigate stringent quality and performance standards, requiring continuous innovation and differentiation in a competitive landscape.
Trends include a focus on sustainability through the development of biodegradable materials, as well as advancements in filtration technology aimed at enhancing efficiency and effectiveness.
6Wresearch actively monitors the Indonesia Filtration Paper Market and publishes its comprehensive annual report, highlighting emerging trends, growth drivers, revenue analysis, and forecast outlook. Our insights help businesses to make data-backed strategic decisions with ongoing market dynamics. Our analysts track relevent industries related to the Indonesia Filtration Paper Market, allowing our clients with actionable intelligence and reliable forecasts tailored to emerging regional needs.
Yes, we provide customisation as per your requirements. To learn more, feel free to contact us on sales@6wresearch.com
1 Executive Summary |
2 Introduction |
2.1 Key Highlights of the Report |
2.2 Report Description |
2.3 Market Scope & Segmentation |
2.4 Research Methodology |
2.5 Assumptions |
3 Indonesia Filtration Paper Market Overview |
3.1 Indonesia Country Macro Economic Indicators |
3.2 Indonesia Filtration Paper Market Revenues & Volume, 2022 & 2032F |
3.3 Indonesia Filtration Paper Market - Industry Life Cycle |
3.4 Indonesia Filtration Paper Market - Porter's Five Forces |
3.5 Indonesia Filtration Paper Market Revenues & Volume Share, By Used, 2022 & 2032F |
3.6 Indonesia Filtration Paper Market Revenues & Volume Share, By Grade, 2022 & 2032F |
3.7 Indonesia Filtration Paper Market Revenues & Volume Share, By Size, 2022 & 2032F |
3.8 Indonesia Filtration Paper Market Revenues & Volume Share, By End Use, 2022 & 2032F |
4 Indonesia Filtration Paper Market Dynamics |
4.1 Impact Analysis |
4.2 Market Drivers |
4.2.1 Increasing demand for filtration papers in industries such as food and beverage, pharmaceuticals, and automotive due to stricter regulations and quality standards. |
4.2.2 Growth in industrialization and manufacturing activities leading to higher usage of filtration papers. |
4.2.3 Rising awareness about environmental sustainability driving the adoption of eco-friendly filtration papers. |
4.3 Market Restraints |
4.3.1 Fluctuations in raw material prices impacting the production cost of filtration papers. |
4.3.2 Intense competition among filtration paper manufacturers leading to pricing pressures. |
4.3.3 Economic uncertainties and political instability affecting investment decisions in the filtration paper market. |
5 Indonesia Filtration Paper Market Trends |
6 Indonesia Filtration Paper Market, By Types |
6.1 Indonesia Filtration Paper Market, By Used |
6.1.1 Overview and Analysis |
6.1.2 Indonesia Filtration Paper Market Revenues & Volume, By Used, 2022-2032F |
6.1.3 Indonesia Filtration Paper Market Revenues & Volume, By Hardwood, 2022-2032F |
6.1.4 Indonesia Filtration Paper Market Revenues & Volume, By Softwood, 2022-2032F |
6.1.5 Indonesia Filtration Paper Market Revenues & Volume, By Mineral Fibers, 2022-2032F |
6.1.6 Indonesia Filtration Paper Market Revenues & Volume, By Fiber Crops, 2022-2032F |
6.2 Indonesia Filtration Paper Market, By Grade |
6.2.1 Overview and Analysis |
6.2.2 Indonesia Filtration Paper Market Revenues & Volume, By Quantitative, 2022-2032F |
6.2.3 Indonesia Filtration Paper Market Revenues & Volume, By Ash Less Grades, 2022-2032F |
6.2.4 Indonesia Filtration Paper Market Revenues & Volume, By Low Ash Grades, 2022-2032F |
6.2.5 Indonesia Filtration Paper Market Revenues & Volume, By Qualitative, 2022-2032F |
6.3 Indonesia Filtration Paper Market, By Size |
6.3.1 Overview and Analysis |
6.3.2 Indonesia Filtration Paper Market Revenues & Volume, By Less Than 1.5 ? (Microns), 2022-2032F |
6.3.3 Indonesia Filtration Paper Market Revenues & Volume, By 1.5 ? To 10 ?, 2022-2032F |
6.3.4 Indonesia Filtration Paper Market Revenues & Volume, By 10 ? To 20 ?, 2022-2032F |
6.3.5 Indonesia Filtration Paper Market Revenues & Volume, By 20 ? & Above, 2022-2032F |
6.4 Indonesia Filtration Paper Market, By End Use |
6.4.1 Overview and Analysis |
6.4.2 Indonesia Filtration Paper Market Revenues & Volume, By Food & Beverages, 2022-2032F |
6.4.3 Indonesia Filtration Paper Market Revenues & Volume, By Healthcare, 2022-2032F |
6.4.4 Indonesia Filtration Paper Market Revenues & Volume, By Laboratories, 2022-2032F |
6.4.5 Indonesia Filtration Paper Market Revenues & Volume, By Automotive, 2022-2032F |
6.4.6 Indonesia Filtration Paper Market Revenues & Volume, By Others, 2022-2032F |
7 Indonesia Filtration Paper Market Import-Export Trade Statistics |
7.1 Indonesia Filtration Paper Market Export to Major Countries |
7.2 Indonesia Filtration Paper Market Imports from Major Countries |
8 Indonesia Filtration Paper Market Key Performance Indicators |
8.1 Percentage of market share held by eco-friendly filtration papers. |
8.2 Adoption rate of advanced filtration technologies in Indonesia. |
8.3 Percentage of revenue attributed to customized filtration paper solutions. |
8.4 Efficiency of supply chain management in delivering filtration papers to customers. |
8.5 Number of new product innovations in the filtration paper market segment. |
9 Indonesia Filtration Paper Market - Opportunity Assessment |
9.1 Indonesia Filtration Paper Market Opportunity Assessment, By Used, 2022 & 2032F |
9.2 Indonesia Filtration Paper Market Opportunity Assessment, By Grade, 2022 & 2032F |
9.3 Indonesia Filtration Paper Market Opportunity Assessment, By Size, 2022 & 2032F |
9.4 Indonesia Filtration Paper Market Opportunity Assessment, By End Use, 2022 & 2032F |
10 Indonesia Filtration Paper Market - Competitive Landscape |
10.1 Indonesia Filtration Paper Market Revenue Share, By Companies, 2025 |
10.2 Indonesia Filtration Paper Market Competitive Benchmarking, By Operating and Technical Parameters |
11 Company Profiles |
12 Recommendations |
13 Disclaimer |
Global Go To Market Strategy - 2030
Export potential enables firms to identify high-growth global markets with greater confidence by combining advanced trade intelligence with a structured quantitative methodology. The framework analyzes emerging demand trends and country-level import patterns while integrating macroeconomic and trade datasets such as GDP and population forecasts, bilateral import–export flows, tariff structures, elasticity differentials between developed and developing economies, geographic distance, and import demand projections. Using weighted trade values from 2020–2024 as the base period to project country-to-country export potential for 2030, these inputs are operationalized through calculated drivers such as gravity model parameters, tariff impact factors, and projected GDP per-capita growth. Through an analysis of hidden potentials, demand hotspots, and market conditions that are most favorable to success, this method enables firms to focus on target countries, maximize returns, and global expansion with data, backed by accuracy.
By factoring in the projected importer demand gap that is currently unmet and could be potential opportunity, it identifies the potential for the Exporter (Country) among 190 countries, against the general trade analysis, which identifies the biggest importer or exporter.
To discover high-growth global markets and optimize your business strategy:
Click Here
Pricing
- Single User License$ 1,995
- Department License$ 2,400
- Site License$ 3,120
- Global License$ 3,795

Leadership Perspectives from Industry Events
Search
Thought Leadership and Analyst Meet


Our Clients
6WResearch In News
- India Air Conditioner Market Set for Strong Rebound in 2026 After Weather-Led Correction and GST-Driven Recovery: 6Wresearch
- ADAS in India: How Automatic Emergency Braking, Blind Spot Detection & Driver Monitoring are Transforming Road Safety
- Doha a strategic location for EV manufacturing hub: IPA Qatar
- Demand for luxury TVs surging in the GCC, says Samsung
- Empowering Growth: The Thriving Journey of Bangladesh’s Cable Industry
- Demand for luxury TVs surging in the GCC, says Samsung
Latest Reports
- Nicaragua RPG Gaming Market (2026-2032)
- New Zealand RPG Gaming Market (2026-2032)
- Netherlands RPG Gaming Market (2026-2032)
- Nauru RPG Gaming Market (2026-2032)
- Namibia RPG Gaming Market (2026-2032)
- Mozambique RPG Gaming Market (2026-2032)
- Montenegro RPG Gaming Market (2026-2032)
- Mongolia RPG Gaming Market (2026-2032)
- Monaco RPG Gaming Market (2026-2032)
- Micronesia RPG Gaming Market (2026-2032)
Industry Events and Analyst Meet

EV India Expo 2026

HIMTEX 2026

India Refining Summit 2026

India EV Show 2026

EV tech India Expo 2026
Whitepaper
- Middle East & Africa Commercial Security Market Click here to view more.
- Middle East & Africa Fire Safety Systems & Equipment Market Click here to view more.
- GCC Drone Market Click here to view more.
- Middle East Lighting Fixture Market Click here to view more.
- GCC Physical & Perimeter Security Market Click here to view more.