Indonesia Gas Sensors Market (2026-2032) Outlook | Value, Revenue, Companies, Size, Analysis, Growth, Forecast, Share, Trends & Industry
Market Forecast By Product (Hydrogen, Ammonia, Hydrogen Sulfide, Methyl Mercaptan Sensor, NOx Sensor, Carbon Monoxide Sensor, Carbon Dioxide Sensor, Oxygen/Lambda Sensor), By Technology (Infrared, Catalytic, Photo-Ionization Detector, Solid State/MOS, Semiconductor, Electrochemical) And Competitive Landscape
| Product Code: ETC326428 | Publication Date: Aug 2022 | Updated Date: Jul 2026 | Product Type: Market Research Report | |
| Publisher: 6Wresearch | Author: Ravi Bhandari | No. of Pages: 75 | No. of Figures: 35 | No. of Tables: 20 |
Indonesia Gas Sensors Market Size, Share & Growth Rate
The Indonesia Gas Sensors Market was estimated at USD 468 Million in 2025 and is projected to reach USD 618 Million by 2032, growing at a CAGR of 4.1% from 2026 to 2032. This robust growth trajectory is driven by escalating concerns over air quality, intensified industrialization, and stringent governmental regulations aimed at reducing emissions. As industries and households alike prioritize air quality monitoring, the demand for advanced gas sensor technology is set to surge.
Indonesia Gas Sensors Market Year-wise Growth Rate and Key Drivers
This graph highlights how the Indonesia Gas Sensors Market has steadily grown over the years, supported by major growth factors.
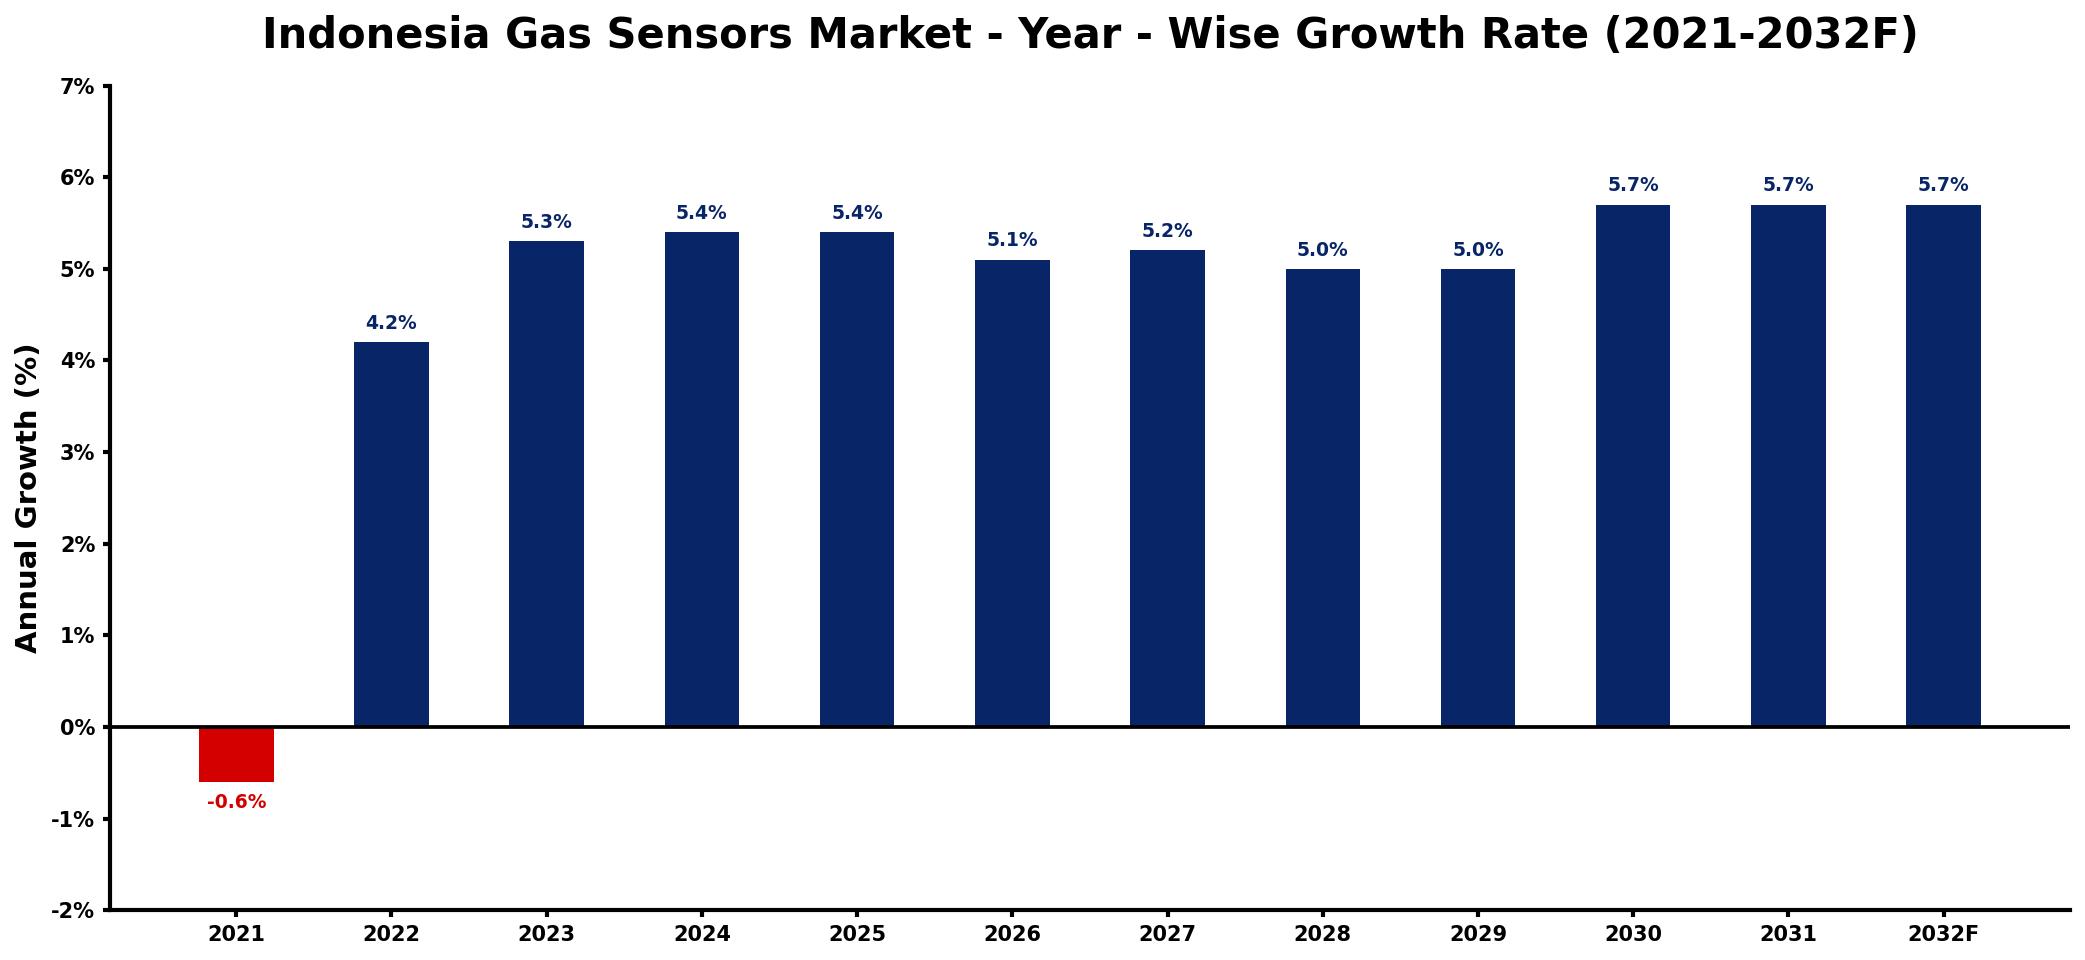
The table below presents the year‑wise growth rates along with the key drivers influencing the market
| Year | Growth Rate | Major Drivers |
| 2021 | -0.6% | decreased industrial safety investments |
| 2022 | 4.2% | increased environmental regulation compliance |
| 2023 | 5.3% | growing demand for smart technology |
| 2024 | 5.4% | expansion in renewable energy projects |
| 2025 | 5.4% | rising awareness of air quality |
| 2026 | 5.1% | increased industrial automation adoption |
| 2027 | 5.2% | growing urbanization and infrastructure development |
| 2028 | 5.0% | expanding applications in healthcare sector |
| 2029 | 5.0% | heightened focus on workplace safety |
| 2030 | 5.7% | increased government funding for innovation |
| 2031 | 5.7% | growing consumer demand for sustainability |
| 2032 | 5.7% | improved raw material availability |
Note: Market size estimations and growth projections presented in this report are based on 6Wresearch's proprietary forecasting methodology, utilizing the latest available industry data, government publications, and primary research inputs.
Indonesia Gas Sensors Market Synopsis
The Indonesia gas sensors market is currently experiencing significant momentum, fueled by an urgent need for effective air quality management solutions. Increased awareness of environmental degradation and health impacts from air pollution is pushing both consumers and industries towards adopting gas sensor technologies. This trend is contrasted by a historical reliance on less advanced methods, emphasizing a shift towards modern solutions.
Looking ahead, the market is poised for remarkable growth as technological advancements continue to improve the accuracy and reliability of gas sensors. Industries ranging from automotive to manufacturing are integrating these devices into their operations, aligning with global standards and regulations aimed at reducing emissions and enhancing workplace safety.
Indonesia Gas Sensors Market Key Takeaways
- The market is driven by increasing concerns regarding air quality and health hazards related to gas exposure.
- Technological innovations are enhancing sensor accuracy and reliability, making them more attractive for various applications.
- Government regulations are promoting the adoption of gas sensors in both industrial and residential sectors.
- Growth opportunities are significant in smart home systems and environmental monitoring sectors.
- The market dynamics are influenced by a combination of industrial growth and heightened public awareness of air pollution issues.
Evaluation of Restraints in Indonesia Gas Sensors Market
While the Indonesia gas sensors market presents numerous opportunities, it also faces certain restraints. Technological advancements necessitate continual innovation, which can strain resources for manufacturers. Additionally, the need for regular calibration and maintenance can limit widespread adoption, particularly among smaller enterprises. Environmental conditions, such as humidity and temperature fluctuations, can also impact sensor performance, creating challenges for reliability in diverse industrial settings.
Indonesia Gas Sensors Market Trends
Emerging trends in the Indonesia gas sensors market include a marked shift towards smart technologies and IoT integration. As automation in industrial processes grows, so does the incorporation of gas sensors into smart home systems, allowing for real-time air quality monitoring. Furthermore, the increasing focus on sustainability is prompting industries to invest in advanced sensor technologies that not only ensure compliance with regulations but also promote energy efficiency.
Indonesia Gas Sensors Market Opportunities
The potential for growth in the Indonesia gas sensors market is significant, particularly in sectors such as automotive, manufacturing, and healthcare. With governments pushing for stricter emission regulations, industries are compelled to adopt more reliable air quality monitoring solutions. The rise in public health awareness presents unique opportunities for gas sensor manufacturers to innovate and develop tailored solutions that meet specific market needs, including those related to smart cities and urban development.
Government Initiatives in the Indonesia Gas Sensors Market
The Indonesian government is actively implementing policies to improve air quality and public health, which directly supports the growth of the gas sensors market. Initiatives include enhancing regulatory frameworks to enforce stricter emissions standards and promoting public-private partnerships that facilitate technological advancements. Public spending on environmental monitoring and safety programs is also increasing, further incentivizing the development and deployment of gas sensor technologies.
Future Insights of the Indonesia Gas Sensors Market
From 2026 to 2032, the Indonesia gas sensors market is projected to expand significantly, propelled by continuous technological innovations and rising public demand for better air quality management. As industries increasingly adopt gas sensors for compliance and safety purposes, the market will likely see a blend of traditional applications and new smart technologies. This evolution will not only enhance operational efficiency but also contribute to the broader agenda of environmental sustainability.
Indonesia Gas Sensors Market Latest Developments (2025 - 2026)
Recent industry movements indicate a strong shift towards innovative gas sensor technologies. Companies are focusing on developing advanced sensor solutions that can be integrated with artificial intelligence for predictive analytics. Additionally, the adoption of gas sensors in urban planning and infrastructure projects is gaining traction, as municipalities seek to enhance air quality monitoring efforts amid rising pollution levels.
Indonesia Gas Sensors Market - Key Attractiveness of the Report
- 10 Years of Market Numbers
- Historical Data Starting from 2022 to 2025
- Base Year: 2025
- Forecast Data until 2032
- Key Performance Indicators Impacting the Market
- Major Upcoming Developments and Projects
Key Highlights of the Report:
- Indonesia Gas Sensors Market Outlook
- Market Size of Indonesia Gas Sensors Market, 2025
- Forecast of Indonesia Gas Sensors Market, 2032
- Historical Data and Forecast of Indonesia Gas Sensors Revenues & Volume for the Period 2022-2032F
- Indonesia Gas Sensors Market Trend Evolution
- Indonesia Gas Sensors Market Drivers and Challenges
- Indonesia Gas Sensors Price Trends
- Indonesia Gas Sensors Porter's Five Forces
- Indonesia Gas Sensors Industry Life Cycle
- Historical Data and Forecast of Indonesia Gas Sensors Market Revenues & Volume By Product for the Period 2022-2032F
- Historical Data and Forecast of Indonesia Gas Sensors Market Revenues & Volume By Hydrogen for the Period 2022-2032F
- Historical Data and Forecast of Indonesia Gas Sensors Market Revenues & Volume By Ammonia for the Period 2022-2032F
- Historical Data and Forecast of Indonesia Gas Sensors Market Revenues & Volume By Hydrogen Sulfide for the Period 2022-2032F
- Historical Data and Forecast of Indonesia Gas Sensors Market Revenues & Volume By Methyl Mercaptan Sensor for the Period 2022-2032F
- Historical Data and Forecast of Indonesia Gas Sensors Market Revenues & Volume By NOx Sensor for the Period 2022-2032F
- Historical Data and Forecast of Indonesia Gas Sensors Market Revenues & Volume By Carbon Monoxide Sensor for the Period 2022-2032F
- Historical Data and Forecast of Indonesia Gas Sensors Market Revenues & Volume By Carbon Dioxide Sensor for the Period 2022-2032F
- Historical Data and Forecast of Indonesia Hydrogen Gas Sensors Market Revenues & Volume By Oxygen/Lambda Sensor for the Period 2022-2032F
- Historical Data and Forecast of Indonesia Gas Sensors Market Revenues & Volume By Technology for the Period 2022-2032F
- Historical Data and Forecast of Indonesia Gas Sensors Market Revenues & Volume By Infrared for the Period 2022-2032F
- Historical Data and Forecast of Indonesia Gas Sensors Market Revenues & Volume By Catalytic for the Period 2022-2032F
- Historical Data and Forecast of Indonesia Gas Sensors Market Revenues & Volume By Photo-Ionization Detector for the Period 2022-2032F
- Historical Data and Forecast of Indonesia Gas Sensors Market Revenues & Volume By Solid State/MOS for the Period 2022-2032F
- Historical Data and Forecast of Indonesia Gas Sensors Market Revenues & Volume By Semiconductor for the Period 2022-2032F
- Historical Data and Forecast of Indonesia Gas Sensors Market Revenues & Volume By Electrochemical for the Period 2022-2032F
- Indonesia Gas Sensors Import Export Trade Statistics
- Market Opportunity Assessment By Product
- Market Opportunity Assessment By Technology
- Indonesia Gas Sensors Top Companies Market Share
- Indonesia Gas Sensors Competitive Benchmarking By Technical and Operational Parameters
- Indonesia Gas Sensors Company Profiles
- Indonesia Gas Sensors Key Strategic Recommendations
Frequently Asked Questions About the Market Study (FAQs):
The growth is primarily fueled by increased industrial activities, regulatory pressures for emission reductions, and heightened awareness regarding air quality issues, pushing both consumers and industries towards gas sensors.
The market was estimated at USD 468 Million in 2025, with projections indicating growth to USD 618 Million by 2032, representing a CAGR of 4.1% from 2026 to 2032.
Key challenges include the need for continuous technological innovation, maintenance requirements of sensors, and environmental factors that can affect sensor accuracy in diverse applications.
The automotive, manufacturing, and healthcare sectors are leading in the adoption of gas sensors, driven by the need for compliance with safety regulations and enhanced monitoring capabilities.
Government initiatives aimed at improving air quality and public health are leading to stricter emissions regulations and increased funding for environmental monitoring, creating a favorable environment for gas sensor adoption.
6Wresearch actively monitors the Indonesia Gas Sensors Market and publishes its comprehensive annual report, highlighting emerging trends, growth drivers, revenue analysis, and forecast outlook. Our insights help businesses to make data-backed strategic decisions with ongoing market dynamics. Our analysts track relevent industries related to the Indonesia Gas Sensors Market, allowing our clients with actionable intelligence and reliable forecasts tailored to emerging regional needs.
Yes, we provide customisation as per your requirements. To learn more, feel free to contact us on sales@6wresearch.com
1 Executive Summary |
2 Introduction |
2.1 Key Highlights of the Report |
2.2 Report Description |
2.3 Market Scope & Segmentation |
2.4 Research Methodology |
2.5 Assumptions |
3 Indonesia Gas Sensors Market Overview |
3.1 Indonesia Country Macro Economic Indicators |
3.2 Indonesia Gas Sensors Market Revenues & Volume, 2022 & 2032F |
3.3 Indonesia Gas Sensors Market - Industry Life Cycle |
3.4 Indonesia Gas Sensors Market - Porter's Five Forces |
3.5 Indonesia Gas Sensors Market Revenues & Volume Share, By Product, 2022 & 2032F |
3.6 Indonesia Gas Sensors Market Revenues & Volume Share, By Technology, 2022 & 2032F |
4 Indonesia Gas Sensors Market Dynamics |
4.1 Impact Analysis |
4.2 Market Drivers |
4.2.1 Increasing government regulations on industrial safety and environmental monitoring |
4.2.2 Growing adoption of IoT and smart technology in various industries |
4.2.3 Rising awareness about air quality and pollution control measures |
4.3 Market Restraints |
4.3.1 High initial investment and maintenance costs associated with gas sensors |
4.3.2 Lack of skilled professionals to operate and maintain gas sensor systems |
4.3.3 Limited availability of advanced gas sensor technologies in the market |
5 Indonesia Gas Sensors Market Trends |
6 Indonesia Gas Sensors Market, By Types |
6.1 Indonesia Gas Sensors Market, By Product |
6.1.1 Overview and Analysis |
6.1.2 Indonesia Gas Sensors Market Revenues & Volume, By Product, 2022-2032F |
6.1.3 Indonesia Gas Sensors Market Revenues & Volume, By Hydrogen, 2022-2032F |
6.1.4 Indonesia Gas Sensors Market Revenues & Volume, By Ammonia, 2022-2032F |
6.1.5 Indonesia Gas Sensors Market Revenues & Volume, By Hydrogen Sulfide, 2022-2032F |
6.1.6 Indonesia Gas Sensors Market Revenues & Volume, By Methyl Mercaptan Sensor, 2022-2032F |
6.1.7 Indonesia Gas Sensors Market Revenues & Volume, By NOx Sensor, 2022-2032F |
6.1.8 Indonesia Gas Sensors Market Revenues & Volume, By Carbon Monoxide Sensor, 2022-2032F |
6.1.9 Indonesia Gas Sensors Market Revenues & Volume, By Oxygen/Lambda Sensor, 2022-2032F |
6.1.10 Indonesia Gas Sensors Market Revenues & Volume, By Oxygen/Lambda Sensor, 2022-2032F |
6.2 Indonesia Gas Sensors Market, By Technology |
6.2.1 Overview and Analysis |
6.2.2 Indonesia Gas Sensors Market Revenues & Volume, By Infrared, 2022-2032F |
6.2.3 Indonesia Gas Sensors Market Revenues & Volume, By Catalytic, 2022-2032F |
6.2.4 Indonesia Gas Sensors Market Revenues & Volume, By Photo-Ionization Detector, 2022-2032F |
6.2.5 Indonesia Gas Sensors Market Revenues & Volume, By Solid State/MOS, 2022-2032F |
6.2.6 Indonesia Gas Sensors Market Revenues & Volume, By Semiconductor, 2022-2032F |
6.2.7 Indonesia Gas Sensors Market Revenues & Volume, By Electrochemical, 2022-2032F |
7 Indonesia Gas Sensors Market Import-Export Trade Statistics |
7.1 Indonesia Gas Sensors Market Export to Major Countries |
7.2 Indonesia Gas Sensors Market Imports from Major Countries |
8 Indonesia Gas Sensors Market Key Performance Indicators |
8.1 Average response time of gas sensors in detecting hazardous gases |
8.2 Number of industries adopting gas sensor technology for safety and environmental compliance |
8.3 Percentage of improvement in air quality in areas where gas sensor systems are implemented |
9 Indonesia Gas Sensors Market - Opportunity Assessment |
9.1 Indonesia Gas Sensors Market Opportunity Assessment, By Product, 2022 & 2032F |
9.2 Indonesia Gas Sensors Market Opportunity Assessment, By Technology, 2022 & 2032F |
10 Indonesia Gas Sensors Market - Competitive Landscape |
10.1 Indonesia Gas Sensors Market Revenue Share, By Companies, 2025 |
10.2 Indonesia Gas Sensors Market Competitive Benchmarking, By Operating and Technical Parameters |
11 Company Profiles |
12 Recommendations |
13 Disclaimer |
Global Go To Market Strategy - 2030
Export potential enables firms to identify high-growth global markets with greater confidence by combining advanced trade intelligence with a structured quantitative methodology. The framework analyzes emerging demand trends and country-level import patterns while integrating macroeconomic and trade datasets such as GDP and population forecasts, bilateral import–export flows, tariff structures, elasticity differentials between developed and developing economies, geographic distance, and import demand projections. Using weighted trade values from 2020–2024 as the base period to project country-to-country export potential for 2030, these inputs are operationalized through calculated drivers such as gravity model parameters, tariff impact factors, and projected GDP per-capita growth. Through an analysis of hidden potentials, demand hotspots, and market conditions that are most favorable to success, this method enables firms to focus on target countries, maximize returns, and global expansion with data, backed by accuracy.
By factoring in the projected importer demand gap that is currently unmet and could be potential opportunity, it identifies the potential for the Exporter (Country) among 190 countries, against the general trade analysis, which identifies the biggest importer or exporter.
To discover high-growth global markets and optimize your business strategy:
Click Here
Pricing
- Single User License$ 1,995
- Department License$ 2,400
- Site License$ 3,120
- Global License$ 3,795

Leadership Perspectives from Industry Events
Search
Thought Leadership and Analyst Meet


Our Clients
6WResearch In News
- India Air Conditioner Market Set for Strong Rebound in 2026 After Weather-Led Correction and GST-Driven Recovery: 6Wresearch
- ADAS in India: How Automatic Emergency Braking, Blind Spot Detection & Driver Monitoring are Transforming Road Safety
- Doha a strategic location for EV manufacturing hub: IPA Qatar
- Demand for luxury TVs surging in the GCC, says Samsung
- Empowering Growth: The Thriving Journey of Bangladesh’s Cable Industry
- Demand for luxury TVs surging in the GCC, says Samsung
Latest Reports
- Nicaragua RPG Gaming Market (2026-2032)
- New Zealand RPG Gaming Market (2026-2032)
- Netherlands RPG Gaming Market (2026-2032)
- Nauru RPG Gaming Market (2026-2032)
- Namibia RPG Gaming Market (2026-2032)
- Mozambique RPG Gaming Market (2026-2032)
- Montenegro RPG Gaming Market (2026-2032)
- Mongolia RPG Gaming Market (2026-2032)
- Monaco RPG Gaming Market (2026-2032)
- Micronesia RPG Gaming Market (2026-2032)
Industry Events and Analyst Meet

EV India Expo 2026

HIMTEX 2026

India Refining Summit 2026

India EV Show 2026

EV tech India Expo 2026
Whitepaper
- Middle East & Africa Commercial Security Market Click here to view more.
- Middle East & Africa Fire Safety Systems & Equipment Market Click here to view more.
- GCC Drone Market Click here to view more.
- Middle East Lighting Fixture Market Click here to view more.
- GCC Physical & Perimeter Security Market Click here to view more.