Indonesia Glass Curtain Wall Market (2020-2026) | Outlook, Revenue, Analysis, COVID-19 IMPACT, Size, Trends, Forecast, Growth, Companies, Value, Share & Industry
Market Forecast By Types (Unitized, Stick), By Glazing Applications (Interior, Exterior), By Application (Highway and Roadway, Industrial, Airport Perimeters, Parking Lots, Sports Stadiums, Others) And Competitive Landscape
| Product Code: ETC005628 | Publication Date: Jun 2023 | Updated Date: Feb 2026 | Product Type: Report | |
| Publisher: 6Wresearch | Author: Ravi Bhandari | No. of Pages: 70 | No. of Figures: 35 | No. of Tables: 5 |
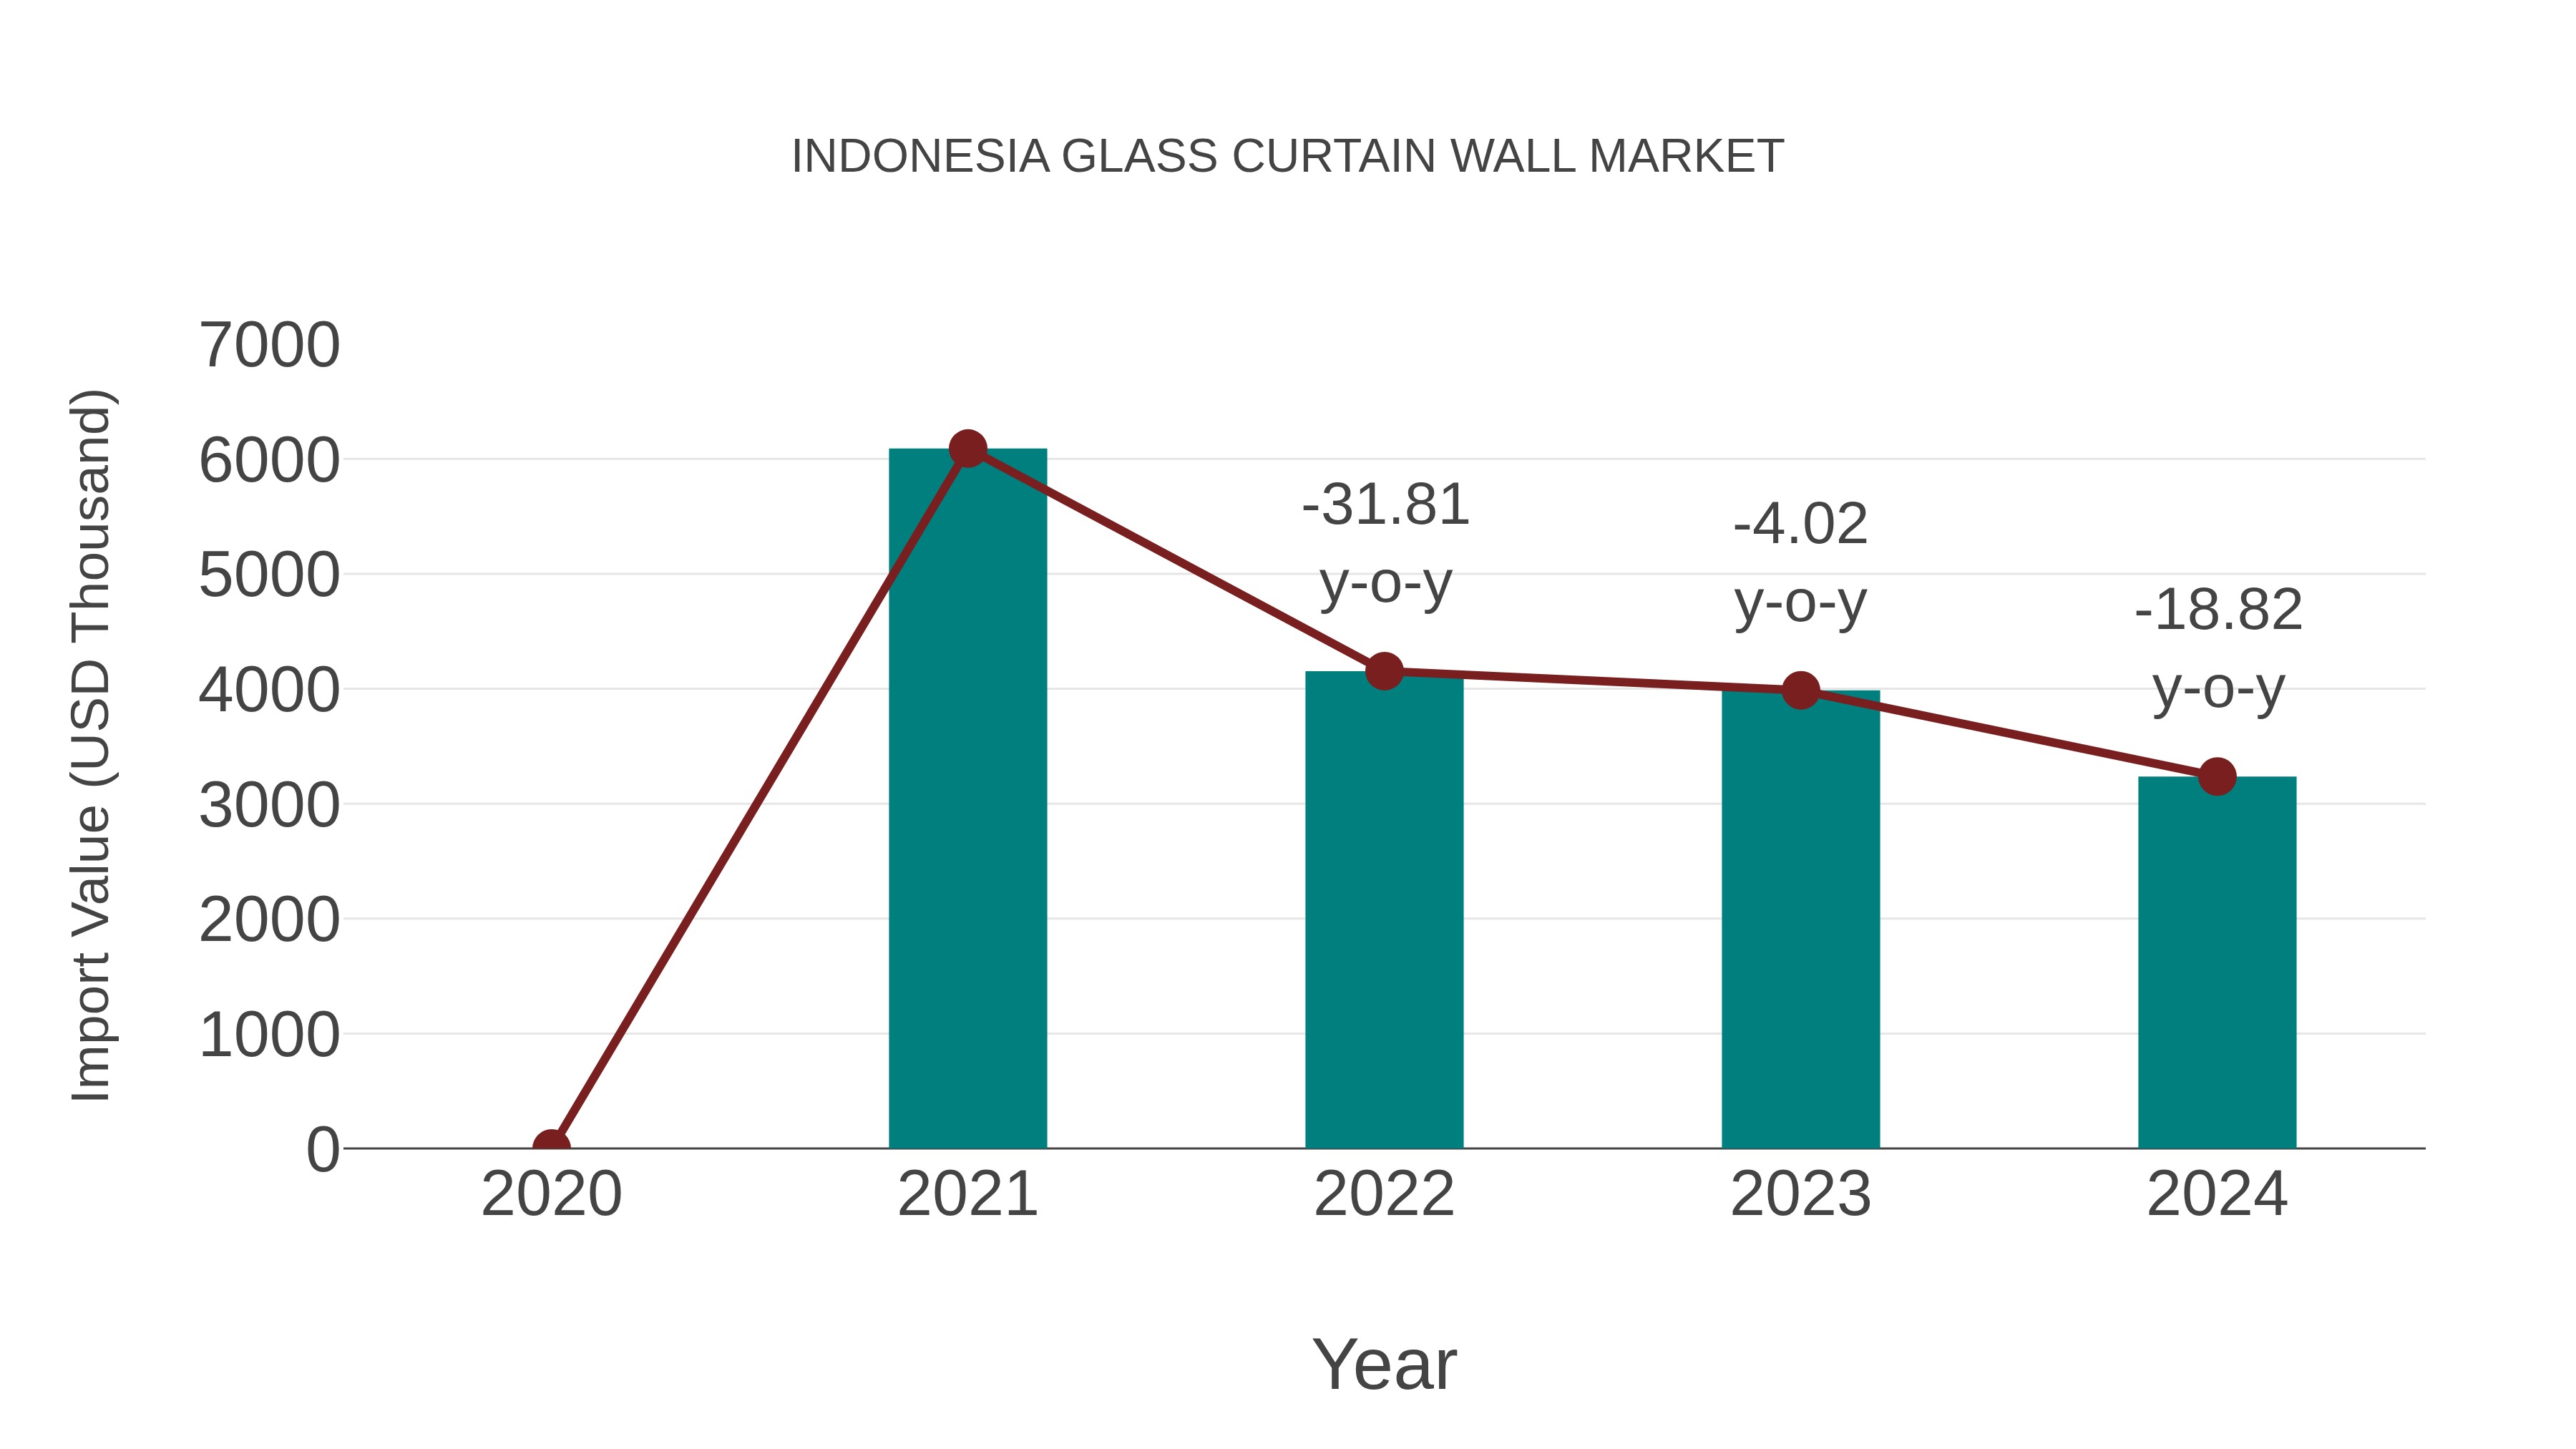
Indonesia Glass Curtain Wall Market: Import Trend Analysis
In the Indonesia glass curtain wall market, the import trend experienced a decline from 2023 to 2024, with a growth rate of -18.82%. The compound annual growth rate (CAGR) for the period 2020-2024 stood at -19.0%. This negative import momentum could be attributed to shifts in demand, possibly influenced by changing market dynamics or trade policies during the period.
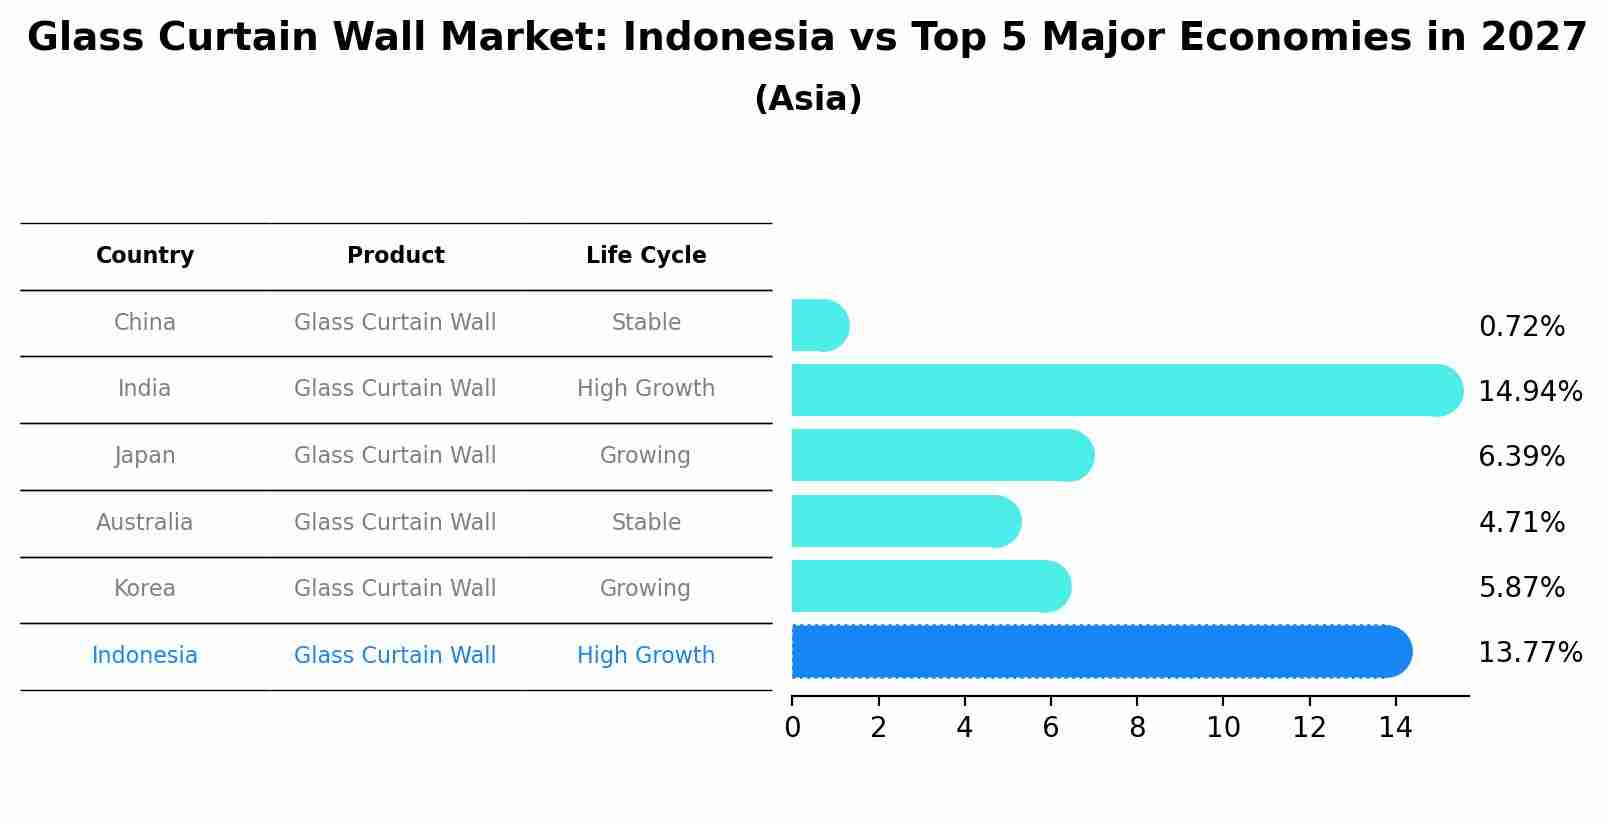
Glass Curtain Wall Market: Indonesia vs Top 5 Major Economies in 2027 (Asia)
The Glass Curtain Wall market in Indonesia is projected to grow at a high growth rate of 13.77% by 2027, highlighting the country's increasing focus on advanced technologies within the Asia region, where China holds the dominant position, followed closely by India, Japan, Australia and South Korea, shaping overall regional demand.
Indonesia Glass Curtain Wall Market Synopsis
The Indonesia glass curtain wall market is expected to register a CAGR of over 5% during 2020-2026. The country has witnessed an increase in the construction activities, which includes commercial, residential, and industrial projects. This is expected to drive the demand for glass curtain walls in Indonesia. A number of foreign investors are also making investments in the real estate sector due to its growing potential and increasing urbanization rate in the country aiding growth of the market. Additionally, with an emergence of high-rise buildings coupled with changing lifestyle preferences among individuals have supplemented the need for superior architectural designs that require use of glass curtains walls across several applications including office spaces, hospitals, retail outlets etc., thus driving further growth opportunities for market players operating in this domain.
Moreover, technological advancements such as implementation of advanced safety features into glass walls along with their aesthetic appeal will create numerous opportunities for industry participants over coming years thereby augmenting overall revenue generated from sales within Indonesia Glass Curtain Wall Market throughout forecast period till 2026.
Key Highlights of the Report:
- Indonesia Glass Curtain Wall Market Outlook
- Market Size of Indonesia Glass Curtain Wall Market, 2019
- Forecast of Indonesia Glass Curtain Wall Market, 2026
- Historical Data and Forecast of Indonesia Glass Curtain Wall Revenues & Volume for the Period 2016 - 2026
- Indonesia Glass Curtain Wall Market Trend Evolution
- Indonesia Glass Curtain Wall Market Drivers and Challenges
- Indonesia Glass Curtain Wall Price Trends
- Indonesia Glass Curtain Wall Porter's Five Forces
- Indonesia Glass Curtain Wall Industry Life Cycle
- Historical Data and Forecast of Indonesia Glass Curtain Wall Market Revenues & Volume By Types for the Period 2016 - 2026
- Historical Data and Forecast of Indonesia Glass Curtain Wall Market Revenues & Volume By Unitized for the Period 2016 - 2026
- Historical Data and Forecast of Indonesia Glass Curtain Wall Market Revenues & Volume By Stick for the Period 2016 - 2026
- Historical Data and Forecast of Indonesia Glass Curtain Wall Market Revenues & Volume By Glazing Applications for the Period 2016 - 2026
- Historical Data and Forecast of Indonesia Glass Curtain Wall Market Revenues & Volume By Interior for the Period 2016 - 2026
- Historical Data and Forecast of Indonesia Glass Curtain Wall Market Revenues & Volume By Exterior for the Period 2016 - 2026
- Historical Data and Forecast of Indonesia Glass Curtain Wall Market Revenues & Volume By Application for the Period 2016 - 2026
- Historical Data and Forecast of Indonesia Glass Curtain Wall Market Revenues & Volume By Highway and Roadway for the Period 2016 - 2026
- Historical Data and Forecast of Indonesia Glass Curtain Wall Market Revenues & Volume By Industrial for the Period 2016 - 2026
- Historical Data and Forecast of Indonesia Glass Curtain Wall Market Revenues & Volume By Airport Perimeters for the Period 2016 - 2026
- Historical Data and Forecast of Indonesia Glass Curtain Wall Market Revenues & Volume By Parking Lots for the Period 2016 - 2026
- Historical Data and Forecast of Indonesia Glass Curtain Wall Market Revenues & Volume By Sports Stadiums for the Period 2016 - 2026
- Historical Data and Forecast of Indonesia Glass Curtain Wall Market Revenues & Volume By Others for the Period 2016 - 2026
- Indonesia Glass Curtain Wall Import Export Trade Statistics
- Market Opportunity Assessment By Types
- Market Opportunity Assessment By Glazing Applications
- Market Opportunity Assessment By Application
- Indonesia Glass Curtain Wall Top Companies Market Share
- Indonesia Glass Curtain Wall Competitive Benchmarking By Technical and Operational Parameters
- Indonesia Glass Curtain Wall Company Profiles
- Indonesia Glass Curtain Wall Key Strategic Recommendations
Frequently Asked Questions About the Market Study (FAQs):
6Wresearch actively monitors the Indonesia Glass Curtain Wall Market and publishes its comprehensive annual report, highlighting emerging trends, growth drivers, revenue analysis, and forecast outlook. Our insights help businesses to make data-backed strategic decisions with ongoing market dynamics. Our analysts track relevent industries related to the Indonesia Glass Curtain Wall Market, allowing our clients with actionable intelligence and reliable forecasts tailored to emerging regional needs.
Yes, we provide customisation as per your requirements. To learn more, feel free to contact us on sales@6wresearch.com
1 Executive Summary |
2 Introduction |
2.1 Key Highlights of the Report |
2.2 Report Description |
2.3 Market Scope & Segmentation |
2.4 Research Methodology |
2.5 Assumptions |
3 Indonesia Glass Curtain Wall Market Overview |
3.1 Indonesia Country Macro Economic Indicators |
3.2 Indonesia Glass Curtain Wall Market Revenues & Volume, 2019 & 2026F |
3.3 Indonesia Glass Curtain Wall Market - Industry Life Cycle |
3.4 Indonesia Glass Curtain Wall Market - Porter's Five Forces |
3.5 Indonesia Glass Curtain Wall Market Revenues & Volume Share, By Types, 2019 & 2026F |
3.6 Indonesia Glass Curtain Wall Market Revenues & Volume Share, By Glazing Applications, 2019 & 2026F |
3.7 Indonesia Glass Curtain Wall Market Revenues & Volume Share, By Application, 2019 & 2026F |
4 Indonesia Glass Curtain Wall Market Dynamics |
4.1 Impact Analysis |
4.2 Market Drivers |
4.2.1 Increasing urbanization and infrastructure development in Indonesia |
4.2.2 Growing demand for energy-efficient and sustainable building solutions |
4.2.3 Rise in construction activities across commercial, residential, and industrial sectors |
4.3 Market Restraints |
4.3.1 Volatile raw material prices affecting production costs |
4.3.2 Lack of skilled labor in the glass curtain wall installation industry |
4.3.3 Stringent regulations and standards for construction projects |
5 Indonesia Glass Curtain Wall Market Trends |
6 Indonesia Glass Curtain Wall Market, By Types |
6.1 Indonesia Glass Curtain Wall Market, By Types |
6.1.1 Overview and Analysis |
6.1.2 Indonesia Glass Curtain Wall Market Revenues & Volume, By Types, 2016 - 2026F |
6.1.3 Indonesia Glass Curtain Wall Market Revenues & Volume, By Unitized, 2016 - 2026F |
6.1.4 Indonesia Glass Curtain Wall Market Revenues & Volume, By Stick, 2016 - 2026F |
6.2 Indonesia Glass Curtain Wall Market, By Glazing Applications |
6.2.1 Overview and Analysis |
6.2.2 Indonesia Glass Curtain Wall Market Revenues & Volume, By Interior, 2016 - 2026F |
6.2.3 Indonesia Glass Curtain Wall Market Revenues & Volume, By Exterior, 2016 - 2026F |
6.3 Indonesia Glass Curtain Wall Market, By Application |
6.3.1 Overview and Analysis |
6.3.2 Indonesia Glass Curtain Wall Market Revenues & Volume, By Highway and Roadway, 2016 - 2026F |
6.3.3 Indonesia Glass Curtain Wall Market Revenues & Volume, By Industrial, 2016 - 2026F |
6.3.4 Indonesia Glass Curtain Wall Market Revenues & Volume, By Airport Perimeters, 2016 - 2026F |
6.3.5 Indonesia Glass Curtain Wall Market Revenues & Volume, By Parking Lots, 2016 - 2026F |
6.3.6 Indonesia Glass Curtain Wall Market Revenues & Volume, By Sports Stadiums, 2016 - 2026F |
6.3.7 Indonesia Glass Curtain Wall Market Revenues & Volume, By Others, 2016 - 2026F |
7 Indonesia Glass Curtain Wall Market Import-Export Trade Statistics |
7.1 Indonesia Glass Curtain Wall Market Export to Major Countries |
7.2 Indonesia Glass Curtain Wall Market Imports from Major Countries |
8 Indonesia Glass Curtain Wall Market Key Performance Indicators |
8.1 Energy efficiency rating of glass curtain wall systems used in projects |
8.2 Number of new construction permits issued in Indonesia |
8.3 Adoption rate of green building certifications in the country |
9 Indonesia Glass Curtain Wall Market - Opportunity Assessment |
9.1 Indonesia Glass Curtain Wall Market Opportunity Assessment, By Types, 2019 & 2026F |
9.2 Indonesia Glass Curtain Wall Market Opportunity Assessment, By Glazing Applications, 2019 & 2026F |
9.3 Indonesia Glass Curtain Wall Market Opportunity Assessment, By Application, 2019 & 2026F |
10 Indonesia Glass Curtain Wall Market - Competitive Landscape |
10.1 Indonesia Glass Curtain Wall Market Revenue Share, By Companies, 2019 |
10.2 Indonesia Glass Curtain Wall Market Competitive Benchmarking, By Operating and Technical Parameters |
11 Company Profiles |
12 Recommendations |
13 Disclaimer |
Global Go To Market Strategy - 2030
Export potential enables firms to identify high-growth global markets with greater confidence by combining advanced trade intelligence with a structured quantitative methodology. The framework analyzes emerging demand trends and country-level import patterns while integrating macroeconomic and trade datasets such as GDP and population forecasts, bilateral import–export flows, tariff structures, elasticity differentials between developed and developing economies, geographic distance, and import demand projections. Using weighted trade values from 2020–2024 as the base period to project country-to-country export potential for 2030, these inputs are operationalized through calculated drivers such as gravity model parameters, tariff impact factors, and projected GDP per-capita growth. Through an analysis of hidden potentials, demand hotspots, and market conditions that are most favorable to success, this method enables firms to focus on target countries, maximize returns, and global expansion with data, backed by accuracy.
By factoring in the projected importer demand gap that is currently unmet and could be potential opportunity, it identifies the potential for the Exporter (Country) among 190 countries, against the general trade analysis, which identifies the biggest importer or exporter.
To discover high-growth global markets and optimize your business strategy:
Click Here
Pricing
- Single User License$ 1,995
- Department License$ 2,400
- Site License$ 3,120
- Global License$ 3,795

Leadership Perspectives from Industry Events
Search
Thought Leadership and Analyst Meet


Our Clients
6WResearch In News
- India Air Conditioner Market Set for Strong Rebound in 2026 After Weather-Led Correction and GST-Driven Recovery: 6Wresearch
- ADAS in India: How Automatic Emergency Braking, Blind Spot Detection & Driver Monitoring are Transforming Road Safety
- Doha a strategic location for EV manufacturing hub: IPA Qatar
- Demand for luxury TVs surging in the GCC, says Samsung
- Empowering Growth: The Thriving Journey of Bangladesh’s Cable Industry
- Demand for luxury TVs surging in the GCC, says Samsung
Latest Reports
- Nicaragua RPG Gaming Market (2026-2032)
- New Zealand RPG Gaming Market (2026-2032)
- Netherlands RPG Gaming Market (2026-2032)
- Nauru RPG Gaming Market (2026-2032)
- Namibia RPG Gaming Market (2026-2032)
- Mozambique RPG Gaming Market (2026-2032)
- Montenegro RPG Gaming Market (2026-2032)
- Mongolia RPG Gaming Market (2026-2032)
- Monaco RPG Gaming Market (2026-2032)
- Micronesia RPG Gaming Market (2026-2032)
Industry Events and Analyst Meet

EV India Expo 2026

HIMTEX 2026

India Refining Summit 2026

India EV Show 2026

EV tech India Expo 2026
Whitepaper
- Middle East & Africa Commercial Security Market Click here to view more.
- Middle East & Africa Fire Safety Systems & Equipment Market Click here to view more.
- GCC Drone Market Click here to view more.
- Middle East Lighting Fixture Market Click here to view more.
- GCC Physical & Perimeter Security Market Click here to view more.