Indonesia Gold Potassium Cyanide Market (2026-2032) Outlook | Companies, Share, Forecast, Value, Growth, Analysis, Industry, Size, Trends, Revenue
Market Forecast By Type (Low Purity, High Purity), By Applications (Electroplating of Metals, Decorative Costume Jewellery, Electronic Devices, Watches, Others) And Competitive Landscape
| Product Code: ETC196180 | Publication Date: Jul 2023 | Updated Date: Jun 2026 | Product Type: Market Research Report | |
| Publisher: 6Wresearch | Author: Ravi Bhandari | No. of Pages: 60 | No. of Figures: 40 | No. of Tables: 7 |
Indonesia Gold Potassium Cyanide Market Size, Share & Growth Rate
The Indonesia Gold Potassium Cyanide Market was estimated at USD 407 Million in 2025 and is projected to reach USD 544 Million by 2032, growing at a CAGR of 4.2% from 2026 to 2032. This robust growth trajectory is primarily driven by an increase in industrial applications of Gold Potassium Cyanide (GPC), particularly in gold refining and electroplating, as businesses seek sustainable alternatives to hazardous chemicals. Additionally, the rising focus on research and development is paving the way for innovations that enhance operational efficiencies, further bolstering market demand.
Indonesia Gold Potassium Cyanide Market Year-wise Growth Rate and Key Drivers
This graph highlights how the Indonesia Gold Potassium Cyanide Market has steadily grown over the years, supported by major growth factors.
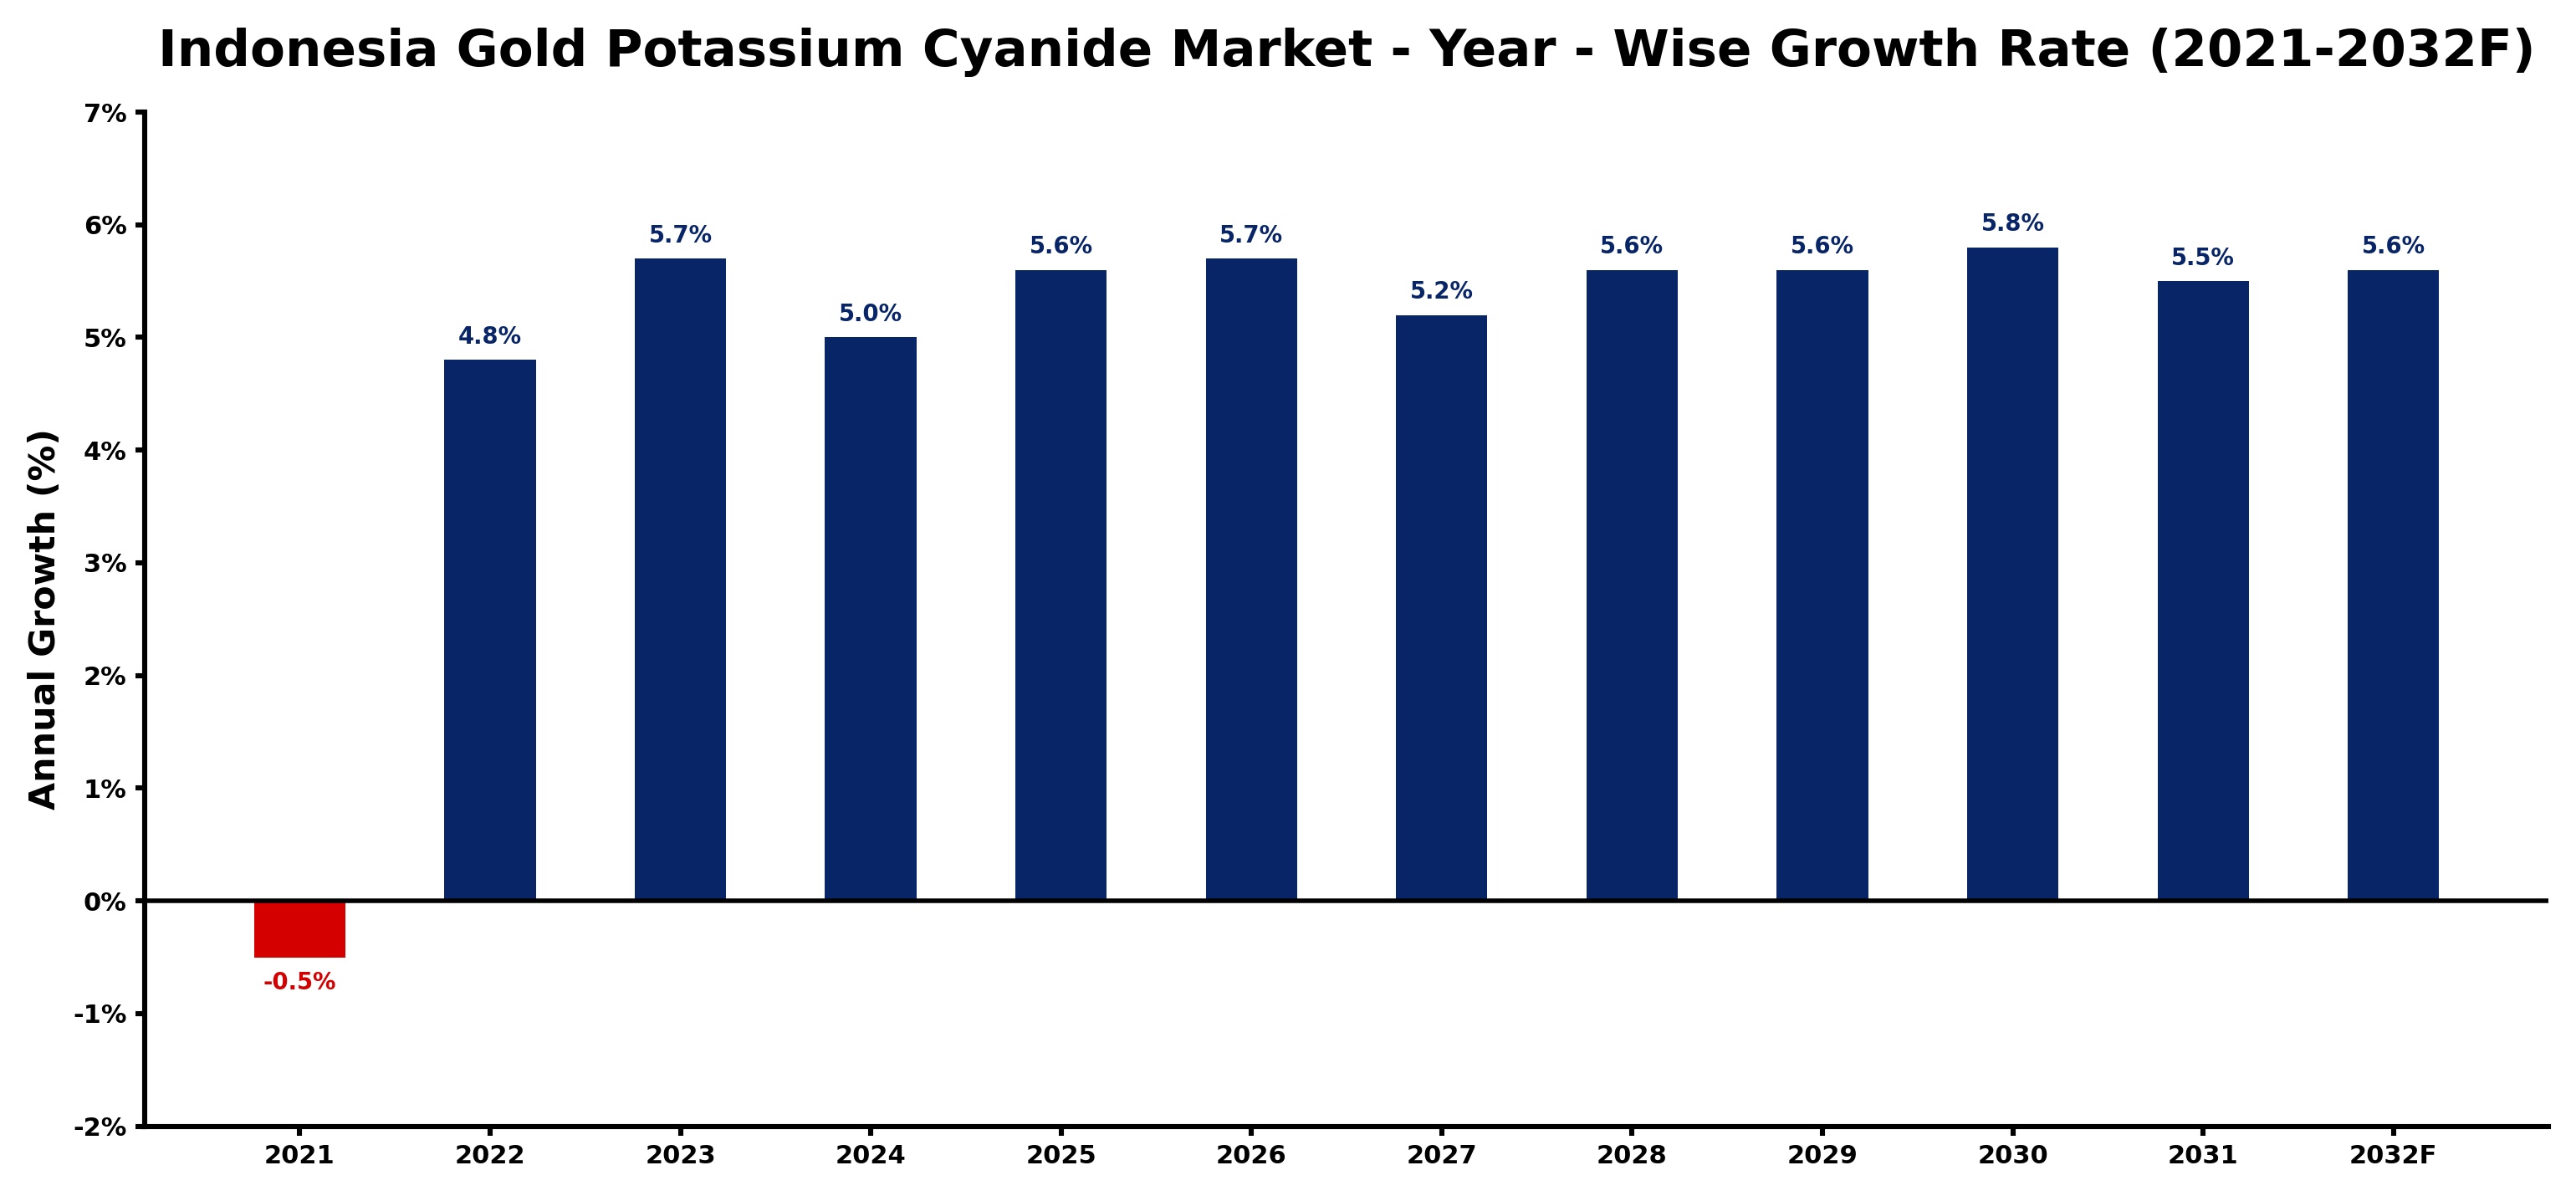
The table below presents the year‑wise growth rates along with the key drivers influencing the market
| Year | Growth Rate | Major Drivers |
| 2021 | -0.5% | Regulatory changes limited production |
| 2022 | 4.8% | Mining sector recovery stimulated demand |
| 2023 | 5.7% | Increased gold prices drove consumption |
| 2024 | 5.0% | Technological advancements enhanced efficiency |
| 2025 | 5.6% | Rising jewelry market fueled growth |
| 2026 | 5.7% | Export opportunities expanded significantly |
| 2027 | 5.2% | Sustainable practices gained market traction |
| 2028 | 5.6% | Investment in mining infrastructure increased |
| 2029 | 5.6% | Consumer awareness of quality improved |
| 2030 | 5.8% | Collaborations with local businesses strengthened |
| 2031 | 5.5% | Market diversification created new opportunities |
| 2032 | 5.6% | Increased environmental regulations encouraged innovation |
Note - Market size estimations and growth projections presented in this report are based on 6Wresearch’s advanced forecasting approach, validated with industry datasets as of June 2026.
Indonesia Gold Potassium Cyanide Market Synopsis
The Indonesian market for Gold Potassium Cyanide is witnessing a noteworthy surge, primarily fueled by its critical role in gold extraction and metal finishing processes. As industries prioritize eco-friendly solutions, GPC’s applications extend beyond traditional sectors, positioning it as a versatile compound within the local economy.
Additionally, its effectiveness as a reagent in analytical chemistry is drawing interest from scientific communities, further diversifying its market presence. The escalating demand for GPC underscores the need for sustainable practices that align with government regulations regarding environmental safety.
Indonesia Gold Potassium Cyanide Market Key Takeaways
- The market is experiencing a significant shift toward eco-friendly alternatives, driven by stringent government regulations.
- GPC serves multiple industrial sectors, enhancing its appeal and versatility in applications such as electroplating and insecticide formulations.
- Innovations in production methods are improving efficiencies and reducing environmental impacts, supporting sustainable practices.
- Investment in research and development by both private and public entities is fostering advancements that could redefine the industry landscape.
- The ongoing economic growth in Indonesia is creating new opportunities for GPC utilization across various sectors.
Evaluation of Restraints in Indonesia Gold Potassium Cyanide Market
Access to raw materials for Gold Potassium Cyanide production poses a significant challenge for the Indonesian market. This bottleneck is compounded by rising environmental concerns related to hazardous byproducts from GPC manufacturing, which has led to stringent regulations on chemical imports and trading. Moreover, high production costs hinder widespread adoption in lower-income segments, while inadequate promotional activities limit market penetration. Together, these factors create barriers that industry stakeholders must navigate to capitalize on growth opportunities.
Indonesia Gold Potassium Cyanide Market Trends
Several emerging trends are shaping the Indonesia Gold Potassium Cyanide Market. A pronounced shift towards sustainable practices has seen industries adopt greener alternatives, leading to increased demand for GPC in sectors like jewelry manufacturing. Moreover, advancements in analytical chemistry are expanding the use of GPC in laboratories, resulting in heightened interest from the scientific community. Additionally, the trend of enhancing production processes through technology is promoting efficiency and eco-friendliness, aligning with the evolving landscape of environmental regulations.
Indonesia Gold Potassium Cyanide Market Opportunities
The Indonesian Gold Potassium Cyanide Market presents several genuine growth and investment opportunities. As the economy expands, there is potential for GPC adoption in food production and processing, which could open new revenue streams. Furthermore, government incentives aimed at promoting eco-friendly materials are likely to encourage manufacturers to invest more heavily in GPC solutions. R&D initiatives can unlock innovative applications and processing techniques, providing a competitive edge for businesses willing to embrace change.
Government Initiatives in the Indonesia Gold Potassium Cyanide Market
The Indonesian government is actively promoting initiatives that encourage the use of environmentally friendly materials across various industries, including those that utilize Gold Potassium Cyanide. Policies aimed at reducing environmental impact have led to increased funding for research and innovation, which helps businesses adopt sustainable practices. Additionally, public spending on green technology initiatives and incentives for companies investing in cleaner production methods are shaping a favorable regulatory environment for GPC applications.
Future Insights of the Indonesia Gold Potassium Cyanide Market
Looking ahead to 2026-2032, the Indonesia Gold Potassium Cyanide Market is poised for a transformative period marked by technological advancements and increasing demand for sustainable practices. As industries continue to prioritize eco-friendly solutions, GPC's role is likely to expand across diverse applications. The combination of economic growth, regulatory support, and innovation will undoubtedly create a favorable landscape, propelling the market toward its projected growth trajectory.
Indonesia Gold Potassium Cyanide Market Latest Developments (May 2025 - June 2026)
The market landscape for Gold Potassium Cyanide in Indonesia is evolving with increased collaborations among key stakeholders aiming to enhance production efficiency and reduce environmental impact. Recent initiatives focus on integrating advanced technologies into manufacturing processes, allowing for more sustainable practices. Additionally, there are emerging partnerships that seek to expand the application of GPC across new industries, signaling a dynamic shift within the market landscape.
Indonesia Gold Potassium Cyanide Market - Key Attractiveness of the Report
- 10 Years of Market Numbers
- Historical Data Starting from 2022 to 2025
- Base Year: 2025
- Forecast Data until 2032
- Key Performance Indicators Impacting the Market
- Major Upcoming Developments and Projects
Key Highlights of the Report:
- Indonesia Gold Potassium Cyanide Market Outlook
- Market Size of Indonesia Gold Potassium Cyanide Market, 2025
- Forecast of Indonesia Gold Potassium Cyanide Market, 2032
- Historical Data and Forecast of Indonesia Gold Potassium Cyanide Revenues & Volume for the Period 2022-2032F
- Indonesia Gold Potassium Cyanide Market Trend Evolution
- Indonesia Gold Potassium Cyanide Market Drivers and Challenges
- Indonesia Gold Potassium Cyanide Price Trends
- Indonesia Gold Potassium Cyanide Porter's Five Forces
- Indonesia Gold Potassium Cyanide Industry Life Cycle
- Historical Data and Forecast of Indonesia Gold Potassium Cyanide Market Revenues & Volume By Type for the Period 2022-2032F
- Historical Data and Forecast of Indonesia Gold Potassium Cyanide Market Revenues & Volume By Low Purity for the Period 2022-2032F
- Historical Data and Forecast of Indonesia Gold Potassium Cyanide Market Revenues & Volume By High Purity for the Period 2022-2032F
- Historical Data and Forecast of Indonesia Gold Potassium Cyanide Market Revenues & Volume By Applications for the Period 2022-2032F
- Historical Data and Forecast of Indonesia Gold Potassium Cyanide Market Revenues & Volume By Electroplating of Metals for the Period 2022-2032F
- Historical Data and Forecast of Indonesia Gold Potassium Cyanide Market Revenues & Volume By Decorative Costume Jewellery for the Period 2022-2032F
- Historical Data and Forecast of Indonesia Gold Potassium Cyanide Market Revenues & Volume By Electronic Devices for the Period 2022-2032F
- Historical Data and Forecast of Indonesia Gold Potassium Cyanide Market Revenues & Volume By Watches for the Period 2022-2032F
- Historical Data and Forecast of Indonesia Gold Potassium Cyanide Market Revenues & Volume By Others for the Period 2022-2032F
- Indonesia Gold Potassium Cyanide Import Export Trade Statistics
- Market Opportunity Assessment By Type
- Market Opportunity Assessment By Applications
- Indonesia Gold Potassium Cyanide Top Companies Market Share
- Indonesia Gold Potassium Cyanide Competitive Benchmarking By Technical and Operational Parameters
- Indonesia Gold Potassium Cyanide Company Profiles
- Indonesia Gold Potassium Cyanide Key Strategic Recommendations
Indonesia Gold Potassium Cyanide Market - Frequently Asked Questions
The market was estimated at USD 407 Million in 2025 and is projected to grow to USD 544 Million by 2032, reflecting a CAGR of 4.2% from 2026 to 2032.
Gold refining and electroplating are the leading applications, supported by growing interest in its use as a reagent in analytical chemistry and an effective insecticide in agriculture.
Government initiatives are encouraging the adoption of eco-friendly materials and sustainable practices, providing incentives that boost the market's growth potential.
Access to raw materials and rising environmental concerns about hazardous byproducts present significant challenges for the market.
There is a notable trend toward sustainability, with industries increasingly adopting greener alternatives to GPC, alongside ongoing technological advancements that improve production methods.
6Wresearch actively monitors the Indonesia Gold Potassium Cyanide Market and publishes its comprehensive annual report, highlighting emerging trends, growth drivers, revenue analysis, and forecast outlook. Our insights help businesses to make data-backed strategic decisions with ongoing market dynamics. Our analysts track relevent industries related to the Indonesia Gold Potassium Cyanide Market, allowing our clients with actionable intelligence and reliable forecasts tailored to emerging regional needs.
Yes, we provide customisation as per your requirements. To learn more, feel free to contact us on sales@6wresearch.com
1 Executive Summary |
2 Introduction |
2.1 Key Highlights of the Report |
2.2 Report Description |
2.3 Market Scope & Segmentation |
2.4 Research Methodology |
2.5 Assumptions |
3 Indonesia Gold Potassium Cyanide Market Overview |
3.1 Indonesia Country Macro Economic Indicators |
3.2 Indonesia Gold Potassium Cyanide Market Revenues & Volume, 2022 & 2032F |
3.3 Indonesia Gold Potassium Cyanide Market - Industry Life Cycle |
3.4 Indonesia Gold Potassium Cyanide Market - Porter's Five Forces |
3.5 Indonesia Gold Potassium Cyanide Market Revenues & Volume Share, By Type, 2022 & 2032F |
3.6 Indonesia Gold Potassium Cyanide Market Revenues & Volume Share, By Applications, 2022 & 2032F |
4 Indonesia Gold Potassium Cyanide Market Dynamics |
4.1 Impact Analysis |
4.2 Market Drivers |
4.2.1 Growing demand for gold potassium cyanide in jewelry making industry |
4.2.2 Increasing adoption of gold potassium cyanide in electroplating applications |
4.2.3 Rise in gold mining activities in Indonesia |
4.3 Market Restraints |
4.3.1 Stringent regulations and environmental concerns related to the use of cyanide compounds |
4.3.2 Fluctuating gold prices impacting the affordability of gold potassium cyanide |
5 Indonesia Gold Potassium Cyanide Market Trends |
6 Indonesia Gold Potassium Cyanide Market, By Types |
6.1 Indonesia Gold Potassium Cyanide Market, By Type |
6.1.1 Overview and Analysis |
6.1.2 Indonesia Gold Potassium Cyanide Market Revenues & Volume, By Type, 2022-2032F |
6.1.3 Indonesia Gold Potassium Cyanide Market Revenues & Volume, By Low Purity, 2022-2032F |
6.1.4 Indonesia Gold Potassium Cyanide Market Revenues & Volume, By High Purity, 2022-2032F |
6.2 Indonesia Gold Potassium Cyanide Market, By Applications |
6.2.1 Overview and Analysis |
6.2.2 Indonesia Gold Potassium Cyanide Market Revenues & Volume, By Electroplating of Metals, 2022-2032F |
6.2.3 Indonesia Gold Potassium Cyanide Market Revenues & Volume, By Decorative Costume Jewellery, 2022-2032F |
6.2.4 Indonesia Gold Potassium Cyanide Market Revenues & Volume, By Electronic Devices, 2022-2032F |
6.2.5 Indonesia Gold Potassium Cyanide Market Revenues & Volume, By Watches, 2022-2032F |
6.2.6 Indonesia Gold Potassium Cyanide Market Revenues & Volume, By Others, 2022-2032F |
7 Indonesia Gold Potassium Cyanide Market Import-Export Trade Statistics |
7.1 Indonesia Gold Potassium Cyanide Market Export to Major Countries |
7.2 Indonesia Gold Potassium Cyanide Market Imports from Major Countries |
8 Indonesia Gold Potassium Cyanide Market Key Performance Indicators |
8.1 Average gold potassium cyanide consumption per jewelry manufacturer |
8.2 Number of new applications for gold potassium cyanide in different industries |
8.3 Percentage of gold mining companies in Indonesia using gold potassium cyanide for extraction |
9 Indonesia Gold Potassium Cyanide Market - Opportunity Assessment |
9.1 Indonesia Gold Potassium Cyanide Market Opportunity Assessment, By Type, 2022 & 2032F |
9.2 Indonesia Gold Potassium Cyanide Market Opportunity Assessment, By Applications, 2022 & 2032F |
10 Indonesia Gold Potassium Cyanide Market - Competitive Landscape |
10.1 Indonesia Gold Potassium Cyanide Market Revenue Share, By Companies, 2025 |
10.2 Indonesia Gold Potassium Cyanide Market Competitive Benchmarking, By Operating and Technical Parameters |
11 Company Profiles |
12 Recommendations |
13 Disclaimer |
Global Go To Market Strategy - 2030
Export potential enables firms to identify high-growth global markets with greater confidence by combining advanced trade intelligence with a structured quantitative methodology. The framework analyzes emerging demand trends and country-level import patterns while integrating macroeconomic and trade datasets such as GDP and population forecasts, bilateral import–export flows, tariff structures, elasticity differentials between developed and developing economies, geographic distance, and import demand projections. Using weighted trade values from 2020–2024 as the base period to project country-to-country export potential for 2030, these inputs are operationalized through calculated drivers such as gravity model parameters, tariff impact factors, and projected GDP per-capita growth. Through an analysis of hidden potentials, demand hotspots, and market conditions that are most favorable to success, this method enables firms to focus on target countries, maximize returns, and global expansion with data, backed by accuracy.
By factoring in the projected importer demand gap that is currently unmet and could be potential opportunity, it identifies the potential for the Exporter (Country) among 190 countries, against the general trade analysis, which identifies the biggest importer or exporter.
To discover high-growth global markets and optimize your business strategy:
Click Here
Pricing
- Single User License$ 1,995
- Department License$ 2,400
- Site License$ 3,120
- Global License$ 3,795

Leadership Perspectives from Industry Events
Search
Thought Leadership and Analyst Meet


Our Clients
6WResearch In News
- India Air Conditioner Market Set for Strong Rebound in 2026 After Weather-Led Correction and GST-Driven Recovery: 6Wresearch
- ADAS in India: How Automatic Emergency Braking, Blind Spot Detection & Driver Monitoring are Transforming Road Safety
- Doha a strategic location for EV manufacturing hub: IPA Qatar
- Demand for luxury TVs surging in the GCC, says Samsung
- Empowering Growth: The Thriving Journey of Bangladesh’s Cable Industry
- Demand for luxury TVs surging in the GCC, says Samsung
Latest Reports
- Nicaragua RPG Gaming Market (2026-2032)
- New Zealand RPG Gaming Market (2026-2032)
- Netherlands RPG Gaming Market (2026-2032)
- Nauru RPG Gaming Market (2026-2032)
- Namibia RPG Gaming Market (2026-2032)
- Mozambique RPG Gaming Market (2026-2032)
- Montenegro RPG Gaming Market (2026-2032)
- Mongolia RPG Gaming Market (2026-2032)
- Monaco RPG Gaming Market (2026-2032)
- Micronesia RPG Gaming Market (2026-2032)
Industry Events and Analyst Meet

EV India Expo 2026

HIMTEX 2026

India Refining Summit 2026

India EV Show 2026

EV tech India Expo 2026
Whitepaper
- Middle East & Africa Commercial Security Market Click here to view more.
- Middle East & Africa Fire Safety Systems & Equipment Market Click here to view more.
- GCC Drone Market Click here to view more.
- Middle East Lighting Fixture Market Click here to view more.
- GCC Physical & Perimeter Security Market Click here to view more.