Indonesia Hollow Glass Microspheres Market (2025-2031) Outlook | Forecast, Share, Analysis, Size, Companies, Growth, Industry, Revenue, Trends & Value
Market Forecast By Type (Glass, Others), By Application (Automotive, Aerospace & Defense, Building & Construction, Paints & Coatings, Electrical & Electronics, Cosmetics & Personal Care, Healthcare) And Competitive Landscape
| Product Code: ETC214720 | Publication Date: Aug 2023 | Updated Date: Aug 2025 | Product Type: Market Research Report | |
| Publisher: 6Wresearch | Author: Ravi Bhandari | No. of Pages: 60 | No. of Figures: 40 | No. of Tables: 7 |
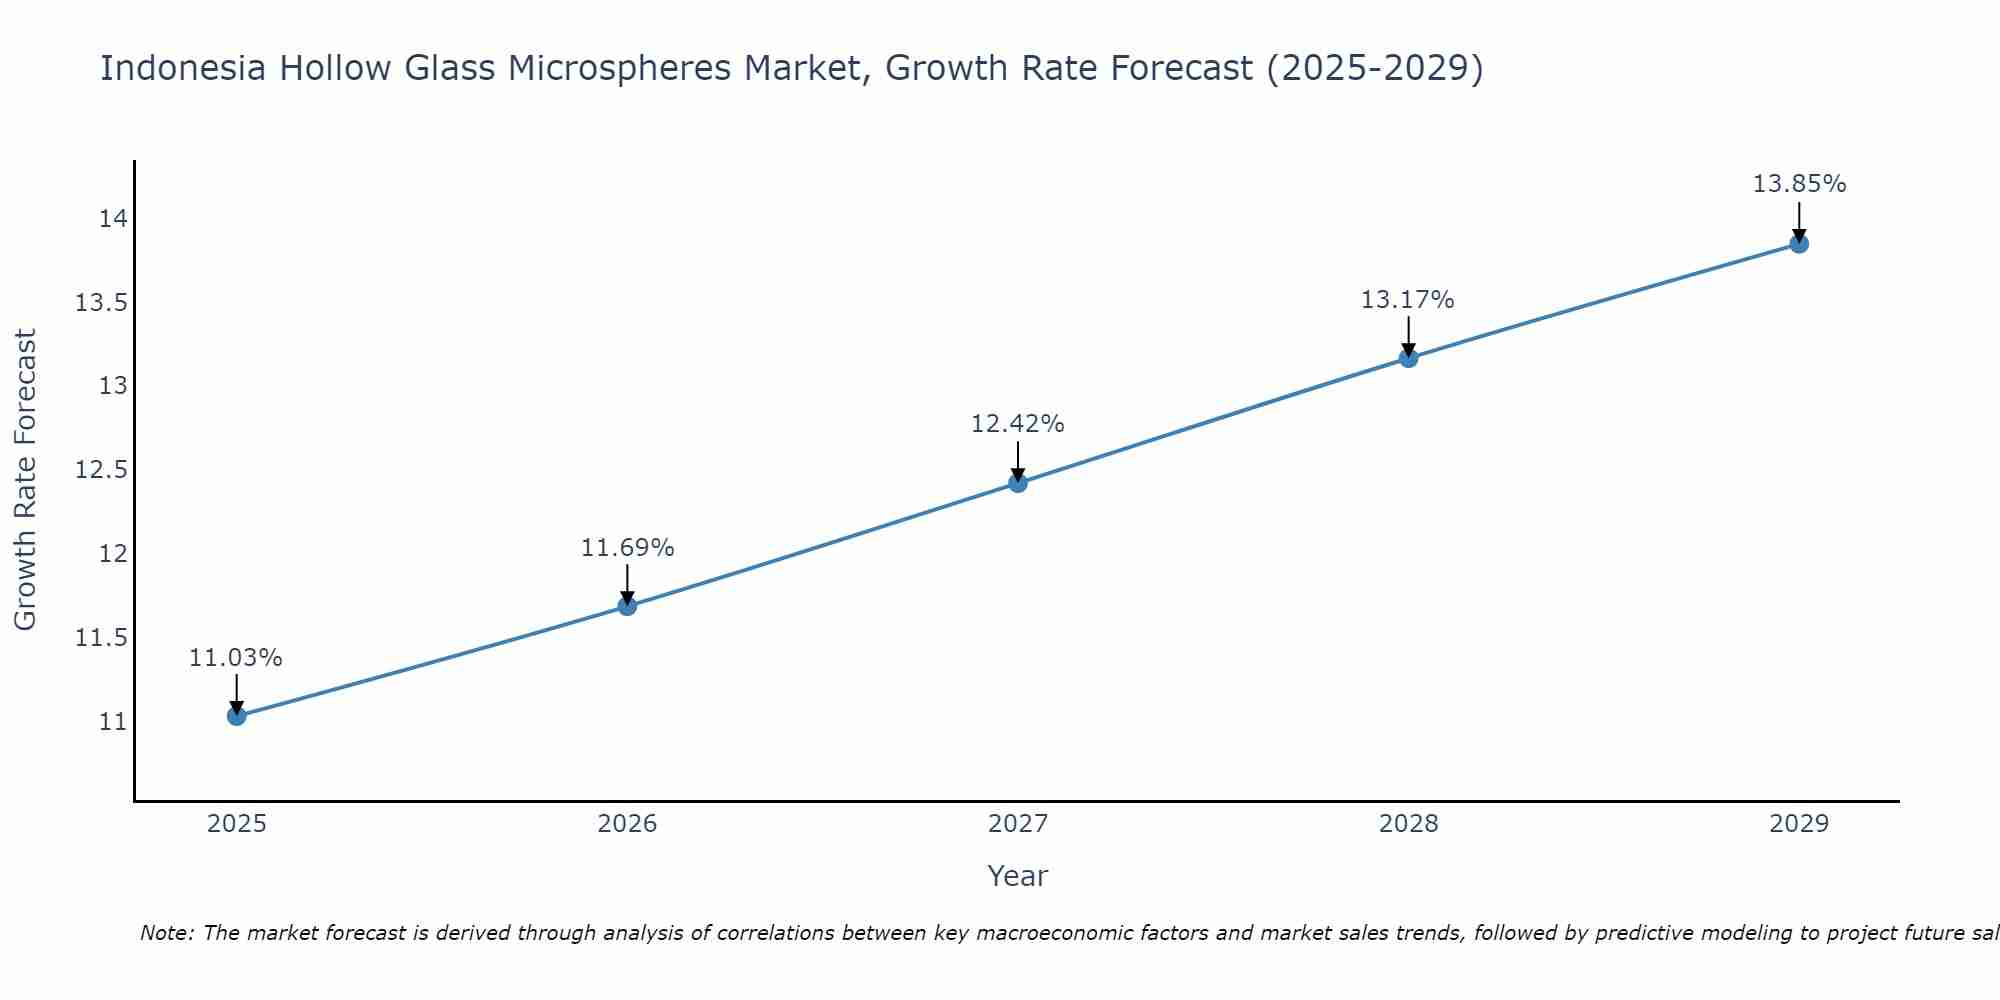
Indonesia Hollow Glass Microspheres Market Size Growth Rate
The Indonesia Hollow Glass Microspheres Market is likely to experience consistent growth rate gains over the period 2025 to 2029. From 11.03% in 2025, the growth rate steadily ascends to 13.85% in 2029.
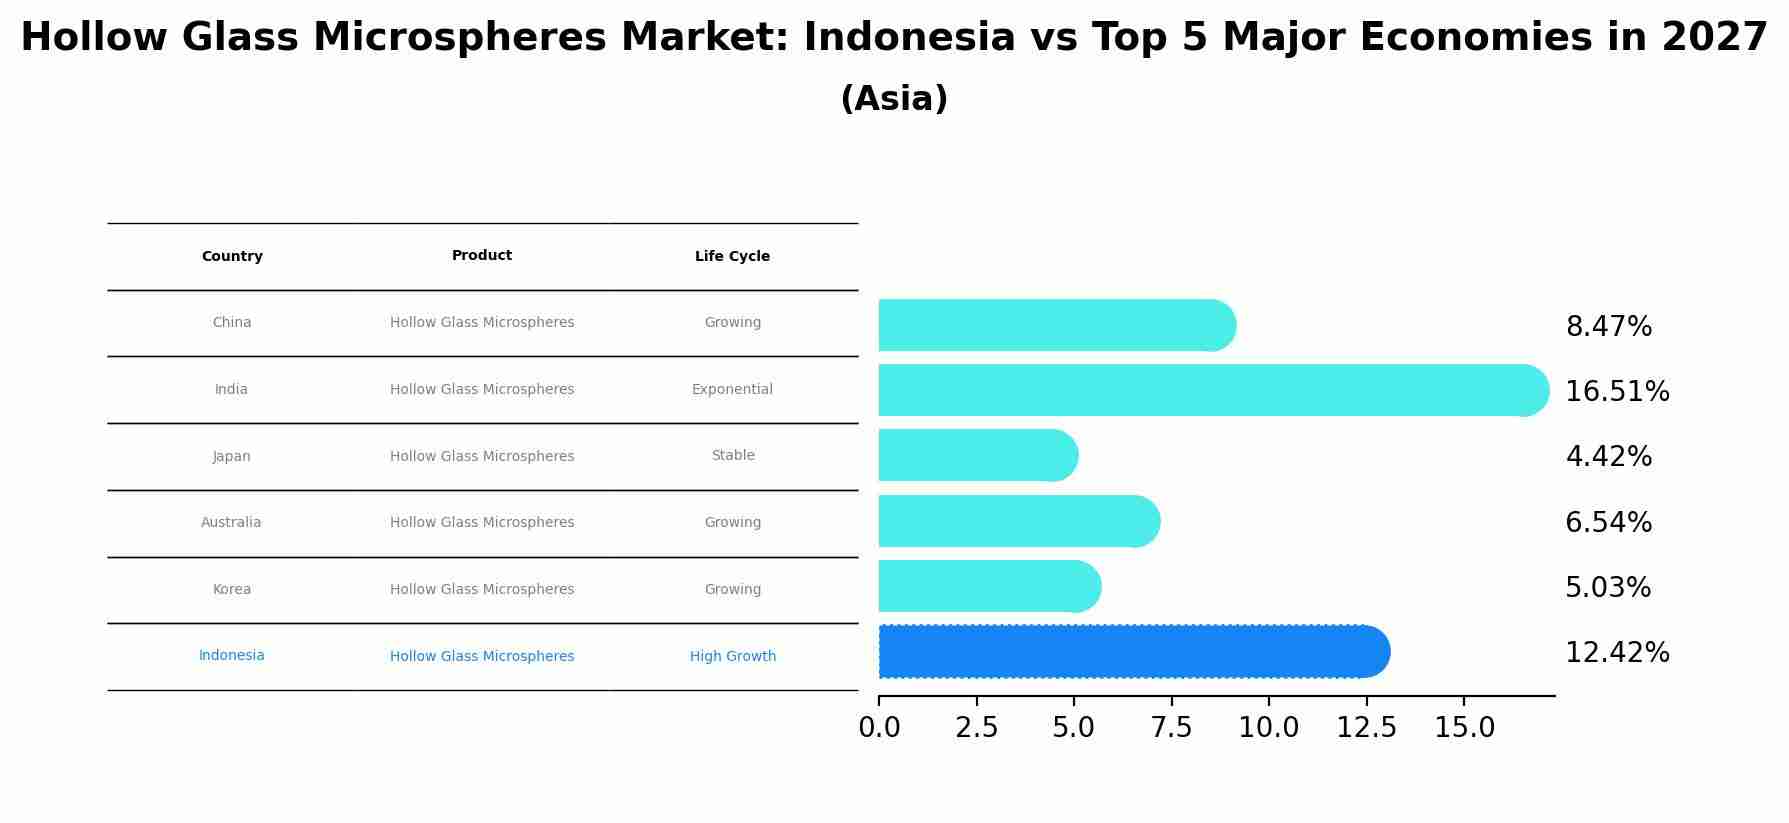
Hollow Glass Microspheres Market: Indonesia vs Top 5 Major Economies in 2027 (Asia)
In the Asia region, the Hollow Glass Microspheres market in Indonesia is projected to expand at a high growth rate of 12.42% by 2027. The largest economy is China, followed by India, Japan, Australia and South Korea.
Indonesia Hollow Glass Microspheres Market Synopsis
The Indonesia hollow glass microspheres market is poised for substantial growth in the coming years. These lightweight and high-strength microspheres find widespread applications across various industries, including construction, automotive, aerospace, and more. The growing demand for advanced materials and the increasing emphasis on lightweight components in manufacturing processes are key factors driving the market`s expansion. Additionally, the escalating need for energy-efficient solutions in the building and construction sector is further fueling the demand for hollow glass microspheres. As the country focuses on sustainable development and eco-friendly practices, these microspheres are expected to play a pivotal role in meeting these objectives. Leading manufacturers in Indonesia are anticipated to invest in research and development to produce innovative products, ensuring a competitive landscape in the market.
Drivers of the Market
The Indonesia Hollow Glass Microspheres market is anticipated to experience significant growth in the coming years. The main drivers behind this growth are the increasing demand from industries such as automotive, construction, and aerospace. Hollow Glass Microspheres are lightweight and have excellent insulation properties, making them ideal for use in various applications. In the automotive sector, these microspheres are utilized to reduce the overall weight of vehicles, thereby enhancing fuel efficiency and reducing emissions. Similarly, in the construction industry, they are used to improve the thermal properties of building materials, leading to energy-efficient structures. The aerospace industry also employs Hollow Glass Microspheres in the manufacturing of lightweight components, which contribute to improved aircraft performance and reduced fuel consumption.
Challenges of the Market
The hollow glass microspheres market in Indonesia faces several challenges that could hinder its growth. One of the significant challenges is the limited awareness and understanding of these microspheres` benefits among end-users and manufacturers. The technology and applications of hollow glass microspheres may not be widely known, leading to reluctance in their adoption. Moreover, the availability of alternative lightweight fillers and additives in the market poses a competitive challenge. Manufacturers may opt for other materials that are more familiar or readily available, rather than investing in hollow glass microspheres. Additionally, the cost of production and procurement of high-quality hollow glass microspheres can be relatively high. This cost factor might deter potential users from incorporating these microspheres into their products, especially when cost-effectiveness is a crucial consideration.
COVID-19 Impact on the Market
The Indonesia Hollow Glass Microspheres market experienced significant challenges due to the COVID-19 pandemic. The outbreak led to disruptions in the supply chain, as well as a decline in demand from various end-user industries. The government-imposed restrictions and lockdown measures hampered production and transportation activities, affecting the overall market growth. However, despite the short-term setback, the market is expected to rebound as the economy recovers from the pandemic. Hollow glass microspheres are widely used in various sectors, including automotive, construction, aerospace, and oil and gas industries, among others. As industrial activities resume and infrastructure projects gain momentum, the demand for hollow glass microspheres is likely to witness a gradual increase.
Key Highlights of the Report:
- Indonesia Hollow Glass Microspheres Market Outlook
- Market Size of Indonesia Hollow Glass Microspheres Market, 2024
- Forecast of Indonesia Hollow Glass Microspheres Market, 2031
- Historical Data and Forecast of Indonesia Hollow Glass Microspheres Revenues & Volume for the Period 2021-2031
- Indonesia Hollow Glass Microspheres Market Trend Evolution
- Indonesia Hollow Glass Microspheres Market Drivers and Challenges
- Indonesia Hollow Glass Microspheres Price Trends
- Indonesia Hollow Glass Microspheres Porter's Five Forces
- Indonesia Hollow Glass Microspheres Industry Life Cycle
- Historical Data and Forecast of Indonesia Hollow Glass Microspheres Market Revenues & Volume By Type for the Period 2021-2031
- Historical Data and Forecast of Indonesia Hollow Glass Microspheres Market Revenues & Volume By Glass for the Period 2021-2031
- Historical Data and Forecast of Indonesia Hollow Glass Microspheres Market Revenues & Volume By Others for the Period 2021-2031
- Historical Data and Forecast of Indonesia Hollow Glass Microspheres Market Revenues & Volume By Application for the Period 2021-2031
- Historical Data and Forecast of Indonesia Hollow Glass Microspheres Market Revenues & Volume By Automotive for the Period 2021-2031
- Historical Data and Forecast of Indonesia Hollow Glass Microspheres Market Revenues & Volume By Aerospace & Defense for the Period 2021-2031
- Historical Data and Forecast of Indonesia Hollow Glass Microspheres Market Revenues & Volume By Building & Construction for the Period 2021-2031
- Historical Data and Forecast of Indonesia Hollow Glass Microspheres Market Revenues & Volume By Paints & Coatings for the Period 2021-2031
- Historical Data and Forecast of Indonesia Hollow Glass Microspheres Market Revenues & Volume By Electrical & Electronics for the Period 2021-2031
- Historical Data and Forecast of Indonesia Hollow Glass Microspheres Market Revenues & Volume By Cosmetics & Personal Care for the Period 2021-2031
- Historical Data and Forecast of Indonesia Hollow Glass Microspheres Market Revenues & Volume By Healthcare for the Period 2021-2031
- Indonesia Hollow Glass Microspheres Import Export Trade Statistics
- Market Opportunity Assessment By Type
- Market Opportunity Assessment By Application
- Indonesia Hollow Glass Microspheres Top Companies Market Share
- Indonesia Hollow Glass Microspheres Competitive Benchmarking By Technical and Operational Parameters
- Indonesia Hollow Glass Microspheres Company Profiles
- Indonesia Hollow Glass Microspheres Key Strategic Recommendations
Frequently Asked Questions About the Market Study (FAQs):
6Wresearch actively monitors the Indonesia Hollow Glass Microspheres Market and publishes its comprehensive annual report, highlighting emerging trends, growth drivers, revenue analysis, and forecast outlook. Our insights help businesses to make data-backed strategic decisions with ongoing market dynamics. Our analysts track relevent industries related to the Indonesia Hollow Glass Microspheres Market, allowing our clients with actionable intelligence and reliable forecasts tailored to emerging regional needs.
Yes, we provide customisation as per your requirements. To learn more, feel free to contact us on sales@6wresearch.com
1 Executive Summary |
2 Introduction |
2.1 Key Highlights of the Report |
2.2 Report Description |
2.3 Market Scope & Segmentation |
2.4 Research Methodology |
2.5 Assumptions |
3 Indonesia Hollow Glass Microspheres Market Overview |
3.1 Indonesia Country Macro Economic Indicators |
3.2 Indonesia Hollow Glass Microspheres Market Revenues & Volume, 2021 & 2031F |
3.3 Indonesia Hollow Glass Microspheres Market - Industry Life Cycle |
3.4 Indonesia Hollow Glass Microspheres Market - Porter's Five Forces |
3.5 Indonesia Hollow Glass Microspheres Market Revenues & Volume Share, By Type, 2021 & 2031F |
3.6 Indonesia Hollow Glass Microspheres Market Revenues & Volume Share, By Application, 2021 & 2031F |
4 Indonesia Hollow Glass Microspheres Market Dynamics |
4.1 Impact Analysis |
4.2 Market Drivers |
4.2.1 Increasing demand for lightweight materials in various industries such as automotive, construction, and aerospace. |
4.2.2 Growing focus on energy efficiency and sustainability, driving the adoption of hollow glass microspheres as a lightweight filler material. |
4.2.3 Technological advancements leading to the development of high-performance hollow glass microspheres with enhanced properties. |
4.3 Market Restraints |
4.3.1 High manufacturing costs associated with producing hollow glass microspheres, impacting their widespread adoption. |
4.3.2 Lack of awareness and limited availability of skilled workforce for handling and incorporating hollow glass microspheres in different applications. |
5 Indonesia Hollow Glass Microspheres Market Trends |
6 Indonesia Hollow Glass Microspheres Market, By Types |
6.1 Indonesia Hollow Glass Microspheres Market, By Type |
6.1.1 Overview and Analysis |
6.1.2 Indonesia Hollow Glass Microspheres Market Revenues & Volume, By Type, 2021-2031F |
6.1.3 Indonesia Hollow Glass Microspheres Market Revenues & Volume, By Glass, 2021-2031F |
6.1.4 Indonesia Hollow Glass Microspheres Market Revenues & Volume, By Others, 2021-2031F |
6.2 Indonesia Hollow Glass Microspheres Market, By Application |
6.2.1 Overview and Analysis |
6.2.2 Indonesia Hollow Glass Microspheres Market Revenues & Volume, By Automotive, 2021-2031F |
6.2.3 Indonesia Hollow Glass Microspheres Market Revenues & Volume, By Aerospace & Defense, 2021-2031F |
6.2.4 Indonesia Hollow Glass Microspheres Market Revenues & Volume, By Building & Construction, 2021-2031F |
6.2.5 Indonesia Hollow Glass Microspheres Market Revenues & Volume, By Paints & Coatings, 2021-2031F |
6.2.6 Indonesia Hollow Glass Microspheres Market Revenues & Volume, By Electrical & Electronics, 2021-2031F |
6.2.7 Indonesia Hollow Glass Microspheres Market Revenues & Volume, By Cosmetics & Personal Care, 2021-2031F |
7 Indonesia Hollow Glass Microspheres Market Import-Export Trade Statistics |
7.1 Indonesia Hollow Glass Microspheres Market Export to Major Countries |
7.2 Indonesia Hollow Glass Microspheres Market Imports from Major Countries |
8 Indonesia Hollow Glass Microspheres Market Key Performance Indicators |
8.1 Research and development investment in innovative hollow glass microspheres technologies. |
8.2 Number of patents filed for hollow glass microspheres production methods and applications. |
8.3 Adoption rate of hollow glass microspheres in new industries or applications. |
8.4 Environmental impact assessment of using hollow glass microspheres in place of conventional materials. |
8.5 Number of collaborations or partnerships between hollow glass microspheres manufacturers and end-user industries for product development. |
9 Indonesia Hollow Glass Microspheres Market - Opportunity Assessment |
9.1 Indonesia Hollow Glass Microspheres Market Opportunity Assessment, By Type, 2021 & 2031F |
9.2 Indonesia Hollow Glass Microspheres Market Opportunity Assessment, By Application, 2021 & 2031F |
10 Indonesia Hollow Glass Microspheres Market - Competitive Landscape |
10.1 Indonesia Hollow Glass Microspheres Market Revenue Share, By Companies, 2024 |
10.2 Indonesia Hollow Glass Microspheres Market Competitive Benchmarking, By Operating and Technical Parameters |
11 Company Profiles |
12 Recommendations |
13 Disclaimer |
Global Go To Market Strategy - 2030
Export potential enables firms to identify high-growth global markets with greater confidence by combining advanced trade intelligence with a structured quantitative methodology. The framework analyzes emerging demand trends and country-level import patterns while integrating macroeconomic and trade datasets such as GDP and population forecasts, bilateral import–export flows, tariff structures, elasticity differentials between developed and developing economies, geographic distance, and import demand projections. Using weighted trade values from 2020–2024 as the base period to project country-to-country export potential for 2030, these inputs are operationalized through calculated drivers such as gravity model parameters, tariff impact factors, and projected GDP per-capita growth. Through an analysis of hidden potentials, demand hotspots, and market conditions that are most favorable to success, this method enables firms to focus on target countries, maximize returns, and global expansion with data, backed by accuracy.
By factoring in the projected importer demand gap that is currently unmet and could be potential opportunity, it identifies the potential for the Exporter (Country) among 190 countries, against the general trade analysis, which identifies the biggest importer or exporter.
To discover high-growth global markets and optimize your business strategy:
Click Here
Pricing
- Single User License$ 1,995
- Department License$ 2,400
- Site License$ 3,120
- Global License$ 3,795

Leadership Perspectives from Industry Events
Search
Thought Leadership and Analyst Meet


Our Clients
6WResearch In News
- India Air Conditioner Market Set for Strong Rebound in 2026 After Weather-Led Correction and GST-Driven Recovery: 6Wresearch
- ADAS in India: How Automatic Emergency Braking, Blind Spot Detection & Driver Monitoring are Transforming Road Safety
- Doha a strategic location for EV manufacturing hub: IPA Qatar
- Demand for luxury TVs surging in the GCC, says Samsung
- Empowering Growth: The Thriving Journey of Bangladesh’s Cable Industry
- Demand for luxury TVs surging in the GCC, says Samsung
Latest Reports
- Nicaragua RPG Gaming Market (2026-2032)
- New Zealand RPG Gaming Market (2026-2032)
- Netherlands RPG Gaming Market (2026-2032)
- Nauru RPG Gaming Market (2026-2032)
- Namibia RPG Gaming Market (2026-2032)
- Mozambique RPG Gaming Market (2026-2032)
- Montenegro RPG Gaming Market (2026-2032)
- Mongolia RPG Gaming Market (2026-2032)
- Monaco RPG Gaming Market (2026-2032)
- Micronesia RPG Gaming Market (2026-2032)
Industry Events and Analyst Meet

EV India Expo 2026

HIMTEX 2026

India Refining Summit 2026

India EV Show 2026

EV tech India Expo 2026
Whitepaper
- Middle East & Africa Commercial Security Market Click here to view more.
- Middle East & Africa Fire Safety Systems & Equipment Market Click here to view more.
- GCC Drone Market Click here to view more.
- Middle East Lighting Fixture Market Click here to view more.
- GCC Physical & Perimeter Security Market Click here to view more.