Indonesia Hosiery Market (2024-2030) | Industry, Outlook, Growth, Analysis, Companies, Value, Revenue, Forecast, Size, Trends & Share
Market Forecast By Product (Body Stockings, Compression Stockings, Knee Highs, Hold-ups, Stockings, Socks, Tights, Toe Socks), By Gender (Men, Women), By Size (Small, Medium, Large, Plus), By Price Range (Premium, Medium, Low), By Distribution Channel (Mass Merchant, Mono Brand Outlet, Online Store, Departmental Store, Others) And Competitive Landscape
| Product Code: ETC045308 | Publication Date: Jul 2023 | Updated Date: Feb 2026 | Product Type: Report | |
| Publisher: 6Wresearch | Author: Ravi Bhandari | No. of Pages: 70 | No. of Figures: 35 | No. of Tables: 5 |
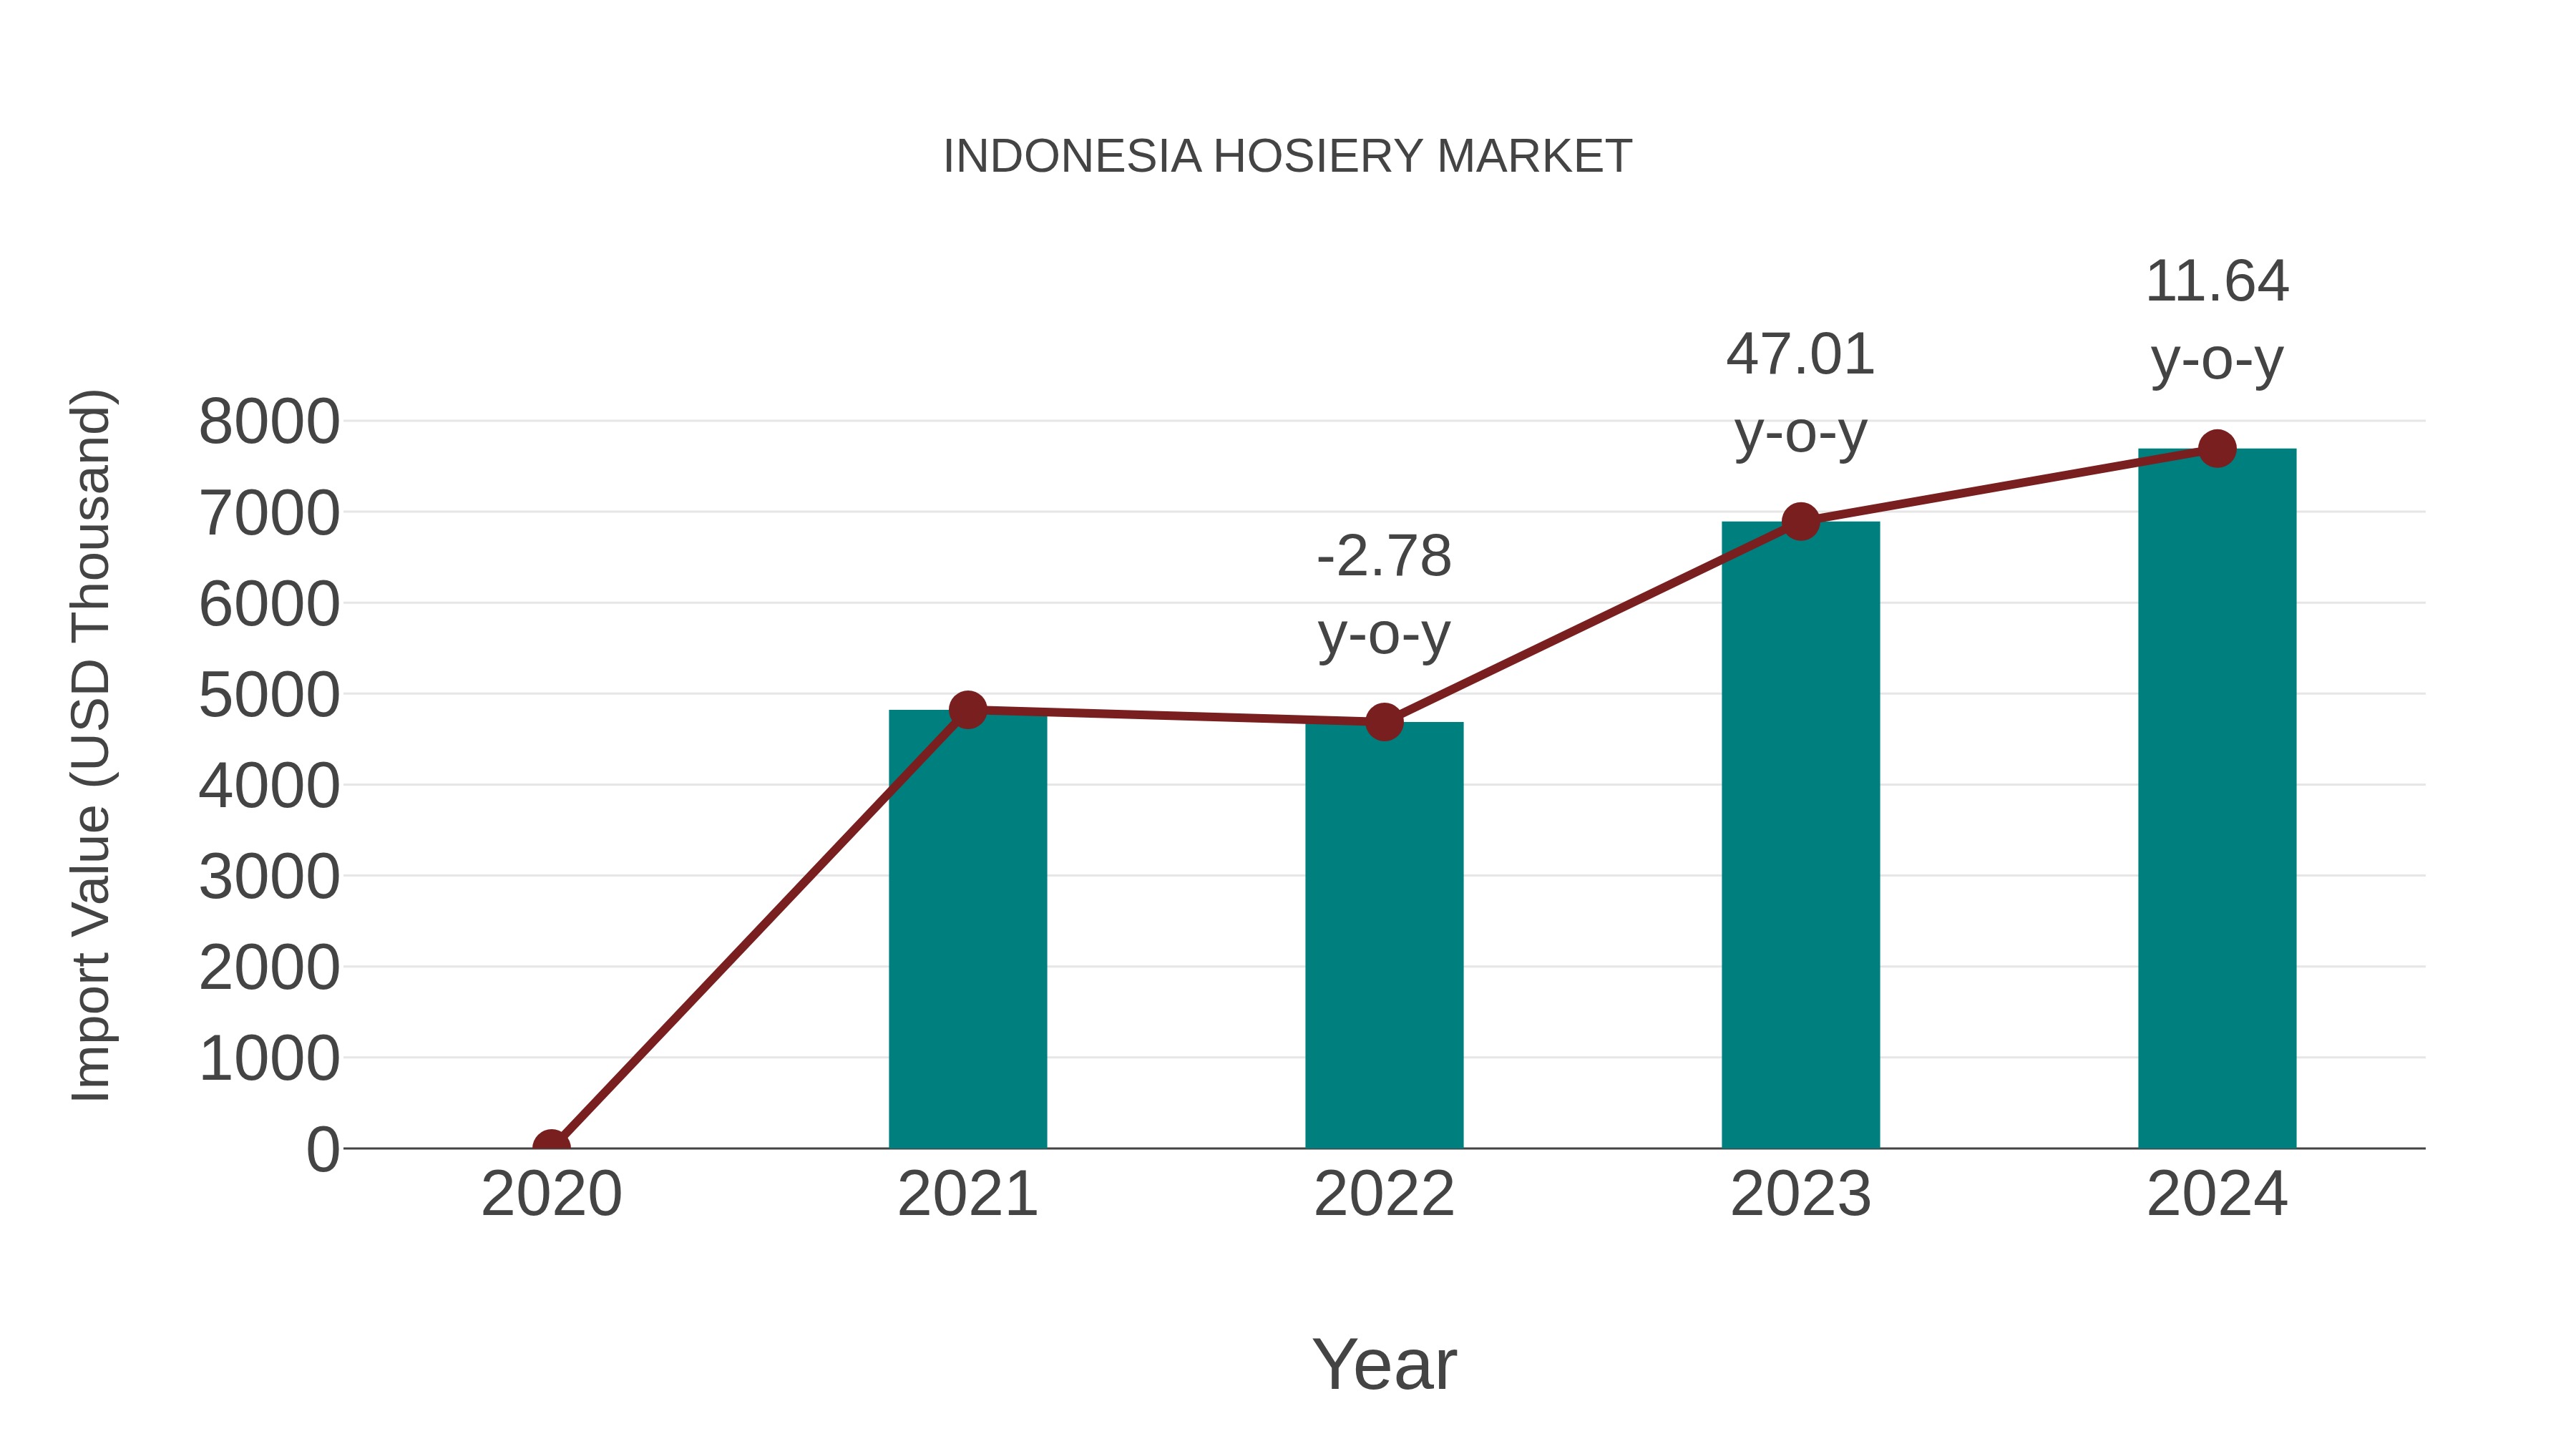
Indonesia Hosiery Market: Import Trend Analysis
In the Indonesia hosiery market, the import trend showed a notable growth rate from 2023 to 2024 at 11.64%. The compound annual growth rate (CAGR) for the period 2020-2024 stood at 16.85%. This import momentum can be attributed to a sustained demand shift towards quality hosiery products, indicating market stability and consumer preference for imported goods during this period.
Indonesia Hosiery Market Synopsis
The Indonesia Hosiery Market (2020-2026) is rising at a faster pace and there are many key drivers that are fueling theof the market. One of the major drivers is the increasing demand for fashionable and comfortable hosiery products among consumers. The growing awareness of the benefits of hosiery products such as improved blood circulation and support for the legs is also driving the market . Additionally the increasing disposable income of consumers along with the growing trend of e-commerce is contributing to theof the hosiery market in Indonesia.
However the Indonesia Hosiery Market (2020-2026) overview also identifies some challenges that are hindering theof the market. One of the major challenges is the availability of counterfeit hosiery products in the market which is affecting the sales of genuine products. Additionally the lack of awareness regarding the benefits of hosiery products among consumers is also a challenge for the market.
There are many key players who are contributing to theof the market. Some of the leading players in the market include Hanesbrands Inc. Gildan Activewear Inc. Adidas AG Nike Inc. and Puma SE. These players are adopting strategies such as product innovation mergers and acquisitions and collaborations to strengthen their market position and increase their market .
Key Highlights of the Report:
- Indonesia Hosiery Market Outlook
- Market Size of Indonesia Hosiery Market, 2023
- Forecast of Indonesia Hosiery Market, 2030
- Historical Data and Forecast of Indonesia Hosiery Revenues & Volume for the Period 2020-2030
- Indonesia Hosiery Market Trend Evolution
- Indonesia Hosiery Market Drivers and Challenges
- Indonesia Hosiery Price Trends
- Indonesia Hosiery Porter's Five Forces
- Indonesia Hosiery Industry Life Cycle
- Historical Data and Forecast of Indonesia Hosiery Market Revenues & Volume By Product for the Period 2020-2030
- Historical Data and Forecast of Indonesia Hosiery Market Revenues & Volume By Body Stockings for the Period 2020-2030
- Historical Data and Forecast of Indonesia Hosiery Market Revenues & Volume By Compression Stockings for the Period 2020-2030
- Historical Data and Forecast of Indonesia Hosiery Market Revenues & Volume By Knee Highs, Hold-ups for the Period 2020-2030
- Historical Data and Forecast of Indonesia Hosiery Market Revenues & Volume By Stockings for the Period 2020-2030
- Historical Data and Forecast of Indonesia Hosiery Market Revenues & Volume By Socks for the Period 2020-2030
- Historical Data and Forecast of Indonesia Hosiery Market Revenues & Volume By Tights for the Period 2020-2030
- Historical Data and Forecast of Indonesia Hosiery Market Revenues & Volume By Toe Socks for the Period 2020-2030
- Historical Data and Forecast of Indonesia Hosiery Market Revenues & Volume By Gender for the Period 2020-2030
- Historical Data and Forecast of Indonesia Hosiery Market Revenues & Volume By Men for the Period 2020-2030
- Historical Data and Forecast of Indonesia Hosiery Market Revenues & Volume By Women for the Period 2020-2030
- Historical Data and Forecast of Indonesia Hosiery Market Revenues & Volume By Size for the Period 2020-2030
- Historical Data and Forecast of Indonesia Hosiery Market Revenues & Volume By Small for the Period 2020-2030
- Historical Data and Forecast of Indonesia Hosiery Market Revenues & Volume By Medium for the Period 2020-2030
- Historical Data and Forecast of Indonesia Hosiery Market Revenues & Volume By Large for the Period 2020-2030
- Historical Data and Forecast of Indonesia Hosiery Market Revenues & Volume By Plus for the Period 2020-2030
- Historical Data and Forecast of Indonesia Hosiery Market Revenues & Volume By Price Range for the Period 2020-2030
- Historical Data and Forecast of Indonesia Hosiery Market Revenues & Volume By Premium for the Period 2020-2030
- Historical Data and Forecast of Indonesia Hosiery Market Revenues & Volume By Medium for the Period 2020-2030
- Historical Data and Forecast of Indonesia Hosiery Market Revenues & Volume By Low for the Period 2020-2030
- Historical Data and Forecast of Indonesia Hosiery Market Revenues & Volume By Distribution Channel for the Period 2020-2030
- Historical Data and Forecast of Indonesia Hosiery Market Revenues & Volume By Mass Merchant for the Period 2020-2030
- Historical Data and Forecast of Indonesia Hosiery Market Revenues & Volume By Mono Brand Outlet for the Period 2020-2030
- Historical Data and Forecast of Indonesia Hosiery Market Revenues & Volume By Online Store for the Period 2020-2030
- Historical Data and Forecast of Indonesia Hosiery Market Revenues & Volume By Departmental Store for the Period 2020-2030
- Historical Data and Forecast of Indonesia Hosiery Market Revenues & Volume By Others for the Period 2020-2030
- Indonesia Hosiery Import Export Trade Statistics
- Market Opportunity Assessment By Product
- Market Opportunity Assessment By Gender
- Market Opportunity Assessment By Size
- Market Opportunity Assessment By Price Range
- Market Opportunity Assessment By Distribution Channel
- Indonesia Hosiery Top Companies Market Share
- Indonesia Hosiery Competitive Benchmarking By Technical and Operational Parameters
- Indonesia Hosiery Company Profiles
- Indonesia Hosiery Key Strategic Recommendations
Frequently Asked Questions About the Market Study (FAQs):
6Wresearch actively monitors the Indonesia Hosiery Market and publishes its comprehensive annual report, highlighting emerging trends, growth drivers, revenue analysis, and forecast outlook. Our insights help businesses to make data-backed strategic decisions with ongoing market dynamics. Our analysts track relevent industries related to the Indonesia Hosiery Market, allowing our clients with actionable intelligence and reliable forecasts tailored to emerging regional needs.
Yes, we provide customisation as per your requirements. To learn more, feel free to contact us on sales@6wresearch.com
1 Executive Summary |
2 Introduction |
2.1 Key Highlights of the Report |
2.2 Report Description |
2.3 Market Scope & Segmentation |
2.4 Research Methodology |
2.5 Assumptions |
3 Indonesia Hosiery Market Overview |
3.1 Indonesia Country Macro Economic Indicators |
3.2 Indonesia Hosiery Market Revenues & Volume, 2020 & 2030F |
3.3 Indonesia Hosiery Market - Industry Life Cycle |
3.4 Indonesia Hosiery Market - Porter's Five Forces |
3.5 Indonesia Hosiery Market Revenues & Volume Share, By Product, 2020 & 2030F |
3.6 Indonesia Hosiery Market Revenues & Volume Share, By Gender, 2020 & 2030F |
3.7 Indonesia Hosiery Market Revenues & Volume Share, By Size, 2020 & 2030F |
3.8 Indonesia Hosiery Market Revenues & Volume Share, By Price Range, 2020 & 2030F |
3.9 Indonesia Hosiery Market Revenues & Volume Share, By Distribution Channel, 2020 & 2030F |
4 Indonesia Hosiery Market Dynamics |
4.1 Impact Analysis |
4.2 Market Drivers |
4.3 Market Restraints |
5 Indonesia Hosiery Market Trends |
6 Indonesia Hosiery Market, By Types |
6.1 Indonesia Hosiery Market, By Product |
6.1.1 Overview and Analysis |
6.1.2 Indonesia Hosiery Market Revenues & Volume, By Product, 2020-2030F |
6.1.3 Indonesia Hosiery Market Revenues & Volume, By Body Stockings, 2020-2030F |
6.1.4 Indonesia Hosiery Market Revenues & Volume, By Compression Stockings, 2020-2030F |
6.1.5 Indonesia Hosiery Market Revenues & Volume, By Knee Highs, Hold-ups, 2020-2030F |
6.1.6 Indonesia Hosiery Market Revenues & Volume, By Stockings, 2020-2030F |
6.1.7 Indonesia Hosiery Market Revenues & Volume, By Socks, 2020-2030F |
6.1.8 Indonesia Hosiery Market Revenues & Volume, By Tights, 2020-2030F |
6.2 Indonesia Hosiery Market, By Gender |
6.2.1 Overview and Analysis |
6.2.2 Indonesia Hosiery Market Revenues & Volume, By Men, 2020-2030F |
6.2.3 Indonesia Hosiery Market Revenues & Volume, By Women, 2020-2030F |
6.3 Indonesia Hosiery Market, By Size |
6.3.1 Overview and Analysis |
6.3.2 Indonesia Hosiery Market Revenues & Volume, By Small, 2020-2030F |
6.3.3 Indonesia Hosiery Market Revenues & Volume, By Medium, 2020-2030F |
6.3.4 Indonesia Hosiery Market Revenues & Volume, By Large, 2020-2030F |
6.3.5 Indonesia Hosiery Market Revenues & Volume, By Plus, 2020-2030F |
6.4 Indonesia Hosiery Market, By Price Range |
6.4.1 Overview and Analysis |
6.4.2 Indonesia Hosiery Market Revenues & Volume, By Premium, 2020-2030F |
6.4.3 Indonesia Hosiery Market Revenues & Volume, By Medium, 2020-2030F |
6.4.4 Indonesia Hosiery Market Revenues & Volume, By Low, 2020-2030F |
6.5 Indonesia Hosiery Market, By Distribution Channel |
6.5.1 Overview and Analysis |
6.5.2 Indonesia Hosiery Market Revenues & Volume, By Mass Merchant, 2020-2030F |
6.5.3 Indonesia Hosiery Market Revenues & Volume, By Mono Brand Outlet, 2020-2030F |
6.5.4 Indonesia Hosiery Market Revenues & Volume, By Online Store, 2020-2030F |
6.5.5 Indonesia Hosiery Market Revenues & Volume, By Departmental Store, 2020-2030F |
6.5.6 Indonesia Hosiery Market Revenues & Volume, By Others, 2020-2030F |
7 Indonesia Hosiery Market Import-Export Trade Statistics |
7.1 Indonesia Hosiery Market Export to Major Countries |
7.2 Indonesia Hosiery Market Imports from Major Countries |
8 Indonesia Hosiery Market Key Performance Indicators |
9 Indonesia Hosiery Market - Opportunity Assessment |
9.1 Indonesia Hosiery Market Opportunity Assessment, By Product, 2020 & 2030F |
9.2 Indonesia Hosiery Market Opportunity Assessment, By Gender, 2020 & 2030F |
9.3 Indonesia Hosiery Market Opportunity Assessment, By Size, 2020 & 2030F |
9.4 Indonesia Hosiery Market Opportunity Assessment, By Price Range, 2020 & 2030F |
9.5 Indonesia Hosiery Market Opportunity Assessment, By Distribution Channel, 2020 & 2030F |
10 Indonesia Hosiery Market - Competitive Landscape |
10.1 Indonesia Hosiery Market Revenue Share, By Companies, 2023 |
10.2 Indonesia Hosiery Market Competitive Benchmarking, By Operating and Technical Parameters |
11 Company Profiles |
12 Recommendations |
13 Disclaimer |
Global Go To Market Strategy - 2030
Export potential enables firms to identify high-growth global markets with greater confidence by combining advanced trade intelligence with a structured quantitative methodology. The framework analyzes emerging demand trends and country-level import patterns while integrating macroeconomic and trade datasets such as GDP and population forecasts, bilateral import–export flows, tariff structures, elasticity differentials between developed and developing economies, geographic distance, and import demand projections. Using weighted trade values from 2020–2024 as the base period to project country-to-country export potential for 2030, these inputs are operationalized through calculated drivers such as gravity model parameters, tariff impact factors, and projected GDP per-capita growth. Through an analysis of hidden potentials, demand hotspots, and market conditions that are most favorable to success, this method enables firms to focus on target countries, maximize returns, and global expansion with data, backed by accuracy.
By factoring in the projected importer demand gap that is currently unmet and could be potential opportunity, it identifies the potential for the Exporter (Country) among 190 countries, against the general trade analysis, which identifies the biggest importer or exporter.
To discover high-growth global markets and optimize your business strategy:
Click Here
Pricing
- Single User License$ 1,995
- Department License$ 2,400
- Site License$ 3,120
- Global License$ 3,795

Leadership Perspectives from Industry Events
Search
Thought Leadership and Analyst Meet


Our Clients
6WResearch In News
- India Air Conditioner Market Set for Strong Rebound in 2026 After Weather-Led Correction and GST-Driven Recovery: 6Wresearch
- ADAS in India: How Automatic Emergency Braking, Blind Spot Detection & Driver Monitoring are Transforming Road Safety
- Doha a strategic location for EV manufacturing hub: IPA Qatar
- Demand for luxury TVs surging in the GCC, says Samsung
- Empowering Growth: The Thriving Journey of Bangladesh’s Cable Industry
- Demand for luxury TVs surging in the GCC, says Samsung
Latest Reports
- Poland Fire Protection Systems Market (2026-2032)
- Cape Verde Portable Hand-Thrown Extinguisher Market (2026-2032)
- Canada Portable Hand-Thrown Extinguisher Market (2026-2032)
- Cameroon Portable Hand-Thrown Extinguisher Market (2026-2032)
- Burundi Portable Hand-Thrown Extinguisher Market (2026-2032)
- Burkina Faso Portable Hand-Thrown Extinguisher Market (2026-2032)
- Bulgaria Portable Hand-Thrown Extinguisher Market (2026-2032)
- Brunei Portable Hand-Thrown Extinguisher Market (2026-2032)
- Botswana Portable Hand-Thrown Extinguisher Market (2026-2032)
- Bosnia and Herzegovina Portable Hand-Thrown Extinguisher Market (2026-2032)
Industry Events and Analyst Meet

HIMTEX 2026

India Refining Summit 2026

India EV Show 2026

EV tech India Expo 2026

Auto Tech Asia 2026
Whitepaper
- Middle East & Africa Commercial Security Market Click here to view more.
- Middle East & Africa Fire Safety Systems & Equipment Market Click here to view more.
- GCC Drone Market Click here to view more.
- Middle East Lighting Fixture Market Click here to view more.
- GCC Physical & Perimeter Security Market Click here to view more.