Indonesia Image Intensifier Tube Market (2026-2032) Outlook | Industry, Value, Size, Forecast, Analysis, Companies, Trends, Revenue, Share & Growth
Market Forecast By Service (Healthcare, Pharmaceutical), By Technology (Tungsten Halogen Image Intensifiers, Xenon Arc Image Intensifiers) And Competitive Landscape
| Product Code: ETC264928 | Publication Date: Aug 2023 | Updated Date: Jul 2026 | Product Type: Market Research Report | |
| Publisher: 6Wresearch | Author: Ravi Bhandari | No. of Pages: 75 | No. of Figures: 35 | No. of Tables: 20 |
Indonesia Image Intensifier Tube Market Size, Share & Growth Rate
The Indonesia Image Intensifier Tube Market was estimated at USD 491 Million in 2025 and is projected to reach USD 653 Million by 2032, growing at a CAGR of 4.2% from 2026 to 2032. This positive trajectory reflects the increasing demand for advanced imaging technologies, particularly in defense and security applications. As industries recognize the critical importance of enhanced night vision and surveillance capabilities, the market is positioned for sustained growth.
Indonesia Image Intensifier Tube Market Year-wise Growth Rate and Key Drivers
This graph highlights how the Indonesia Image Intensifier Tube Market has steadily grown over the years, supported by major growth factors.
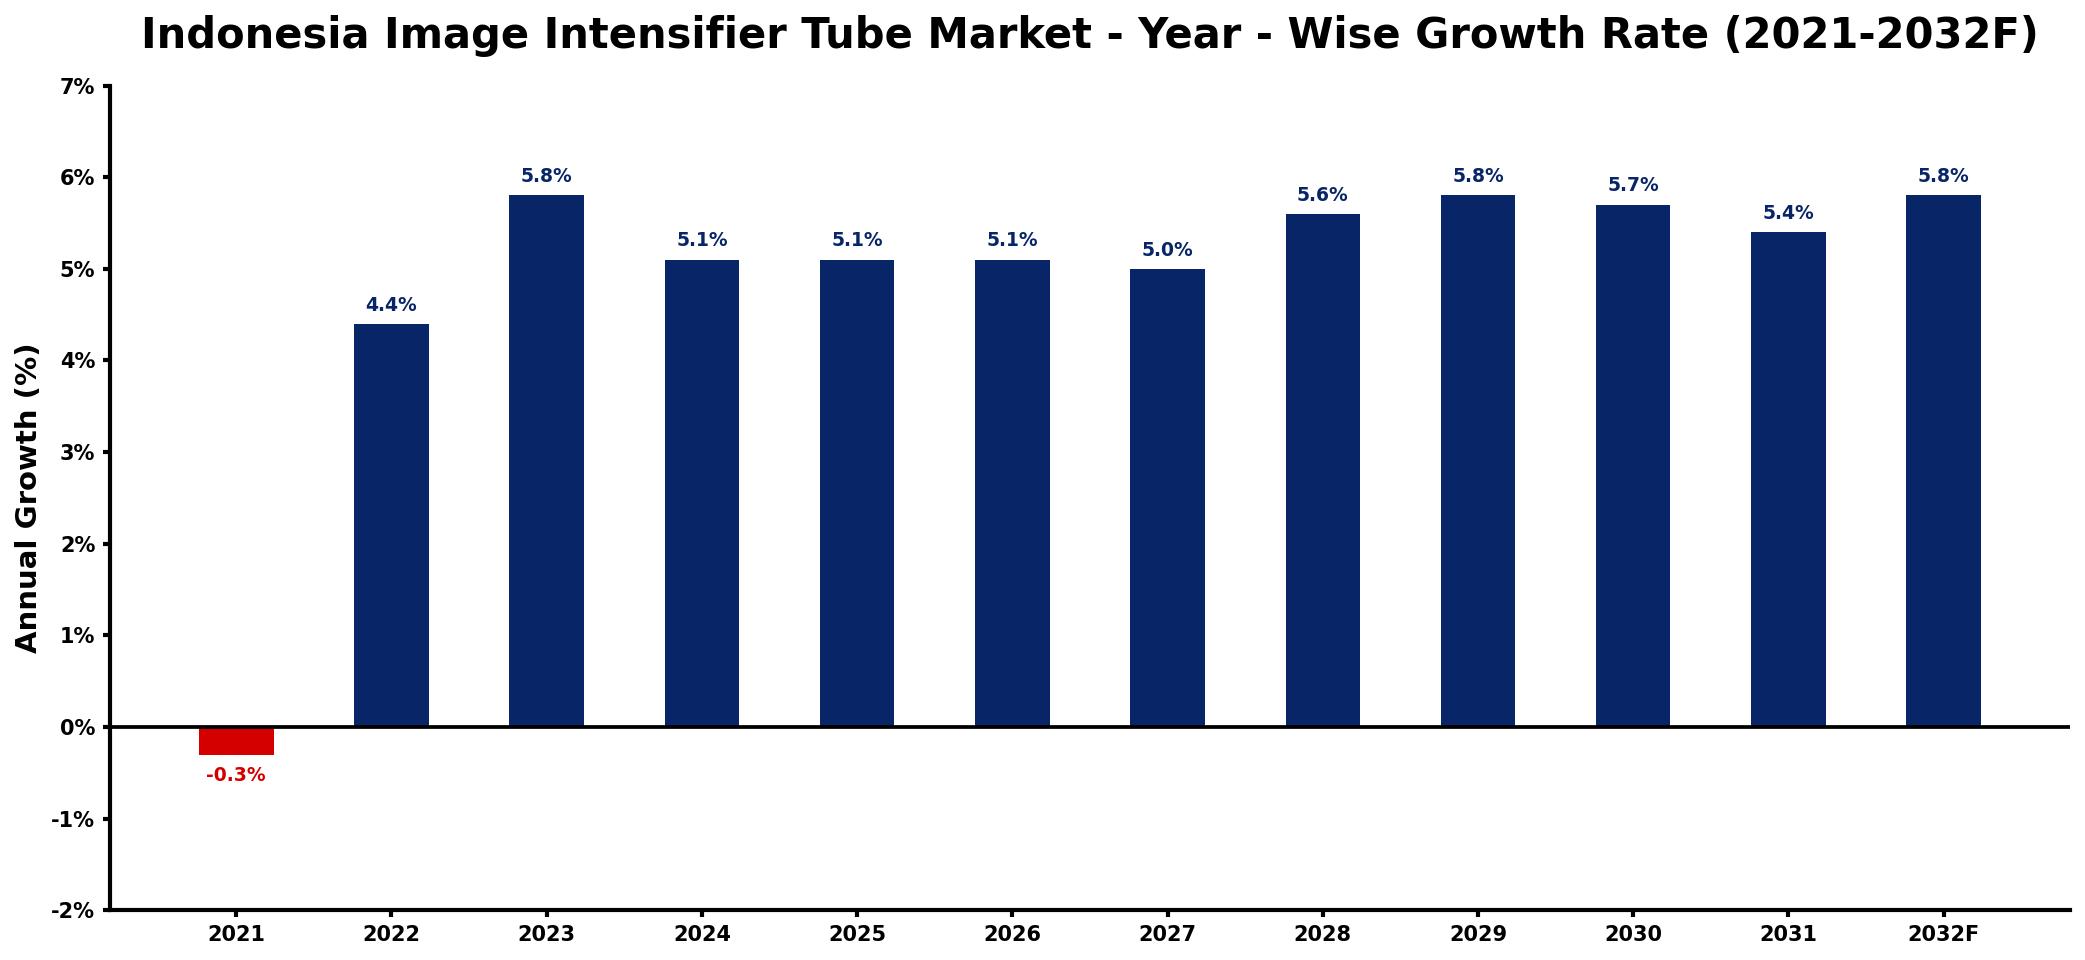
The table below presents the year‑wise growth rates along with the key drivers influencing the market
| Year | Growth Rate | Major Drivers |
| 2021 | -0.3% | decreased military modernization investments |
| 2022 | 4.4% | increased defense sector spending |
| 2023 | 5.8% | growing demand for surveillance systems |
| 2024 | 5.1% | rise in night vision applications |
| 2025 | 5.1% | expansion of security infrastructure projects |
| 2026 | 5.1% | increased interest in advanced optics |
| 2027 | 5.0% | growth in automotive safety technologies |
| 2028 | 5.6% | surge in consumer electronics adoption |
| 2029 | 5.8% | enhanced funding for research initiatives |
| 2030 | 5.7% | development of new military technologies |
| 2031 | 5.4% | rising popularity of outdoor activities |
| 2032 | 5.8% | growing applications in healthcare imaging |
Note: Market size estimations and growth projections presented in this report are based on 6Wresearch's proprietary forecasting methodology, utilizing the latest available industry data, government publications, and primary research inputs.
Indonesia Image Intensifier Tube Market Synopsis
The Indonesia Image Intensifier Tube Market is currently experiencing momentum driven by a surge in demand for sophisticated imaging solutions. In particular, sectors such as defense, law enforcement, and medical imaging are key contributors to this growth, reflecting a broader trend towards modernization in the country.
Looking ahead, the market is poised to expand further as technological advancements and government initiatives foster an environment conducive to innovation. As Indonesia continues to invest in its defense and security infrastructure, the demand for high-quality image intensifier tubes will likely accelerate, presenting new opportunities for stakeholders.
Indonesia Image Intensifier Tube Market Key Takeaways
- Robust growth anticipated in defense and security sectors, underlining the importance of night vision technologies.
- Increased applications in medical imaging and astronomy are diversifying market demand.
- Government modernization efforts in defense are pivotal in shaping market dynamics.
- Technological advancements play a critical role in improving image quality and functionality.
- High import dependency poses a potential risk to supply chain stability and cost efficiency.
Evaluation of Restraints in Indonesia Image Intensifier Tube Market
The Indonesia Image Intensifier Tube Market faces significant constraints primarily due to high reliance on imported technology components. This dependency can lead to supply chain vulnerabilities, affecting production timelines and cost structures. Additionally, economic fluctuations can further complicate procurement strategies, making it challenging for domestic players to respond swiftly to market demands. As such, addressing these supply chain issues will be critical for ensuring the market's sustained growth.
Indonesia Image Intensifier Tube Market Trends
Several trends are shaping the future of the Indonesia Image Intensifier Tube Market. Firstly, there is a growing emphasis on miniaturization and integration of advanced technologies into smaller form factors. This trend is driven by the need for portability in military and surveillance applications. Secondly, advancements in digital image processing are improving the performance and capabilities of image intensifier tubes, allowing for clearer and more precise visuals in low-light conditions. Finally, increasing collaboration between public and private sectors is fostering innovation and accelerating the deployment of new technologies in key industries.
Indonesia Image Intensifier Tube Market Opportunities
The market presents numerous opportunities for growth and investment, particularly in R&D for developing next-generation image intensifier technologies. Collaborations with local defense manufacturers can enhance the supply chain and reduce import dependence. Furthermore, expanding applications in non-traditional fields such as environmental monitoring and wildlife conservation are emerging as viable growth areas. As Indonesia looks to strengthen its technological capabilities, stakeholders who can provide innovative solutions will find themselves at a competitive advantage.
Government Initiatives in the Indonesia Image Intensifier Tube Market
The Indonesian government is actively investing in its defense and security sectors, which includes modernization programs aimed at upgrading surveillance and military equipment. Policies promoting local manufacturing of advanced technological components are also on the rise, encouraging partnerships with global technology firms to boost domestic capabilities. These initiatives are expected to create a favorable environment for the growth of the image intensifier tube market as the country seeks to enhance its strategic and operational effectiveness.
Future Insights of the Indonesia Image Intensifier Tube Market
From 2026 to 2032, the Indonesia Image Intensifier Tube Market is anticipated to evolve significantly, driven by technological innovations and an increasing focus on security. The demand for high-performance imaging solutions will likely escalate as industries recognize their value in enhancing operational effectiveness. Additionally, as the government continues to prioritize defense spending and modernization, opportunities for local manufacturers and suppliers will expand, positioning the market for a robust growth trajectory.
Indonesia Image Intensifier Tube Market Latest Developments (2025 - 2026)
In recent months, the market has witnessed several noteworthy developments, including new partnerships aimed at advancing technology in image intensification. Initiatives focused on local production capabilities have emerged, as companies seek to mitigate import risks and strengthen their supply chains. Additionally, advancements in digital imaging techniques are being integrated into existing products, enhancing performance and reliability in low-light conditions.
Indonesia Image Intensifier Tube Market - Key Attractiveness of the Report
- 10 Years of Market Numbers
- Historical Data Starting from 2022 to 2025
- Base Year: 2025
- Forecast Data until 2032
- Key Performance Indicators Impacting the Market
- Major Upcoming Developments and Projects
Key Highlights of the Report:
- Indonesia Image Intensifier Tube Market Outlook
- Market Size of Indonesia Image Intensifier Tube Market, 2025
- Forecast of Indonesia Image Intensifier Tube Market, 2032
- Historical Data and Forecast of Indonesia Image Intensifier Tube Revenues & Volume for the Period 2022-2032F
- Indonesia Image Intensifier Tube Market Trend Evolution
- Indonesia Image Intensifier Tube Market Drivers and Challenges
- Indonesia Image Intensifier Tube Price Trends
- Indonesia Image Intensifier Tube Porter's Five Forces
- Indonesia Image Intensifier Tube Industry Life Cycle
- Historical Data and Forecast of Indonesia Image Intensifier Tube Market Revenues & Volume By Service for the Period 2022-2032F
- Historical Data and Forecast of Indonesia Image Intensifier Tube Market Revenues & Volume By Healthcare for the Period 2022-2032F
- Historical Data and Forecast of Indonesia Image Intensifier Tube Market Revenues & Volume By Pharmaceutical for the Period 2022-2032F
- Historical Data and Forecast of Indonesia Image Intensifier Tube Market Revenues & Volume By Technology for the Period 2022-2032F
- Historical Data and Forecast of Indonesia Image Intensifier Tube Market Revenues & Volume By Tungsten Halogen Image Intensifiers for the Period 2022-2032F
- Historical Data and Forecast of Indonesia Image Intensifier Tube Market Revenues & Volume By Xenon Arc Image Intensifiers for the Period 2022-2032F
- Indonesia Image Intensifier Tube Import Export Trade Statistics
- Market Opportunity Assessment By Service
- Market Opportunity Assessment By Technology
- Indonesia Image Intensifier Tube Top Companies Market Share
- Indonesia Image Intensifier Tube Competitive Benchmarking By Technical and Operational Parameters
- Indonesia Image Intensifier Tube Company Profiles
- Indonesia Image Intensifier Tube Key Strategic Recommendations
Frequently Asked Questions About the Market Study (FAQs):
The growth of this market is largely attributed to increasing demands in defense, security, and medical imaging applications. The drive for enhanced night vision capabilities is particularly significant.
The COVID-19 pandemic has caused supply chain disruptions, impacting production and delaying procurement decisions, particularly in the defense sector, which is a major consumer of these technologies.
The market was estimated at USD 491 Million in 2025 and is projected to reach USD 653 Million by 2032, representing a CAGR of 4.2% from 2026 to 2032.
Yes, trends such as miniaturization, digital image processing advancements, and increased collaboration between sectors are shaping demand and product offerings in the market.
There are significant opportunities for R&D investments in next-generation technologies, local manufacturing partnerships, and expansion into new application areas such as environmental monitoring.
6Wresearch actively monitors the Indonesia Image Intensifier Tube Market and publishes its comprehensive annual report, highlighting emerging trends, growth drivers, revenue analysis, and forecast outlook. Our insights help businesses to make data-backed strategic decisions with ongoing market dynamics. Our analysts track relevent industries related to the Indonesia Image Intensifier Tube Market, allowing our clients with actionable intelligence and reliable forecasts tailored to emerging regional needs.
Yes, we provide customisation as per your requirements. To learn more, feel free to contact us on sales@6wresearch.com
1 Executive Summary |
2 Introduction |
2.1 Key Highlights of the Report |
2.2 Report Description |
2.3 Market Scope & Segmentation |
2.4 Research Methodology |
2.5 Assumptions |
3 Indonesia Image Intensifier Tube Market Overview |
3.1 Indonesia Country Macro Economic Indicators |
3.2 Indonesia Image Intensifier Tube Market Revenues & Volume, 2022 & 2032F |
3.3 Indonesia Image Intensifier Tube Market - Industry Life Cycle |
3.4 Indonesia Image Intensifier Tube Market - Porter's Five Forces |
3.5 Indonesia Image Intensifier Tube Market Revenues & Volume Share, By Service, 2022 & 2032F |
3.6 Indonesia Image Intensifier Tube Market Revenues & Volume Share, By Technology, 2022 & 2032F |
4 Indonesia Image Intensifier Tube Market Dynamics |
4.1 Impact Analysis |
4.2 Market Drivers |
4.2.1 Increasing demand for night vision devices in military and defense applications |
4.2.2 Growth in surveillance and security applications driving the need for image intensifier tubes |
4.2.3 Technological advancements leading to improved performance and capabilities of image intensifier tubes |
4.3 Market Restraints |
4.3.1 High initial investment and maintenance costs associated with image intensifier tubes |
4.3.2 Availability of alternative night vision technologies impacting the market growth |
4.3.3 Stringent regulations and export restrictions affecting the market dynamics |
5 Indonesia Image Intensifier Tube Market Trends |
6 Indonesia Image Intensifier Tube Market, By Types |
6.1 Indonesia Image Intensifier Tube Market, By Service |
6.1.1 Overview and Analysis |
6.1.2 Indonesia Image Intensifier Tube Market Revenues & Volume, By Service, 2022-2032F |
6.1.3 Indonesia Image Intensifier Tube Market Revenues & Volume, By Healthcare, 2022-2032F |
6.1.4 Indonesia Image Intensifier Tube Market Revenues & Volume, By Pharmaceutical, 2022-2032F |
6.2 Indonesia Image Intensifier Tube Market, By Technology |
6.2.1 Overview and Analysis |
6.2.2 Indonesia Image Intensifier Tube Market Revenues & Volume, By Tungsten Halogen Image Intensifiers, 2022-2032F |
6.2.3 Indonesia Image Intensifier Tube Market Revenues & Volume, By Xenon Arc Image Intensifiers, 2022-2032F |
7 Indonesia Image Intensifier Tube Market Import-Export Trade Statistics |
7.1 Indonesia Image Intensifier Tube Market Export to Major Countries |
7.2 Indonesia Image Intensifier Tube Market Imports from Major Countries |
8 Indonesia Image Intensifier Tube Market Key Performance Indicators |
8.1 Research and development investment in new technologies for image intensifier tubes |
8.2 Adoption rate of image intensifier tubes in emerging applications such as wildlife observation and search and rescue operations |
8.3 Rate of adoption of night vision devices in commercial sectors such as automotive and healthcare |
9 Indonesia Image Intensifier Tube Market - Opportunity Assessment |
9.1 Indonesia Image Intensifier Tube Market Opportunity Assessment, By Service, 2022 & 2032F |
9.2 Indonesia Image Intensifier Tube Market Opportunity Assessment, By Technology, 2022 & 2032F |
10 Indonesia Image Intensifier Tube Market - Competitive Landscape |
10.1 Indonesia Image Intensifier Tube Market Revenue Share, By Companies, 2025 |
10.2 Indonesia Image Intensifier Tube Market Competitive Benchmarking, By Operating and Technical Parameters |
11 Company Profiles |
12 Recommendations |
13 Disclaimer |
Global Go To Market Strategy - 2030
Export potential enables firms to identify high-growth global markets with greater confidence by combining advanced trade intelligence with a structured quantitative methodology. The framework analyzes emerging demand trends and country-level import patterns while integrating macroeconomic and trade datasets such as GDP and population forecasts, bilateral import–export flows, tariff structures, elasticity differentials between developed and developing economies, geographic distance, and import demand projections. Using weighted trade values from 2020–2024 as the base period to project country-to-country export potential for 2030, these inputs are operationalized through calculated drivers such as gravity model parameters, tariff impact factors, and projected GDP per-capita growth. Through an analysis of hidden potentials, demand hotspots, and market conditions that are most favorable to success, this method enables firms to focus on target countries, maximize returns, and global expansion with data, backed by accuracy.
By factoring in the projected importer demand gap that is currently unmet and could be potential opportunity, it identifies the potential for the Exporter (Country) among 190 countries, against the general trade analysis, which identifies the biggest importer or exporter.
To discover high-growth global markets and optimize your business strategy:
Click Here
Pricing
- Single User License$ 1,995
- Department License$ 2,400
- Site License$ 3,120
- Global License$ 3,795

Leadership Perspectives from Industry Events
Search
Thought Leadership and Analyst Meet


Our Clients
6WResearch In News
- India Air Conditioner Market Set for Strong Rebound in 2026 After Weather-Led Correction and GST-Driven Recovery: 6Wresearch
- ADAS in India: How Automatic Emergency Braking, Blind Spot Detection & Driver Monitoring are Transforming Road Safety
- Doha a strategic location for EV manufacturing hub: IPA Qatar
- Demand for luxury TVs surging in the GCC, says Samsung
- Empowering Growth: The Thriving Journey of Bangladesh’s Cable Industry
- Demand for luxury TVs surging in the GCC, says Samsung
Latest Reports
- Nicaragua RPG Gaming Market (2026-2032)
- New Zealand RPG Gaming Market (2026-2032)
- Netherlands RPG Gaming Market (2026-2032)
- Nauru RPG Gaming Market (2026-2032)
- Namibia RPG Gaming Market (2026-2032)
- Mozambique RPG Gaming Market (2026-2032)
- Montenegro RPG Gaming Market (2026-2032)
- Mongolia RPG Gaming Market (2026-2032)
- Monaco RPG Gaming Market (2026-2032)
- Micronesia RPG Gaming Market (2026-2032)
Industry Events and Analyst Meet

EV India Expo 2026

HIMTEX 2026

India Refining Summit 2026

India EV Show 2026

EV tech India Expo 2026
Whitepaper
- Middle East & Africa Commercial Security Market Click here to view more.
- Middle East & Africa Fire Safety Systems & Equipment Market Click here to view more.
- GCC Drone Market Click here to view more.
- Middle East Lighting Fixture Market Click here to view more.
- GCC Physical & Perimeter Security Market Click here to view more.