Indonesia Ion exchange resins Market (2026-2032) Outlook | Revenue, Size, Share, Value, Industry, Companies, Forecast, Analysis, Growth & Trends
Market Forecast By Type (Cationic Resins, Anionic Resins, Others), By Application (Water, Non-water), By End-use Industry (Power, Chemical & Petrochemical, Food & Beverage, Pharmaceutical, Electrical & Electronics, Metal & Mining, Others) And Competitive Landscape
| Product Code: ETC100667 | Publication Date: Jul 2023 | Updated Date: Mar 2026 | Product Type: Report | |
| Publisher: 6Wresearch | Author: Ravi Bhandari | No. of Pages: 70 | No. of Figures: 35 | No. of Tables: 5 |
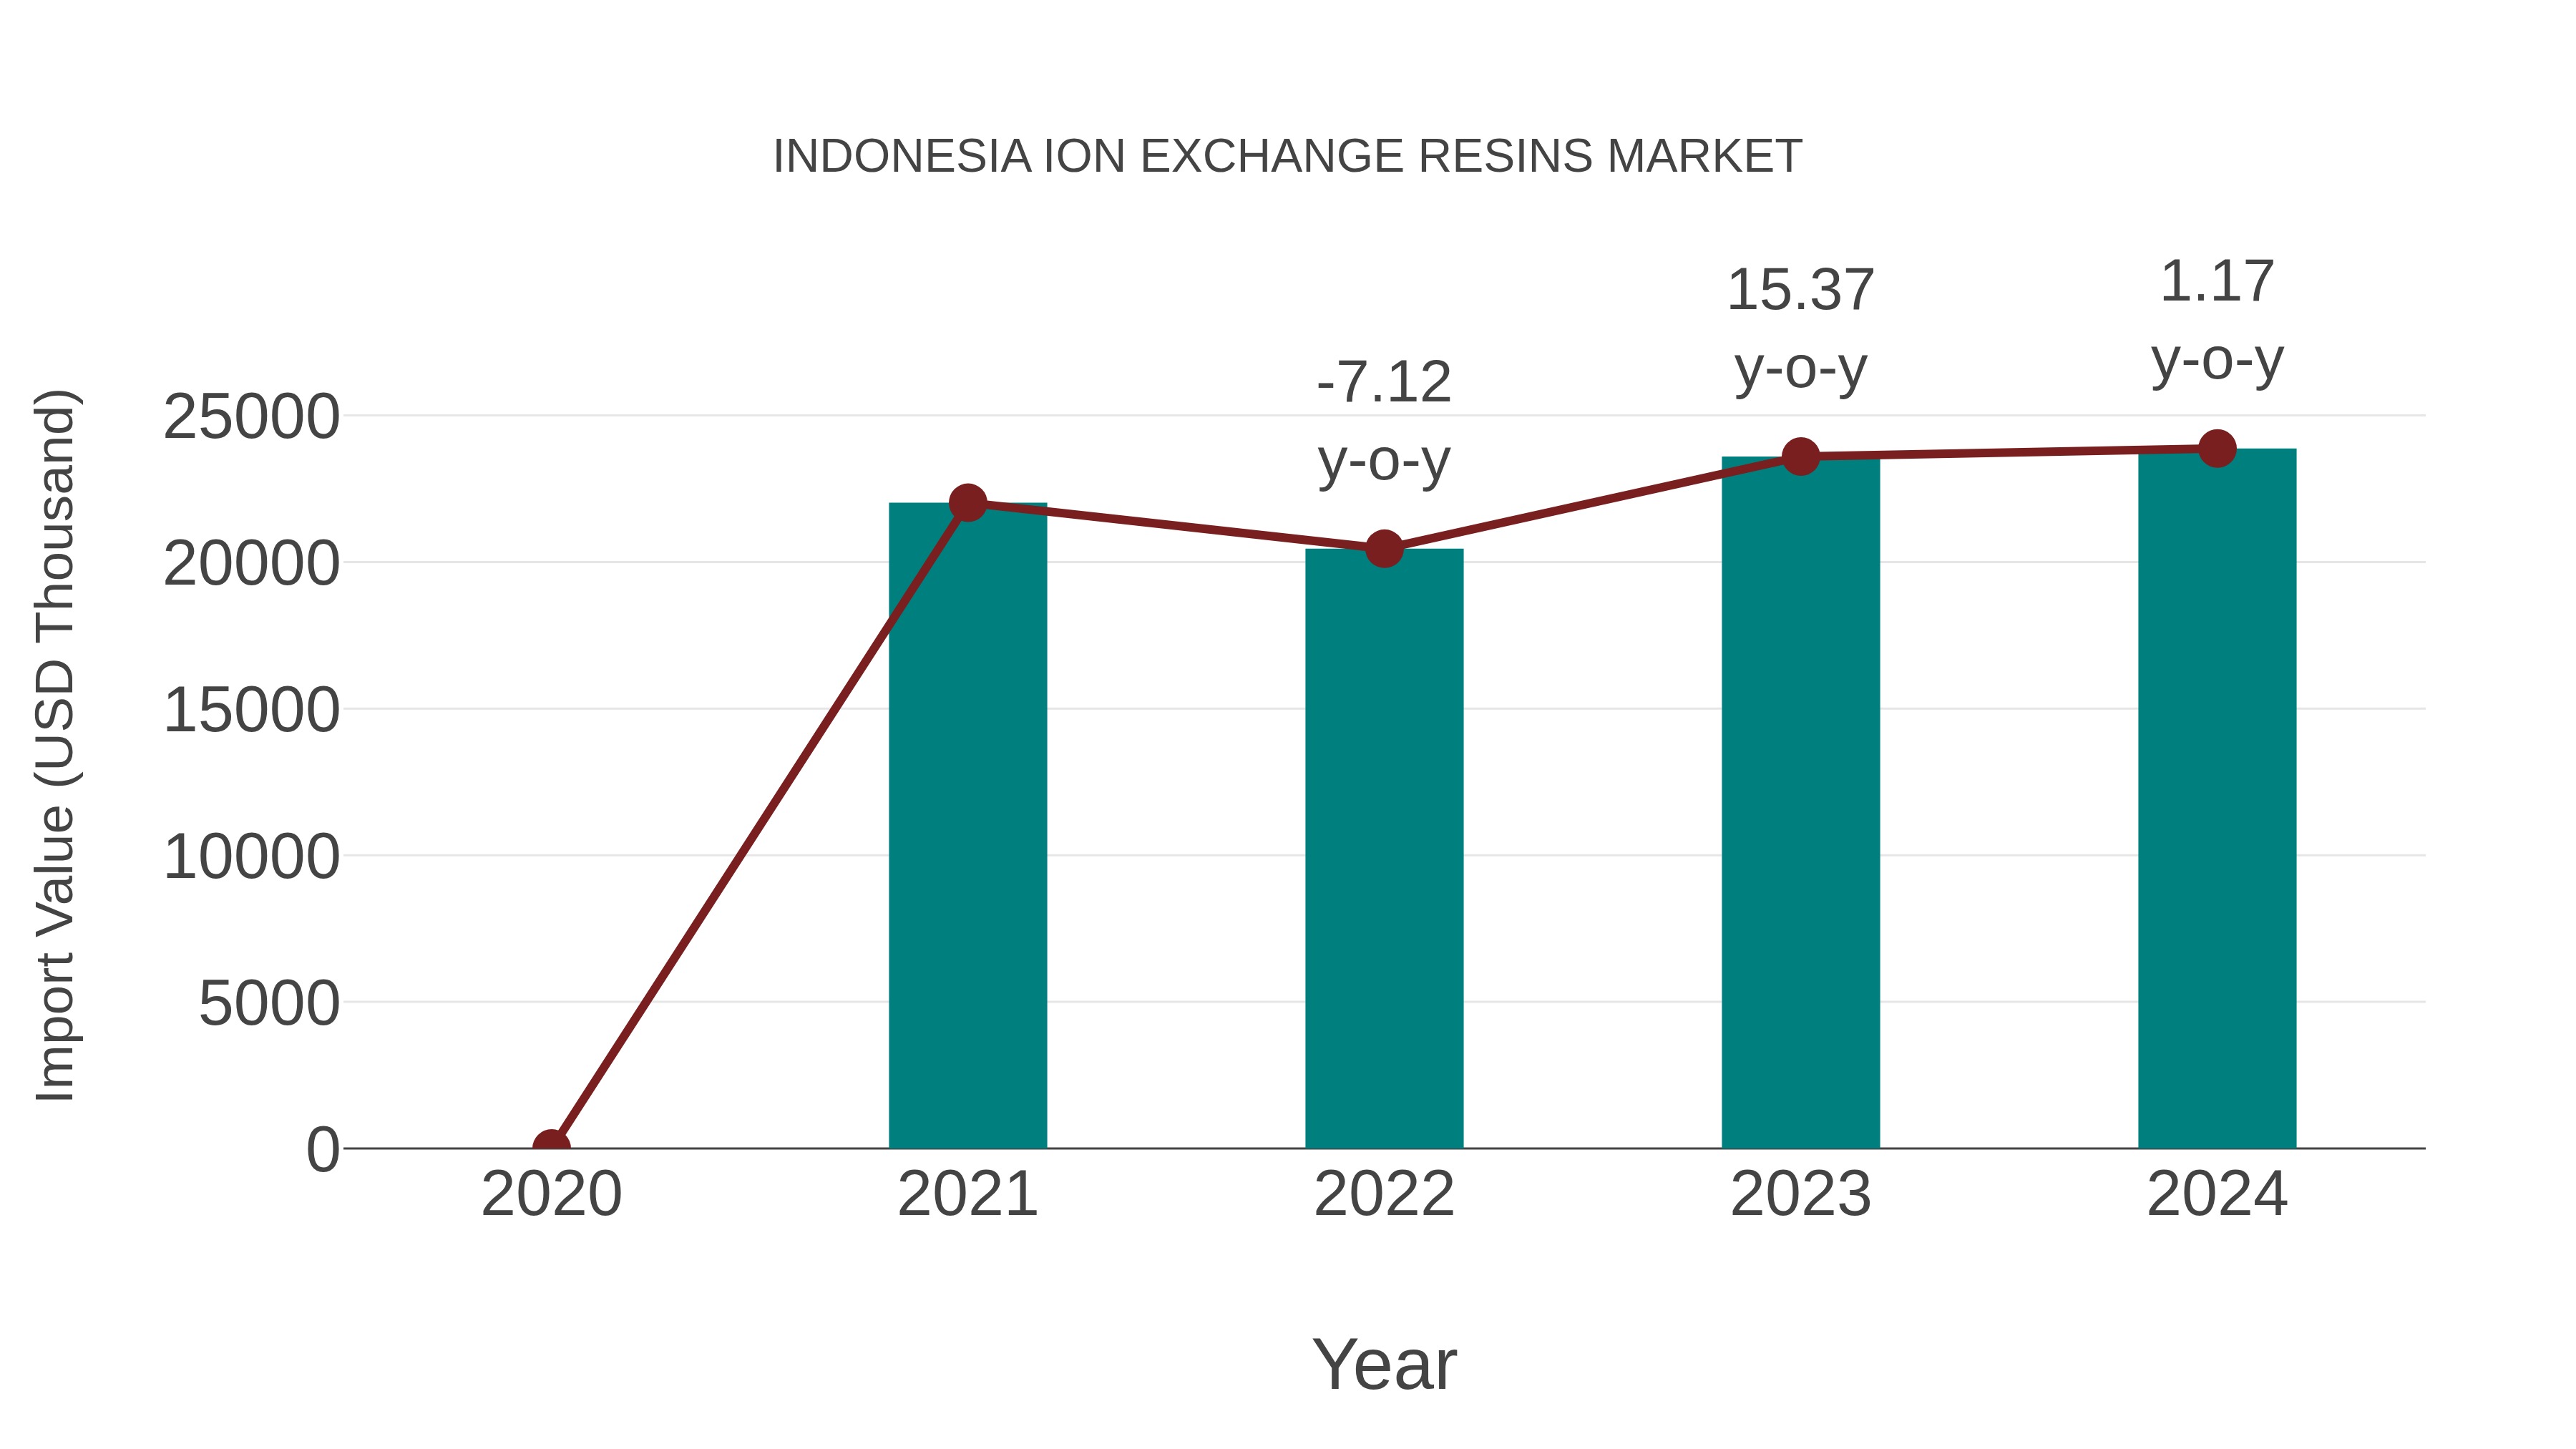
Indonesia Ion Exchange Resins Market: Import Trend Analysis
In the Indonesia ion exchange resins market, the import trend saw a growth rate of 1.17% from 2023 to 2024, with a compound annual growth rate (CAGR) of 2.73% from 2020 to 2024. This indicates a moderate import momentum in the market, possibly influenced by evolving demand dynamics or market stability during the period.
Ion exchange resins Market: Indonesia vs Top 5 Major Economies in 2027 (Asia)
Indonesia's Ion exchange resins market is anticipated to experience a growing growth rate of 8.91% by 2027, reflecting trends observed in the largest economy China, followed by India, Japan, Australia and South Korea.

Indonesia Ion exchange resins Market Synopsis
Ion exchange resins are synthetic polymers used to remove ions from a solution, typically by exchanging them for other ions in the solution. They are widely used in water treatment and waste-water treatment processes, as well as many industrial applications such as food processing, pharmaceuticals production and metal recovery. Indonesia is one of the largest markets for ion exchange resins globally due to its large population size and rapidly growing economy. The expanding urbanization rates coupled with rising disposable incomes have led to increased demand for clean potable water, driving growth of the Indonesia ion exchange resin market.
Market Trends
The increasing use of reverse osmosis systems in residential sectors has been a key trend driving demand for ion exchange resins in Indonesia. Growing environmental concerns over chemical pollutants have also resulted in an increase in demand for these products from various industries including wastewater treatment plants and paper mills. Furthermore, there has been increased investment into R&D activities related to new technologies which can be applied on existing filtration systems leading to greater efficiency resulting in higher sales volumes of ion exchange resins across the country.
Market Drivers
A major factor boosting growth of the Indonesia Ion Exchange Resin Market is rising commercial investments towards improving drinking water quality standards across both rural and urban areas throughout the country which has led to increased usage within municipal infrastructure projects such as desalination plants & sewage/wastewater treatments among others that require high levels of purification before they can be made available safe consumption purposes or natural environment without causing any harm. Additionally, government initiatives focusing on promoting green energy sources like solar power generation along with incentives offered by local authorities towards adoption are expected further bolster overall industry expansion during forecast period.
COVID-19 Impact on the Market
Ion exchange resins are an important industrial product in Indonesia and have experienced rapid growth in demand since the start of COVID-19. The increasing number of water treatment plants, particularly in urban areas, has provided a strong impetus for the market. With increased concern about water quality, demand for commercial grade ion exchange resins is expected to remain high during the forecast period.
Challenges of the Market
The key challenges faced by Indonesia ion exchange resin market include escalating raw material prices, fluctuating foreign currency exchange rates and stringent environmental regulations. These factors have adversely impacted producer profitability due to reduced operating margins and rising production costs. Besides this, supply chain disruptions caused by global pandemic such as lockdowns across various countries have led to disruption of imports from international suppliers which has also hampered the industry`s growth prospects in recent times.
Industry Key Players
In terms of key players operating within the Indonesia Ion Exchange Resin Market some prominent names include Purolite Corporation (USA), Lanxess AG (Germany), Thermax Global Ltd (India), Mitsubishi Chemical Corporation (Japan), Akzo Nobel N V (Netherlands), DuPont de Nemours Inc.( USA ), Graver Technologies LLC( USA ) etc.
Key Highlights of the Report:
- Indonesia Ion exchange resins Market Outlook
- Market Size of Indonesia Ion exchange resins Market, 2025
- Forecast of Indonesia Ion exchange resins Market, 2032
- Historical Data and Forecast of Indonesia Ion exchange resins Revenues & Volume for the Period 2022-2032F
- Indonesia Ion exchange resins Market Trend Evolution
- Indonesia Ion exchange resins Market Drivers and Challenges
- Indonesia Ion exchange resins Price Trends
- Indonesia Ion exchange resins Porter's Five Forces
- Indonesia Ion exchange resins Industry Life Cycle
- Historical Data and Forecast of Indonesia Ion exchange resins Market Revenues & Volume By Type for the Period 2022-2032F
- Historical Data and Forecast of Indonesia Ion exchange resins Market Revenues & Volume By Cationic Resins for the Period 2022-2032F
- Historical Data and Forecast of Indonesia Ion exchange resins Market Revenues & Volume By Anionic Resins for the Period 2022-2032F
- Historical Data and Forecast of Indonesia Ion exchange resins Market Revenues & Volume By Others for the Period 2022-2032F
- Historical Data and Forecast of Indonesia Ion exchange resins Market Revenues & Volume By Application for the Period 2022-2032F
- Historical Data and Forecast of Indonesia Ion exchange resins Market Revenues & Volume By Water for the Period 2022-2032F
- Historical Data and Forecast of Indonesia Ion exchange resins Market Revenues & Volume By Non-water for the Period 2022-2032F
- Historical Data and Forecast of Indonesia Ion exchange resins Market Revenues & Volume By End-use Industry for the Period 2022-2032F
- Historical Data and Forecast of Indonesia Ion exchange resins Market Revenues & Volume By Power for the Period 2022-2032F
- Historical Data and Forecast of Indonesia Ion exchange resins Market Revenues & Volume By Chemical & Petrochemical for the Period 2022-2032F
- Historical Data and Forecast of Indonesia Ion exchange resins Market Revenues & Volume By Food & Beverage for the Period 2022-2032F
- Historical Data and Forecast of Indonesia Ion exchange resins Market Revenues & Volume By Pharmaceutical for the Period 2022-2032F
- Historical Data and Forecast of Indonesia Ion exchange resins Market Revenues & Volume By Electrical & Electronics for the Period 2022-2032F
- Historical Data and Forecast of Indonesia Ion exchange resins Market Revenues & Volume By Metal & Mining for the Period 2022-2032F
- Historical Data and Forecast of Indonesia Ion exchange resins Market Revenues & Volume By Others for the Period 2022-2032F
- Indonesia Ion exchange resins Import Export Trade Statistics
- Market Opportunity Assessment By Type
- Market Opportunity Assessment By Application
- Market Opportunity Assessment By End-use Industry
- Indonesia Ion exchange resins Top Companies Market Share
- Indonesia Ion exchange resins Competitive Benchmarking By Technical and Operational Parameters
- Indonesia Ion exchange resins Company Profiles
- Indonesia Ion exchange resins Key Strategic Recommendations
Indonesia Ion exchange resins Market (2026-2032): FAQs
6Wresearch actively monitors the Indonesia Ion exchange resins Market and publishes its comprehensive annual report, highlighting emerging trends, growth drivers, revenue analysis, and forecast outlook. Our insights help businesses to make data-backed strategic decisions with ongoing market dynamics. Our analysts track relevent industries related to the Indonesia Ion exchange resins Market, allowing our clients with actionable intelligence and reliable forecasts tailored to emerging regional needs.
Yes, we provide customisation as per your requirements. To learn more, feel free to contact us on sales@6wresearch.com
1 Executive Summary |
2 Introduction |
2.1 Key Highlights of the Report |
2.2 Report Description |
2.3 Market Scope & Segmentation |
2.4 Research Methodology |
2.5 Assumptions |
3 Indonesia Ion exchange resins Market Overview |
3.1 Indonesia Country Macro Economic Indicators |
3.2 Indonesia Ion exchange resins Market Revenues & Volume, 2022 & 2032F |
3.3 Indonesia Ion exchange resins Market - Industry Life Cycle |
3.4 Indonesia Ion exchange resins Market - Porter's Five Forces |
3.5 Indonesia Ion exchange resins Market Revenues & Volume Share, By Type, 2022 & 2032F |
3.6 Indonesia Ion exchange resins Market Revenues & Volume Share, By Application, 2022 & 2032F |
3.7 Indonesia Ion exchange resins Market Revenues & Volume Share, By End-use Industry, 2022 & 2032F |
4 Indonesia Ion exchange resins Market Dynamics |
4.1 Impact Analysis |
4.2 Market Drivers |
4.2.1 Increasing demand for clean water in Indonesia due to growing population and industrialization |
4.2.2 Stringent environmental regulations driving the adoption of ion exchange resins for water treatment |
4.2.3 Growing awareness about water pollution and the need for effective water treatment solutions |
4.3 Market Restraints |
4.3.1 High initial investment required for setting up ion exchange resin facilities |
4.3.2 Availability of alternative water treatment technologies impacting market growth |
4.3.3 Fluctuating raw material prices affecting production costs |
5 Indonesia Ion exchange resins Market Trends |
6 Indonesia Ion exchange resins Market, By Types |
6.1 Indonesia Ion exchange resins Market, By Type |
6.1.1 Overview and Analysis |
6.1.2 Indonesia Ion exchange resins Market Revenues & Volume, By Type, 2022-2032F |
6.1.3 Indonesia Ion exchange resins Market Revenues & Volume, By Cationic Resins, 2022-2032F |
6.1.4 Indonesia Ion exchange resins Market Revenues & Volume, By Anionic Resins, 2022-2032F |
6.1.5 Indonesia Ion exchange resins Market Revenues & Volume, By Others, 2022-2032F |
6.2 Indonesia Ion exchange resins Market, By Application |
6.2.1 Overview and Analysis |
6.2.2 Indonesia Ion exchange resins Market Revenues & Volume, By Water, 2022-2032F |
6.2.3 Indonesia Ion exchange resins Market Revenues & Volume, By Non-water, 2022-2032F |
6.3 Indonesia Ion exchange resins Market, By End-use Industry |
6.3.1 Overview and Analysis |
6.3.2 Indonesia Ion exchange resins Market Revenues & Volume, By Power, 2022-2032F |
6.3.3 Indonesia Ion exchange resins Market Revenues & Volume, By Chemical & Petrochemical, 2022-2032F |
6.3.4 Indonesia Ion exchange resins Market Revenues & Volume, By Food & Beverage, 2022-2032F |
6.3.5 Indonesia Ion exchange resins Market Revenues & Volume, By Pharmaceutical, 2022-2032F |
6.3.6 Indonesia Ion exchange resins Market Revenues & Volume, By Electrical & Electronics, 2022-2032F |
6.3.7 Indonesia Ion exchange resins Market Revenues & Volume, By Metal & Mining, 2022-2032F |
7 Indonesia Ion exchange resins Market Import-Export Trade Statistics |
7.1 Indonesia Ion exchange resins Market Export to Major Countries |
7.2 Indonesia Ion exchange resins Market Imports from Major Countries |
8 Indonesia Ion exchange resins Market Key Performance Indicators |
8.1 Percentage of industrial wastewater treated using ion exchange resins |
8.2 Adoption rate of ion exchange resins in municipal water treatment plants |
8.3 Number of new applications for ion exchange resins in different industries |
8.4 Efficiency improvement in ion exchange resin technology |
8.5 Number of research and development initiatives focused on enhancing ion exchange resin performance |
9 Indonesia Ion exchange resins Market - Opportunity Assessment |
9.1 Indonesia Ion exchange resins Market Opportunity Assessment, By Type, 2022 & 2032F |
9.2 Indonesia Ion exchange resins Market Opportunity Assessment, By Application, 2022 & 2032F |
9.3 Indonesia Ion exchange resins Market Opportunity Assessment, By End-use Industry, 2022 & 2032F |
10 Indonesia Ion exchange resins Market - Competitive Landscape |
10.1 Indonesia Ion exchange resins Market Revenue Share, By Companies, 2025 |
10.2 Indonesia Ion exchange resins Market Competitive Benchmarking, By Operating and Technical Parameters |
11 Company Profiles |
12 Recommendations |
13 Disclaimer |
Global Go To Market Strategy - 2030
Export potential enables firms to identify high-growth global markets with greater confidence by combining advanced trade intelligence with a structured quantitative methodology. The framework analyzes emerging demand trends and country-level import patterns while integrating macroeconomic and trade datasets such as GDP and population forecasts, bilateral import–export flows, tariff structures, elasticity differentials between developed and developing economies, geographic distance, and import demand projections. Using weighted trade values from 2020–2024 as the base period to project country-to-country export potential for 2030, these inputs are operationalized through calculated drivers such as gravity model parameters, tariff impact factors, and projected GDP per-capita growth. Through an analysis of hidden potentials, demand hotspots, and market conditions that are most favorable to success, this method enables firms to focus on target countries, maximize returns, and global expansion with data, backed by accuracy.
By factoring in the projected importer demand gap that is currently unmet and could be potential opportunity, it identifies the potential for the Exporter (Country) among 190 countries, against the general trade analysis, which identifies the biggest importer or exporter.
To discover high-growth global markets and optimize your business strategy:
Click Here
Pricing
- Single User License$ 1,995
- Department License$ 2,400
- Site License$ 3,120
- Global License$ 3,795

Leadership Perspectives from Industry Events
Search
Thought Leadership and Analyst Meet


Our Clients
6WResearch In News
- India Air Conditioner Market Set for Strong Rebound in 2026 After Weather-Led Correction and GST-Driven Recovery: 6Wresearch
- ADAS in India: How Automatic Emergency Braking, Blind Spot Detection & Driver Monitoring are Transforming Road Safety
- Doha a strategic location for EV manufacturing hub: IPA Qatar
- Demand for luxury TVs surging in the GCC, says Samsung
- Empowering Growth: The Thriving Journey of Bangladesh’s Cable Industry
- Demand for luxury TVs surging in the GCC, says Samsung
Latest Reports
- Nicaragua RPG Gaming Market (2026-2032)
- New Zealand RPG Gaming Market (2026-2032)
- Netherlands RPG Gaming Market (2026-2032)
- Nauru RPG Gaming Market (2026-2032)
- Namibia RPG Gaming Market (2026-2032)
- Mozambique RPG Gaming Market (2026-2032)
- Montenegro RPG Gaming Market (2026-2032)
- Mongolia RPG Gaming Market (2026-2032)
- Monaco RPG Gaming Market (2026-2032)
- Micronesia RPG Gaming Market (2026-2032)
Industry Events and Analyst Meet

EV India Expo 2026

HIMTEX 2026

India Refining Summit 2026

India EV Show 2026

EV tech India Expo 2026
Whitepaper
- Middle East & Africa Commercial Security Market Click here to view more.
- Middle East & Africa Fire Safety Systems & Equipment Market Click here to view more.
- GCC Drone Market Click here to view more.
- Middle East Lighting Fixture Market Click here to view more.
- GCC Physical & Perimeter Security Market Click here to view more.