Indonesia Isophthalic Acid Market (2026-2032) | Competitive, Restraints, Companies, Drivers, Challenges, Industry, Competition, Analysis, Strategy, Opportunities, Supply, Consumer Insights, Segmentation, Segments, Share, Forecast, Investment Trends, Outlook, Demand, Pricing Analysis, Size, Growth, Revenue, Value, Trends, Strategic Insights
Market Forecast By Application (Polyester Resins, Coatings & Paints, PET Production, Plasticizers, Adhesives), By Type (Purified Isophthalic Acid, Technical Grade Isophthalic Acid), By End User (Plastics Industry, Paints & Coatings Industry, Textiles Industry) And Competitive Landscape
| Product Code: ETC12864847 | Publication Date: Apr 2025 | Updated Date: Mar 2026 | Product Type: Market Research Report | |
| Publisher: 6Wresearch | Author: Dhaval Chaurasia | No. of Pages: 65 | No. of Figures: 34 | No. of Tables: 19 |
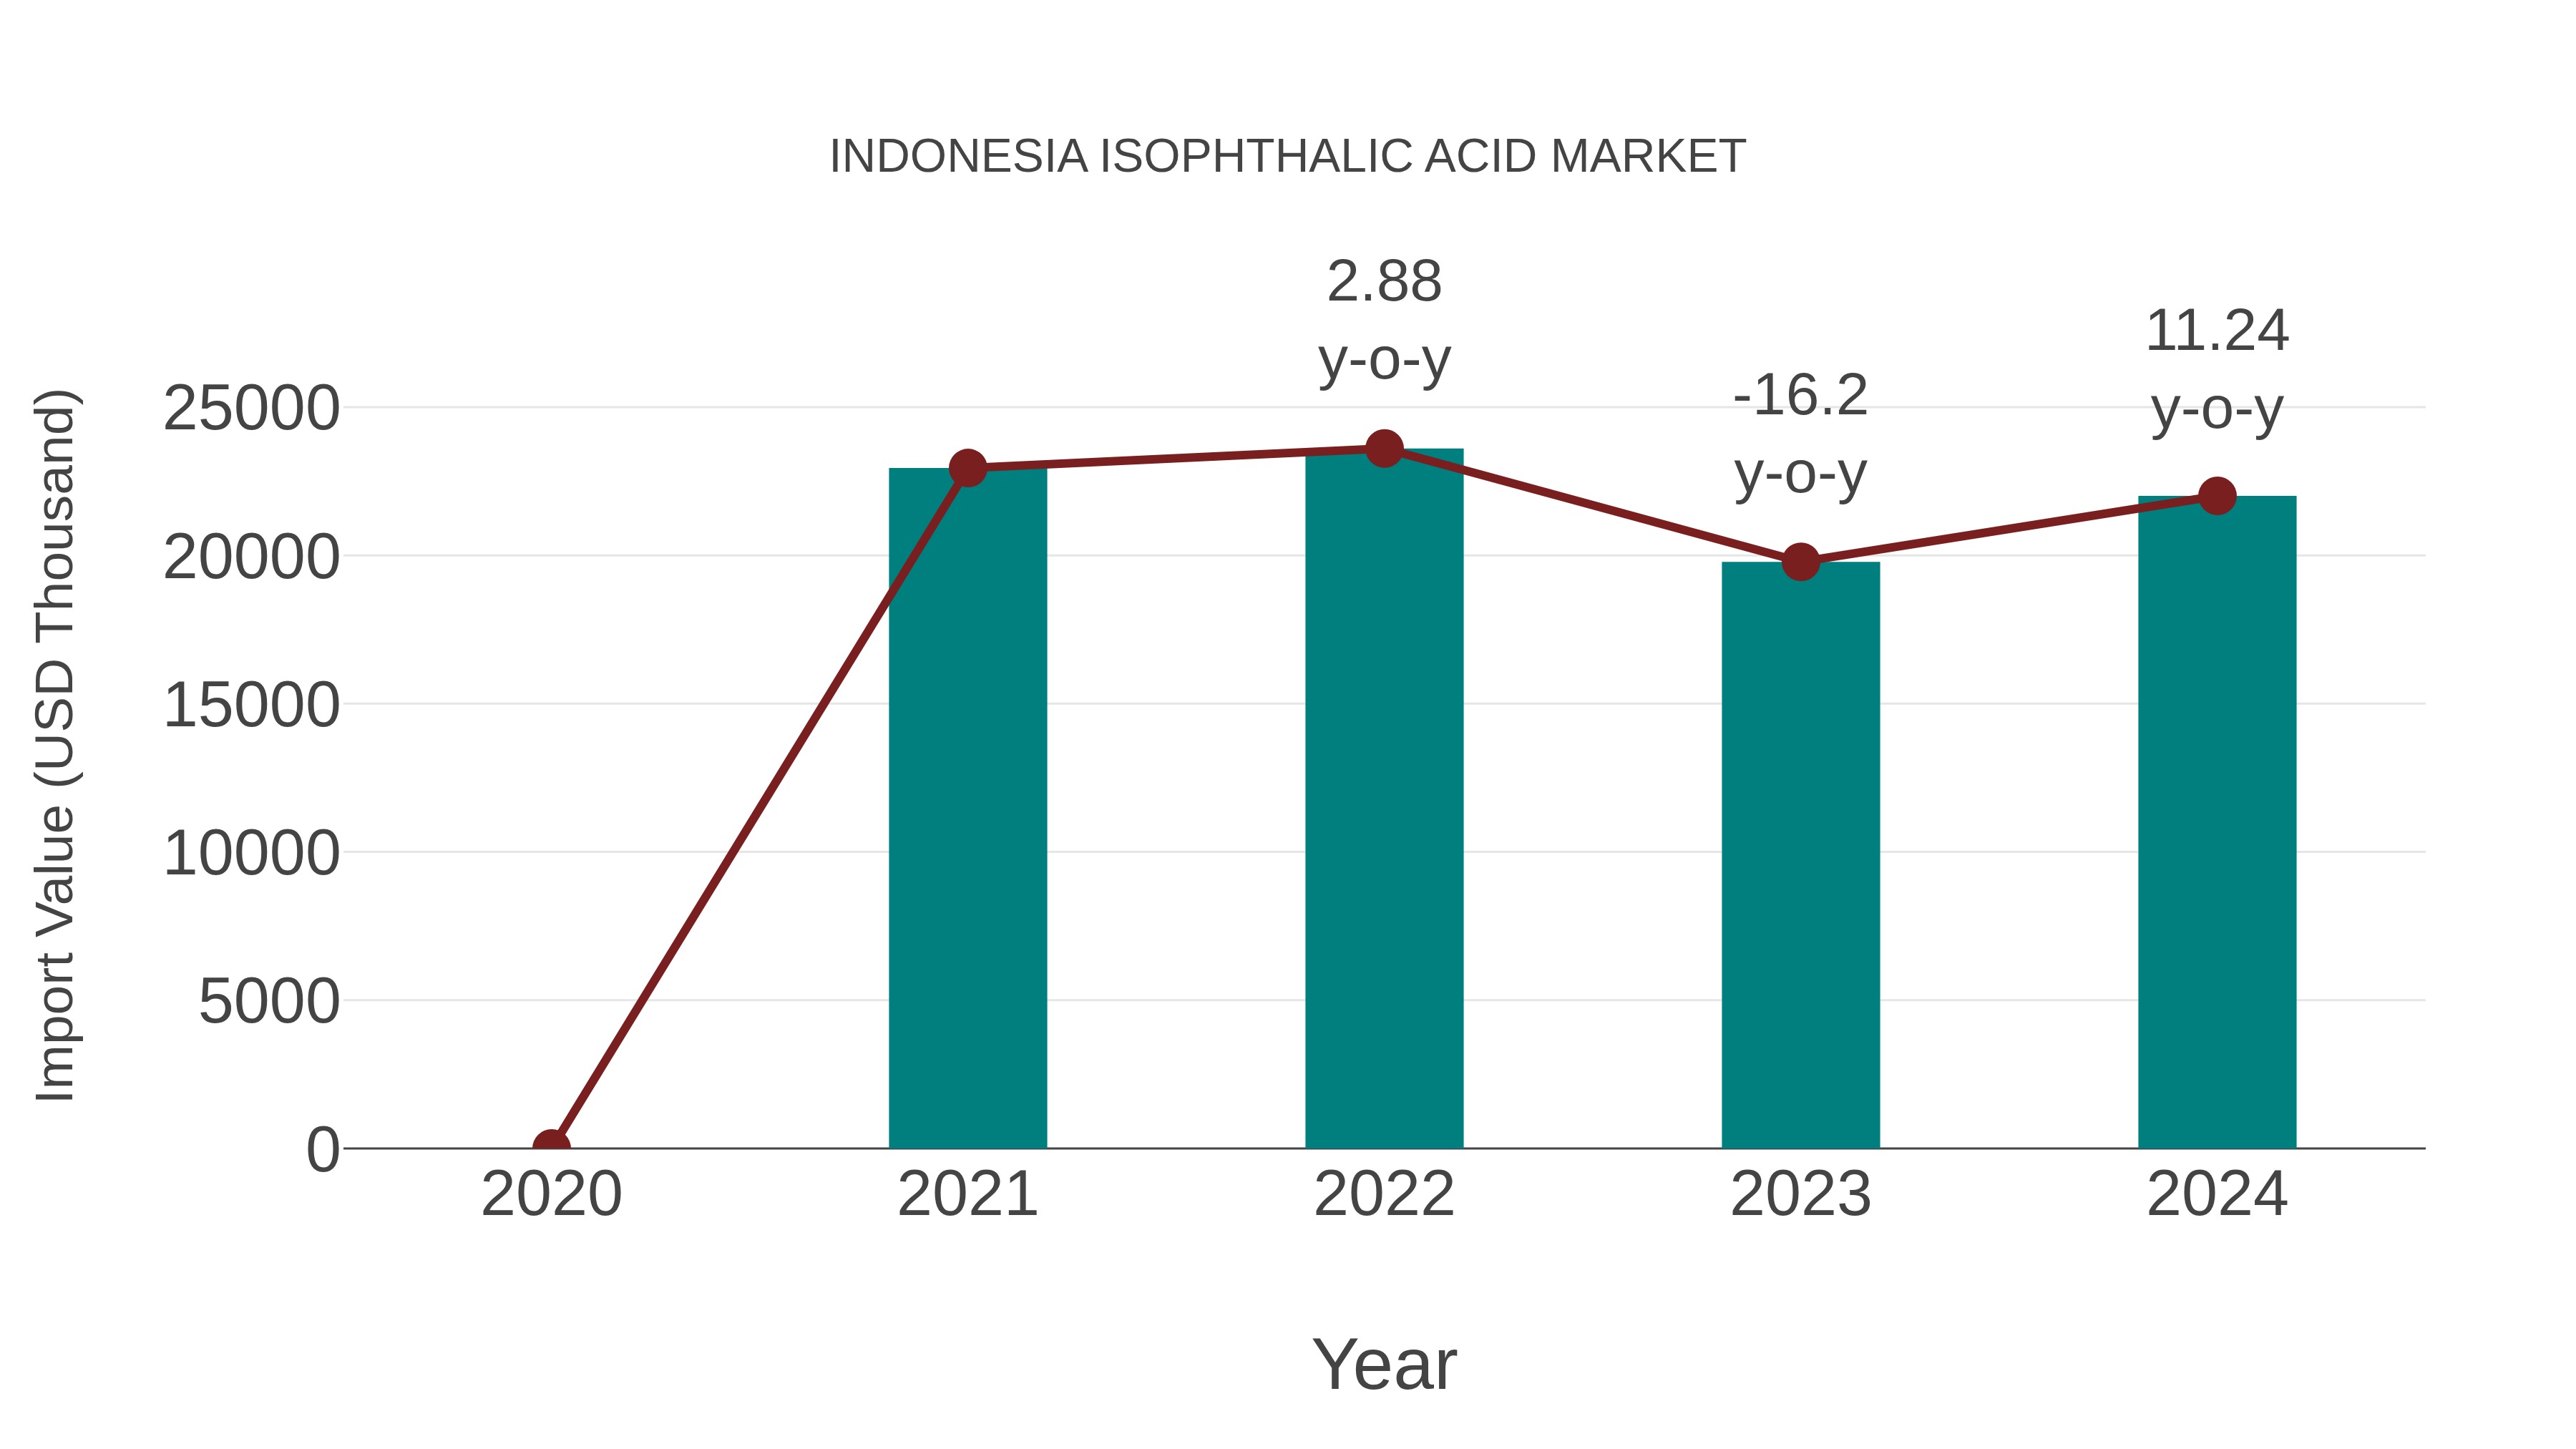
Indonesia Isophthalic Acid Market: Import Trend Analysis
In the Indonesia isophthalic acid market, the import trend exhibited an 11.24% growth rate from 2023 to 2024, contrasting with a -1.38% compound annual growth rate (CAGR) from 2020 to 2024. This fluctuation could be attributed to shifts in demand dynamics or changes in trade policies impacting market stability.
Indonesia Isophthalic Acid Market Overview
The Indonesia isophthalic acid market is experiencing steady growth due to increasing demand from various end-use industries such as automotive, construction, and electronics. Isophthalic acid is widely used in the production of resins and coatings, which are essential in the manufacturing of composites, paints, and adhesives. The market is driven by factors such as the growing construction sector, rising disposable income leading to higher automotive sales, and increasing infrastructure projects in the country. Key players in the Indonesia isophthalic acid market include top manufacturers and suppliers who are focusing on product innovation, expansion of production capacity, and strategic partnerships to gain a competitive edge. However, challenges such as fluctuating raw material prices and environmental regulations may hinder market growth in the near future.
Indonesia Isophthalic Acid Market Trends
The Indonesia isophthalic acid market is witnessing steady growth driven by increasing demand from key end-use industries such as automotive, construction, and electronics. The growing construction sector, particularly in urban areas, is fueling the demand for isophthalic acid in the production of high-performance coatings, adhesives, and composites. Additionally, the automotive industry`s shift towards lightweight materials for enhanced fuel efficiency is further boosting the market for isophthalic acid in the country. Manufacturers are focusing on product innovation and quality enhancements to meet the stringent regulatory standards and increase their market share. Furthermore, the rising awareness regarding sustainable and eco-friendly products is expected to drive the adoption of bio-based isophthalic acid in the Indonesian market in the coming years.
Indonesia Isophthalic Acid Market Challenges
In the Indonesia isophthalic acid market, several challenges are faced including intense competition from domestic and international manufacturers, fluctuating raw material prices, and evolving environmental regulations. Local producers often struggle to compete with lower-cost imports, impacting their market share and profitability. The volatility of raw material prices, particularly for petrochemicals used in isophthalic acid production, poses a risk to manufacturers` margins and overall business stability. Additionally, the tightening environmental regulations in Indonesia require companies to invest in sustainable production practices, adding pressure on operational costs. Navigating these challenges requires strategic planning, innovation in production processes, and a strong focus on cost efficiency to maintain competitiveness in the Indonesia isophthalic acid market.
Indonesia Isophthalic Acid Market Investment Opportunities
The Indonesia isophthalic acid market presents promising investment opportunities due to the country`s growing chemical industry and increasing demand for isophthalic acid in various applications such as coatings, resins, and plastics. With Indonesia`s strategic location in Southeast Asia and its strong economic growth, investing in isophthalic acid production or distribution in the country can be lucrative. Additionally, the government`s focus on infrastructure development and industrialization further supports the potential for growth in the isophthalic acid market. Investors can capitalize on this opportunity by partnering with local manufacturers, exploring export opportunities, or investing in research and development to cater to the evolving needs of the Indonesian market. Overall, the Indonesia isophthalic acid market offers a promising investment landscape for those looking to tap into the country`s expanding chemical sector.
Indonesia Isophthalic Acid Market Government Policy
The government of Indonesia has implemented policies to support the isophthalic acid market, including measures to promote domestic production and reduce reliance on imports. These policies aim to boost the country`s self-sufficiency in isophthalic acid, which is a key ingredient in the production of various products such as coatings, resins, and plastics. The government has also introduced regulations to ensure the quality and safety of isophthalic acid produced in the country, in line with international standards. Additionally, Indonesia has been actively engaging in trade agreements and partnerships to enhance market access for its isophthalic acid products globally. Overall, these policies demonstrate the government`s commitment to developing and strengthening the domestic isophthalic acid industry.
Indonesia Isophthalic Acid Market Future Outlook
The future outlook for the Indonesia isophthalic acid market appears positive, driven by factors such as increasing demand from end-use industries like automotive, construction, and electronics. The country`s growing population and urbanization are expected to further boost consumption of isophthalic acid for applications such as PET resins, coatings, and fibers. Additionally, Indonesia`s focus on infrastructure development and manufacturing activities is likely to create opportunities for market growth. However, challenges such as fluctuating raw material prices and environmental regulations could impact the market dynamics. Overall, with a favorable economic environment and growing industrial sectors, the Indonesia isophthalic acid market is anticipated to experience steady growth in the coming years.
Key Highlights of the Report:
- Indonesia Isophthalic Acid Market Outlook
- Market Size of Indonesia Isophthalic Acid Market,2025
- Forecast of Indonesia Isophthalic Acid Market, 2032
- Historical Data and Forecast of Indonesia Isophthalic Acid Revenues & Volume for the Period 2022-2032F
- Indonesia Isophthalic Acid Market Trend Evolution
- Indonesia Isophthalic Acid Market Drivers and Challenges
- Indonesia Isophthalic Acid Price Trends
- Indonesia Isophthalic Acid Porter's Five Forces
- Indonesia Isophthalic Acid Industry Life Cycle
- Historical Data and Forecast of Indonesia Isophthalic Acid Market Revenues & Volume By Application for the Period 2022-2032F
- Historical Data and Forecast of Indonesia Isophthalic Acid Market Revenues & Volume By Polyester Resins for the Period 2022-2032F
- Historical Data and Forecast of Indonesia Isophthalic Acid Market Revenues & Volume By Coatings & Paints for the Period 2022-2032F
- Historical Data and Forecast of Indonesia Isophthalic Acid Market Revenues & Volume By PET Production for the Period 2022-2032F
- Historical Data and Forecast of Indonesia Isophthalic Acid Market Revenues & Volume By Plasticizers for the Period 2022-2032F
- Historical Data and Forecast of Indonesia Isophthalic Acid Market Revenues & Volume By Adhesives for the Period 2022-2032F
- Historical Data and Forecast of Indonesia Isophthalic Acid Market Revenues & Volume By Type for the Period 2022-2032F
- Historical Data and Forecast of Indonesia Isophthalic Acid Market Revenues & Volume By Purified Isophthalic Acid for the Period 2022-2032F
- Historical Data and Forecast of Indonesia Isophthalic Acid Market Revenues & Volume By Technical Grade Isophthalic Acid for the Period 2022-2032F
- Historical Data and Forecast of Indonesia Isophthalic Acid Market Revenues & Volume By End User for the Period 2022-2032F
- Historical Data and Forecast of Indonesia Isophthalic Acid Market Revenues & Volume By Plastics Industry for the Period 2022-2032F
- Historical Data and Forecast of Indonesia Isophthalic Acid Market Revenues & Volume By Paints & Coatings Industry for the Period 2022-2032F
- Historical Data and Forecast of Indonesia Isophthalic Acid Market Revenues & Volume By Textiles Industry for the Period 2022-2032F
- Indonesia Isophthalic Acid Import Export Trade Statistics
- Market Opportunity Assessment By Application
- Market Opportunity Assessment By Type
- Market Opportunity Assessment By End User
- Indonesia Isophthalic Acid Top Companies Market Share
- Indonesia Isophthalic Acid Competitive Benchmarking By Technical and Operational Parameters
- Indonesia Isophthalic Acid Company Profiles
- Indonesia Isophthalic Acid Key Strategic Recommendations
Indonesia Isophthalic Acid Market (2026-2032): FAQs
6Wresearch actively monitors the Indonesia Isophthalic Acid Market and publishes its comprehensive annual report, highlighting emerging trends, growth drivers, revenue analysis, and forecast outlook. Our insights help businesses to make data-backed strategic decisions with ongoing market dynamics. Our analysts track relevent industries related to the Indonesia Isophthalic Acid Market, allowing our clients with actionable intelligence and reliable forecasts tailored to emerging regional needs.
Yes, we provide customisation as per your requirements. To learn more, feel free to contact us on sales@6wresearch.com
1 Executive Summary |
2 Introduction |
2.1 Key Highlights of the Report |
2.2 Report Description |
2.3 Market Scope & Segmentation |
2.4 Research Methodology |
2.5 Assumptions |
3 Indonesia Isophthalic Acid Market Overview |
3.1 Indonesia Country Macro Economic Indicators |
3.2 Indonesia Isophthalic Acid Market Revenues & Volume, 2022 & 2032F |
3.3 Indonesia Isophthalic Acid Market - Industry Life Cycle |
3.4 Indonesia Isophthalic Acid Market - Porter's Five Forces |
3.5 Indonesia Isophthalic Acid Market Revenues & Volume Share, By Application, 2022 & 2032F |
3.6 Indonesia Isophthalic Acid Market Revenues & Volume Share, By Type, 2022 & 2032F |
3.7 Indonesia Isophthalic Acid Market Revenues & Volume Share, By End User, 2022 & 2032F |
4 Indonesia Isophthalic Acid Market Dynamics |
4.1 Impact Analysis |
4.2 Market Drivers |
4.2.1 Growth in end-use industries such as textiles, packaging, and automotive that use isophthalic acid |
4.2.2 Increasing demand for PET resins, which are a key application of isophthalic acid |
4.2.3 Rising disposable income and changing consumer preferences driving demand for products made using isophthalic acid |
4.3 Market Restraints |
4.3.1 Fluctuating raw material prices affecting production costs |
4.3.2 Stringent environmental regulations impacting production processes and limiting market growth |
4.3.3 Competition from substitutes such as terephthalic acid affecting market share |
5 Indonesia Isophthalic Acid Market Trends |
6 Indonesia Isophthalic Acid Market, By Types |
6.1 Indonesia Isophthalic Acid Market, By Application |
6.1.1 Overview and Analysis |
6.1.2 Indonesia Isophthalic Acid Market Revenues & Volume, By Application, 2022-2032F |
6.1.3 Indonesia Isophthalic Acid Market Revenues & Volume, By Polyester Resins, 2022-2032F |
6.1.4 Indonesia Isophthalic Acid Market Revenues & Volume, By Coatings & Paints, 2022-2032F |
6.1.5 Indonesia Isophthalic Acid Market Revenues & Volume, By PET Production, 2022-2032F |
6.1.6 Indonesia Isophthalic Acid Market Revenues & Volume, By Plasticizers, 2022-2032F |
6.1.7 Indonesia Isophthalic Acid Market Revenues & Volume, By Adhesives, 2022-2032F |
6.2 Indonesia Isophthalic Acid Market, By Type |
6.2.1 Overview and Analysis |
6.2.2 Indonesia Isophthalic Acid Market Revenues & Volume, By Purified Isophthalic Acid, 2022-2032F |
6.2.3 Indonesia Isophthalic Acid Market Revenues & Volume, By Technical Grade Isophthalic Acid, 2022-2032F |
6.3 Indonesia Isophthalic Acid Market, By End User |
6.3.1 Overview and Analysis |
6.3.2 Indonesia Isophthalic Acid Market Revenues & Volume, By Plastics Industry, 2022-2032F |
6.3.3 Indonesia Isophthalic Acid Market Revenues & Volume, By Paints & Coatings Industry, 2022-2032F |
6.3.4 Indonesia Isophthalic Acid Market Revenues & Volume, By Textiles Industry, 2022-2032F |
7 Indonesia Isophthalic Acid Market Import-Export Trade Statistics |
7.1 Indonesia Isophthalic Acid Market Export to Major Countries |
7.2 Indonesia Isophthalic Acid Market Imports from Major Countries |
8 Indonesia Isophthalic Acid Market Key Performance Indicators |
8.1 Capacity utilization rates of isophthalic acid manufacturing facilities |
8.2 Average selling price of isophthalic acid in the market |
8.3 Research and development investment in new applications or technologies for isophthalic acid |
9 Indonesia Isophthalic Acid Market - Opportunity Assessment |
9.1 Indonesia Isophthalic Acid Market Opportunity Assessment, By Application, 2022 & 2032F |
9.2 Indonesia Isophthalic Acid Market Opportunity Assessment, By Type, 2022 & 2032F |
9.3 Indonesia Isophthalic Acid Market Opportunity Assessment, By End User, 2022 & 2032F |
10 Indonesia Isophthalic Acid Market - Competitive Landscape |
10.1 Indonesia Isophthalic Acid Market Revenue Share, By Companies, 2025 |
10.2 Indonesia Isophthalic Acid Market Competitive Benchmarking, By Operating and Technical Parameters |
11 Company Profiles |
12 Recommendations |
13 Disclaimer |
Global Go To Market Strategy - 2030
Export potential enables firms to identify high-growth global markets with greater confidence by combining advanced trade intelligence with a structured quantitative methodology. The framework analyzes emerging demand trends and country-level import patterns while integrating macroeconomic and trade datasets such as GDP and population forecasts, bilateral import–export flows, tariff structures, elasticity differentials between developed and developing economies, geographic distance, and import demand projections. Using weighted trade values from 2020–2024 as the base period to project country-to-country export potential for 2030, these inputs are operationalized through calculated drivers such as gravity model parameters, tariff impact factors, and projected GDP per-capita growth. Through an analysis of hidden potentials, demand hotspots, and market conditions that are most favorable to success, this method enables firms to focus on target countries, maximize returns, and global expansion with data, backed by accuracy.
By factoring in the projected importer demand gap that is currently unmet and could be potential opportunity, it identifies the potential for the Exporter (Country) among 190 countries, against the general trade analysis, which identifies the biggest importer or exporter.
To discover high-growth global markets and optimize your business strategy:
Click Here
Pricing
- Single User License$ 1,995
- Department License$ 2,400
- Site License$ 3,120
- Global License$ 3,795

Leadership Perspectives from Industry Events
Search
Thought Leadership and Analyst Meet


Our Clients
6WResearch In News
- Doha a strategic location for EV manufacturing hub: IPA Qatar
- Demand for luxury TVs surging in the GCC, says Samsung
- Empowering Growth: The Thriving Journey of Bangladesh’s Cable Industry
- Demand for luxury TVs surging in the GCC, says Samsung
- Video call with a traditional healer? Once unthinkable, it’s now common in South Africa
- Intelligent Buildings To Smooth GCC’s Path To Net Zero
Latest Reports
- New Zealand Aseptic Manufacturing Market (2026-2032)
- Netherlands Aseptic Manufacturing Market (2026-2032)
- Nauru Aseptic Manufacturing Market (2026-2032)
- Namibia Aseptic Manufacturing Market (2026-2032)
- Mozambique Aseptic Manufacturing Market (2026-2032)
- Montenegro Aseptic Manufacturing Market (2026-2032)
- Mongolia Aseptic Manufacturing Market (2026-2032)
- Monaco Aseptic Manufacturing Market (2026-2032)
- Micronesia Aseptic Manufacturing Market (2026-2032)
- Mauritius Aseptic Manufacturing Market (2026-2032)
Industry Events and Analyst Meet

HIMTEX 2026

India Refining Summit 2026

India EV Show 2026

EV tech India Expo 2026

Auto Tech Asia 2026
Whitepaper
- Middle East & Africa Commercial Security Market Click here to view more.
- Middle East & Africa Fire Safety Systems & Equipment Market Click here to view more.
- GCC Drone Market Click here to view more.
- Middle East Lighting Fixture Market Click here to view more.
- GCC Physical & Perimeter Security Market Click here to view more.