Indonesia Mica Powder Market (2026-2032) Outlook | Share, Revenue, Industry, Size, Value, Analysis, Growth, Companies, Trends & Forecast
Market Forecast By Type (Wet Ground, Dry Ground), By Application (Plastic, Automotive, Others) And Competitive Landscape
| Product Code: ETC099887 | Publication Date: Jul 2023 | Updated Date: Jun 2026 | Product Type: Report | |
| Publisher: 6Wresearch | Author: Ravi Bhandari | No. of Pages: 70 | No. of Figures: 35 | No. of Tables: 5 |
Indonesia Mica Powder Market Size, Share & Growth Rate
The Indonesia Mica Powder Market was estimated at USD 160 Million in 2025 and is projected to reach USD 209 Million by 2032, growing at a CAGR of 3.9% from 2026 to 2032. This growth trajectory is largely driven by the increasing applications of mica powder in multiple industries such as cosmetics, automotive, and construction. Additionally, rising investments from foreign companies, particularly from China, are bolstering local production capabilities, thereby enhancing market competitiveness.
Indonesia Mica Powder Market Growth Rate Analysis (2021-2032)
The Indonesian mica powder market has shown resilience and steady growth after a challenging 2021, which saw a decline of 1.0%. This was followed by a rebound with a 4.4% increase in 2022, driven by rising demand across various industries such as cosmetics and electronics, where natural minerals are increasingly favored. Growth accelerated with a 5.3% rise in 2023, fueled by heightened consumer demand and investments in sustainable sourcing methods. Looking ahead, the market is projected to maintain an upward momentum, with annual growth rates hovering around 5% through 2032. This trend is supported by technological advancements, improved infrastructure, and a growing emphasis on environmentally friendly practices in production.
Indonesia Mica Powder Market Year-wise Growth Rate and Key Drivers
This graph highlights how the Indonesia Mica Powder Market has steadily grown over the past five years, supported by major growth factors.
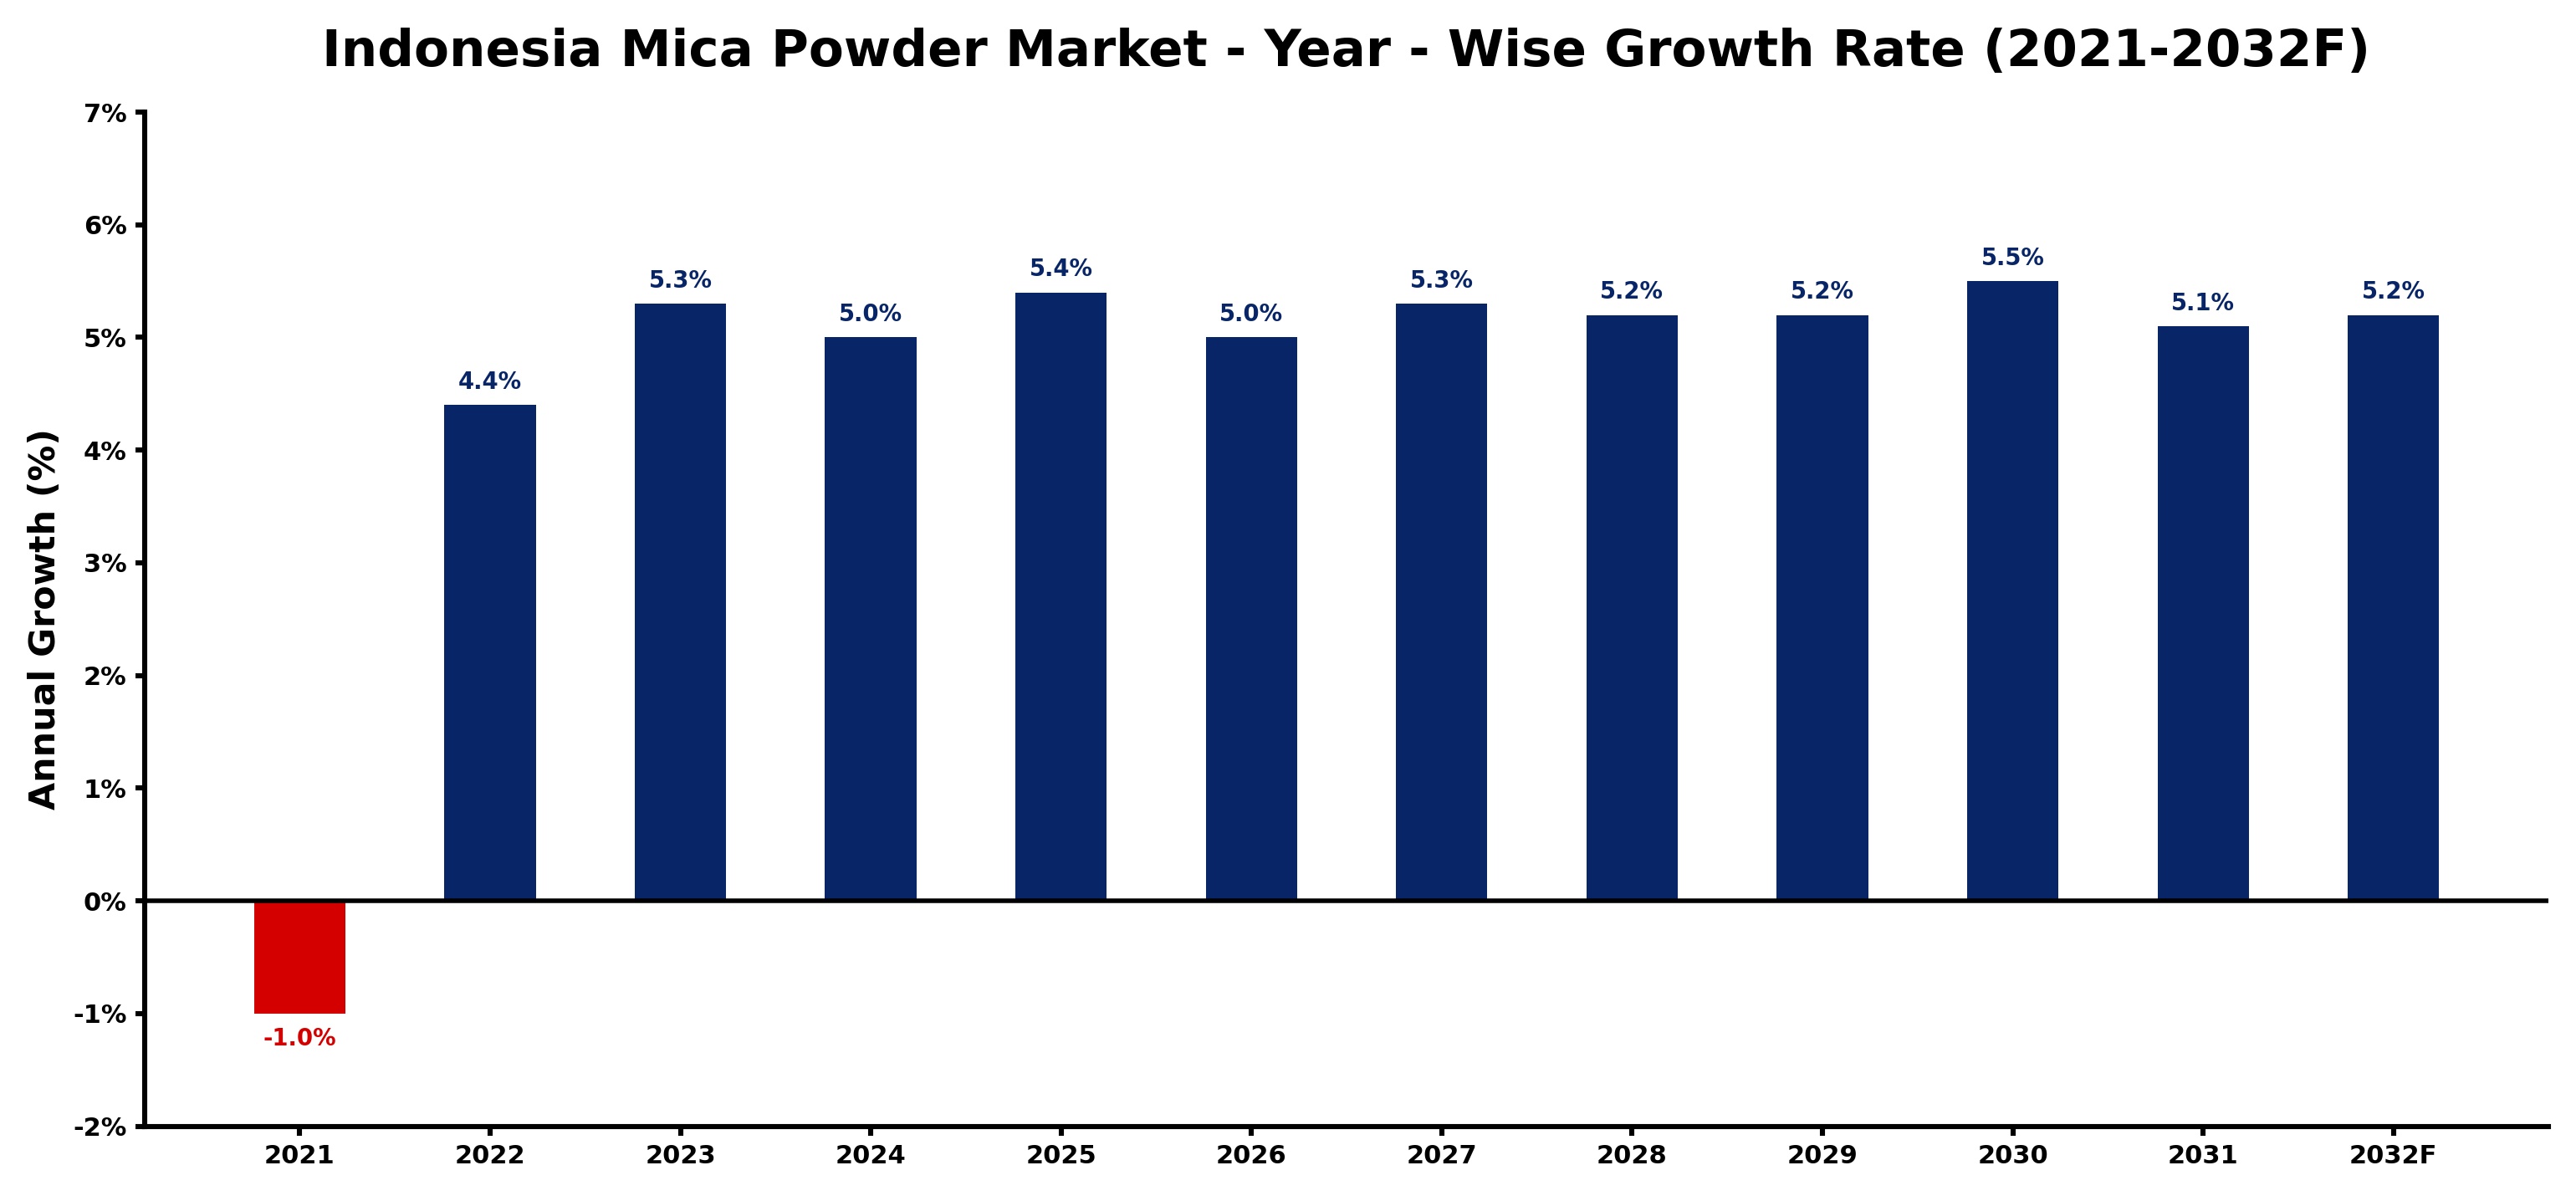
The table below presents the year‑wise growth rates along with the key drivers influencing the market
| Year | Growth Rate | Major Drivers |
| 2021 | -1.0% | Slower automotive production led to decreased mica powder demand |
| 2022 | 4.4% | Local automotive manufacturing growth boosts mica powder consumption trends |
| 2023 | 5.3% | Accelerated investments in mica processing facilities boost local supply capacity |
| 2024 | 5.0% | Export driven technology integration boosts mica powder processing efficiency |
| 2025 | 5.4% | Export driven automotive manufacturing growth boosted mica powder demand |
| 2026 | 5.0% | OEM investments in domestic vehicle production boost mica powder demand |
| 2027 | 5.3% | Domestic vehicle assembly expansion drives demand for high quality mica powder |
| 2028 | 5.2% | Mica powder demand surged with local electric vehicle production ramp up |
| 2029 | 5.2% | Technology integration in manufacturing boosts mica powder production efficiency |
| 2030 | 5.5% | Manufacturing investments boosted local mica powder processing capabilities |
| 2031 | 5.1% | Increased automotive assembly lines drive mica powder demand growth |
| 2032 | 5.2% | Manufacturing investments in mica powder production boost domestic supply chains |
Note - Market size estimations and growth projections presented in this report are based on 6Wresearch’s advanced forecasting approach, validated with industry datasets as of June 2026.
Indonesia Mica Powder Market Synopsis
Mica powder is vital for various applications due to its unique physical properties, including its reflective and heat-resistant qualities. This makes it an essential component not only in cosmetics and paints but also in automotive parts and electronics, underpinning its steady demand in Indonesia.
Moreover, the primary production centers in East Java and West Sumatra benefit from rich deposits, ensuring a steady supply chain for local and international customers. As Indonesian suppliers increasingly meet international quality standards, the potential for growth in export markets is becoming more significant.
Indonesia Mica Powder Market Key Takeaways
- Growing demand across automotive, construction, and electronics sectors is driving market expansion.
- Indonesia ranks as the fourth largest producer globally, following China, India, and Japan.
- Foreign investments, particularly from Chinese firms, are enhancing local production and competitiveness.
- Challenges related to infrastructure and standardization impact supply chain reliability.
- COVID-19 pandemic effects have temporarily disrupted demand and supply dynamics.
Evaluation of Restraints in Indonesia Mica Powder Market
Despite its potential, the Indonesia Mica Powder Market faces significant constraints primarily due to a lack of consistent quality standards and regulatory frameworks. This results in unreliable supply chain networks and pricing inconsistencies across regions. Furthermore, inadequate infrastructure in some areas complicates logistics, affecting timely deliveries. The market's largely unregulated nature further poses risks to small businesses, limiting their access to high-quality raw materials and reliable partnerships with larger entities.
Indonesia Mica Powder Market Trends
One prevailing trend is the increasing emphasis on sustainability within the production process. Local suppliers are gradually adopting eco-friendly practices to enhance their appeal, particularly in export markets where environmental standards are stringent. Moreover, innovations in manufacturing techniques are driving the development of higher purity mica powders, further expanding their applicability across various industries, such as cosmetics and advanced materials.
Indonesia Mica Powder Market Opportunities
Significant growth opportunities lie in expanding the market for high-quality mica powder in advanced applications such as electronics and specialized coatings. The increasing demand for decorative and functional coatings in the construction industry presents a lucrative avenue for growth. Additionally, as international companies seek to diversify their supply chains, Indonesia's rich mica deposits position it favorably for increased export opportunities.
Government Initiatives in the Indonesia Mica Powder Market
The Indonesian government has implemented several initiatives to enhance the mining sector, including the mica industry. Policies promoting foreign investments and regulatory reforms aim to attract more players into the market. Additionally, there are ongoing discussions around improving infrastructure, which is crucial for easing logistics challenges. Support programs for local suppliers focusing on quality certification and standards compliance are also underway, aiming to boost competitiveness in the global market.
Future Insights of the Indonesia Mica Powder Market
Looking ahead, the Indonesia Mica Powder Market is poised for steady growth, driven by rising global demand and the increasing versatility of mica applications. As more local suppliers align with international quality standards, their competitiveness is expected to enhance, making Indonesia a key player in the global mica powder supply chain. Technological advancements and sustainable production practices will further shape the market landscape over the coming years.
Indonesia Mica Powder Market Latest Developments (May 2025 - June 2026)
Recent developments in the Indonesia Mica Powder Market indicate a heightened focus on quality control and sustainable practices. More companies are pursuing international certifications to align with global standards, fostering greater trust among international buyers. Additionally, investments aimed at improving infrastructure for mining and distribution are being prioritized, which is expected to streamline operations and improve delivery times.
Indonesia Mica Powder Market - Key Attractiveness of the Report
- 10 Years of Market Numbers
- Historical Data Starting from 2022 to 2025
- Base Year: 2025
- Forecast Data until 2032
- Key Performance Indicators Impacting the Market
- Major Upcoming Developments and Projects
Key Highlights of the Report:
- Indonesia Mica Powder Market Outlook
- Market Size of Indonesia Mica Powder Market, 2025
- Forecast of Indonesia Mica Powder Market, 2032
- Historical Data and Forecast of Indonesia Mica Powder Revenues & Volume for the Period 2022-2032F
- Indonesia Mica Powder Market Trend Evolution
- Indonesia Mica Powder Market Drivers and Challenges
- Indonesia Mica Powder Price Trends
- Indonesia Mica Powder Porter's Five Forces
- Indonesia Mica Powder Industry Life Cycle
- Historical Data and Forecast of Indonesia Mica Powder Market Revenues & Volume By Type for the Period 2022-2032F
- Historical Data and Forecast of Indonesia Mica Powder Market Revenues & Volume By Wet Ground for the Period 2022-2032F
- Historical Data and Forecast of Indonesia Mica Powder Market Revenues & Volume By Dry Ground for the Period 2022-2032F
- Historical Data and Forecast of Indonesia Mica Powder Market Revenues & Volume By Application for the Period 2022-2032F
- Historical Data and Forecast of Indonesia Mica Powder Market Revenues & Volume By Plastic for the Period 2022-2032F
- Historical Data and Forecast of Indonesia Mica Powder Market Revenues & Volume By Automotive for the Period 2022-2032F
- Historical Data and Forecast of Indonesia Mica Powder Market Revenues & Volume By Others for the Period 2022-2032F
- Indonesia Mica Powder Import Export Trade Statistics
- Market Opportunity Assessment By Type
- Market Opportunity Assessment By Application
- Indonesia Mica Powder Top Companies Market Share
- Indonesia Mica Powder Competitive Benchmarking By Technical and Operational Parameters
- Indonesia Mica Powder Company Profiles
- Indonesia Mica Powder Key Strategic Recommendations
Indonesia Mica Powder Market - Frequently Asked Questions
The Indonesia Mica Powder Market was estimated at USD 160 Million in 2025 and is projected to reach USD 209 Million by 2032, growing at a CAGR of 3.9% from 2026 to 2032.
The primary consumers of mica powder include the cosmetics, automotive, construction, and electronics sectors, showcasing the mineral's versatility.
The Indonesian government is promoting foreign investments and implementing regulatory reforms while improving infrastructure to support the mica powder market's growth and competitiveness.
Suppliers face challenges such as inconsistent pricing, lack of quality standards, and logistical issues due to inadequate infrastructure, which complicates operations.
The demand for mica powder is projected to grow steadily due to its expanding applications across various industries, supported by technological advancements and a focus on sustainability.
6Wresearch actively monitors the Indonesia Mica Powder Market and publishes its comprehensive annual report, highlighting emerging trends, growth drivers, revenue analysis, and forecast outlook. Our insights help businesses to make data-backed strategic decisions with ongoing market dynamics. Our analysts track relevent industries related to the Indonesia Mica Powder Market, allowing our clients with actionable intelligence and reliable forecasts tailored to emerging regional needs.
Yes, we provide customisation as per your requirements. To learn more, feel free to contact us on sales@6wresearch.com
1 Executive Summary |
2 Introduction |
2.1 Key Highlights of the Report |
2.2 Report Description |
2.3 Market Scope & Segmentation |
2.4 Research Methodology |
2.5 Assumptions |
3 Indonesia Mica Powder Market Overview |
3.1 Indonesia Country Macro Economic Indicators |
3.2 Indonesia Mica Powder Market Revenues & Volume, 2022 & 2032F |
3.3 Indonesia Mica Powder Market - Industry Life Cycle |
3.4 Indonesia Mica Powder Market - Porter's Five Forces |
3.5 Indonesia Mica Powder Market Revenues & Volume Share, By Type, 2022 & 2032F |
3.6 Indonesia Mica Powder Market Revenues & Volume Share, By Application, 2022 & 2032F |
4 Indonesia Mica Powder Market Dynamics |
4.1 Impact Analysis |
4.2 Market Drivers |
4.2.1 Growing demand for mica powder in the cosmetics industry for products such as eye shadow, lipsticks, and foundation. |
4.2.2 Increasing use of mica powder in the automotive sector for applications like coatings and paints. |
4.2.3 Rising awareness about the benefits of mica powder in the construction industry for enhancing durability and aesthetics. |
4.3 Market Restraints |
4.3.1 Fluctuating prices of raw materials used in mica powder production impacting overall production costs. |
4.3.2 Stringent regulations related to mica mining and processing leading to supply chain disruptions. |
4.3.3 Competition from alternative products like synthetic mica affecting market penetration. |
5 Indonesia Mica Powder Market Trends |
6 Indonesia Mica Powder Market, By Types |
6.1 Indonesia Mica Powder Market, By Type |
6.1.1 Overview and Analysis |
6.1.2 Indonesia Mica Powder Market Revenues & Volume, By Type, 2022-2032F |
6.1.3 Indonesia Mica Powder Market Revenues & Volume, By Wet Ground, 2022-2032F |
6.1.4 Indonesia Mica Powder Market Revenues & Volume, By Dry Ground, 2022-2032F |
6.2 Indonesia Mica Powder Market, By Application |
6.2.1 Overview and Analysis |
6.2.2 Indonesia Mica Powder Market Revenues & Volume, By Plastic, 2022-2032F |
6.2.3 Indonesia Mica Powder Market Revenues & Volume, By Automotive, 2022-2032F |
6.2.4 Indonesia Mica Powder Market Revenues & Volume, By Others, 2022-2032F |
7 Indonesia Mica Powder Market Import-Export Trade Statistics |
7.1 Indonesia Mica Powder Market Export to Major Countries |
7.2 Indonesia Mica Powder Market Imports from Major Countries |
8 Indonesia Mica Powder Market Key Performance Indicators |
8.1 Average selling price of mica powder in Indonesia. |
8.2 Percentage of mica powder used in new product formulations by cosmetics manufacturers. |
8.3 Number of new construction projects incorporating mica powder in architectural designs. |
9 Indonesia Mica Powder Market - Opportunity Assessment |
9.1 Indonesia Mica Powder Market Opportunity Assessment, By Type, 2022 & 2032F |
9.2 Indonesia Mica Powder Market Opportunity Assessment, By Application, 2022 & 2032F |
10 Indonesia Mica Powder Market - Competitive Landscape |
10.1 Indonesia Mica Powder Market Revenue Share, By Companies, 2025 |
10.2 Indonesia Mica Powder Market Competitive Benchmarking, By Operating and Technical Parameters |
11 Company Profiles |
12 Recommendations |
13 Disclaimer |
Global Go To Market Strategy - 2030
Export potential enables firms to identify high-growth global markets with greater confidence by combining advanced trade intelligence with a structured quantitative methodology. The framework analyzes emerging demand trends and country-level import patterns while integrating macroeconomic and trade datasets such as GDP and population forecasts, bilateral import–export flows, tariff structures, elasticity differentials between developed and developing economies, geographic distance, and import demand projections. Using weighted trade values from 2020–2024 as the base period to project country-to-country export potential for 2030, these inputs are operationalized through calculated drivers such as gravity model parameters, tariff impact factors, and projected GDP per-capita growth. Through an analysis of hidden potentials, demand hotspots, and market conditions that are most favorable to success, this method enables firms to focus on target countries, maximize returns, and global expansion with data, backed by accuracy.
By factoring in the projected importer demand gap that is currently unmet and could be potential opportunity, it identifies the potential for the Exporter (Country) among 190 countries, against the general trade analysis, which identifies the biggest importer or exporter.
To discover high-growth global markets and optimize your business strategy:
Click Here
Pricing
- Single User License$ 1,995
- Department License$ 2,400
- Site License$ 3,120
- Global License$ 3,795

Leadership Perspectives from Industry Events
Search
Thought Leadership and Analyst Meet


Our Clients
6WResearch In News
- India Air Conditioner Market Set for Strong Rebound in 2026 After Weather-Led Correction and GST-Driven Recovery: 6Wresearch
- ADAS in India: How Automatic Emergency Braking, Blind Spot Detection & Driver Monitoring are Transforming Road Safety
- Doha a strategic location for EV manufacturing hub: IPA Qatar
- Demand for luxury TVs surging in the GCC, says Samsung
- Empowering Growth: The Thriving Journey of Bangladesh’s Cable Industry
- Demand for luxury TVs surging in the GCC, says Samsung
Latest Reports
- Nicaragua RPG Gaming Market (2026-2032)
- New Zealand RPG Gaming Market (2026-2032)
- Netherlands RPG Gaming Market (2026-2032)
- Nauru RPG Gaming Market (2026-2032)
- Namibia RPG Gaming Market (2026-2032)
- Mozambique RPG Gaming Market (2026-2032)
- Montenegro RPG Gaming Market (2026-2032)
- Mongolia RPG Gaming Market (2026-2032)
- Monaco RPG Gaming Market (2026-2032)
- Micronesia RPG Gaming Market (2026-2032)
Industry Events and Analyst Meet

EV India Expo 2026

HIMTEX 2026

India Refining Summit 2026

India EV Show 2026

EV tech India Expo 2026
Whitepaper
- Middle East & Africa Commercial Security Market Click here to view more.
- Middle East & Africa Fire Safety Systems & Equipment Market Click here to view more.
- GCC Drone Market Click here to view more.
- Middle East Lighting Fixture Market Click here to view more.
- GCC Physical & Perimeter Security Market Click here to view more.