Indonesia Mineral Products Market (2026-2032) Outlook | Trends, Revenue, Value, Analysis, Companies, Size, Forecast, Share, Growth & Industry
Market Forecast By Types (Cement and Concrete Product, Glass and Glass Product, Other Non-Metallic Mineral Product, Clay Product and Refractory, Lime and Gypsum Product), By Applications (Architecture, Industry, Manufacture, Others) And Competitive Landscape
| Product Code: ETC275188 | Publication Date: Aug 2023 | Updated Date: Jul 2026 | Product Type: Market Research Report | |
| Publisher: 6Wresearch | Author: Ravi Bhandari | No. of Pages: 75 | No. of Figures: 35 | No. of Tables: 20 |
Indonesia Mineral Products Market Size, Share & Growth Rate
The Indonesia Mineral Products Market was estimated at USD 357 Million in 2025 and is projected to reach USD 470 Million by 2032, growing at a CAGR of 4.0% from 2026 to 2032. This positive trajectory is primarily fueled by the ongoing urbanization and industrialization within the country, resulting in heightened demand for mineral products, especially in the construction and manufacturing sectors. Additionally, increased investment in infrastructure projects is expected to further solidify this growth, attracting both domestic and foreign investments.
Indonesia Mineral Products Market Year-wise Growth Rate and Key Drivers
This graph highlights how the Indonesia Mineral Products Market has steadily grown over the years, supported by major growth factors.
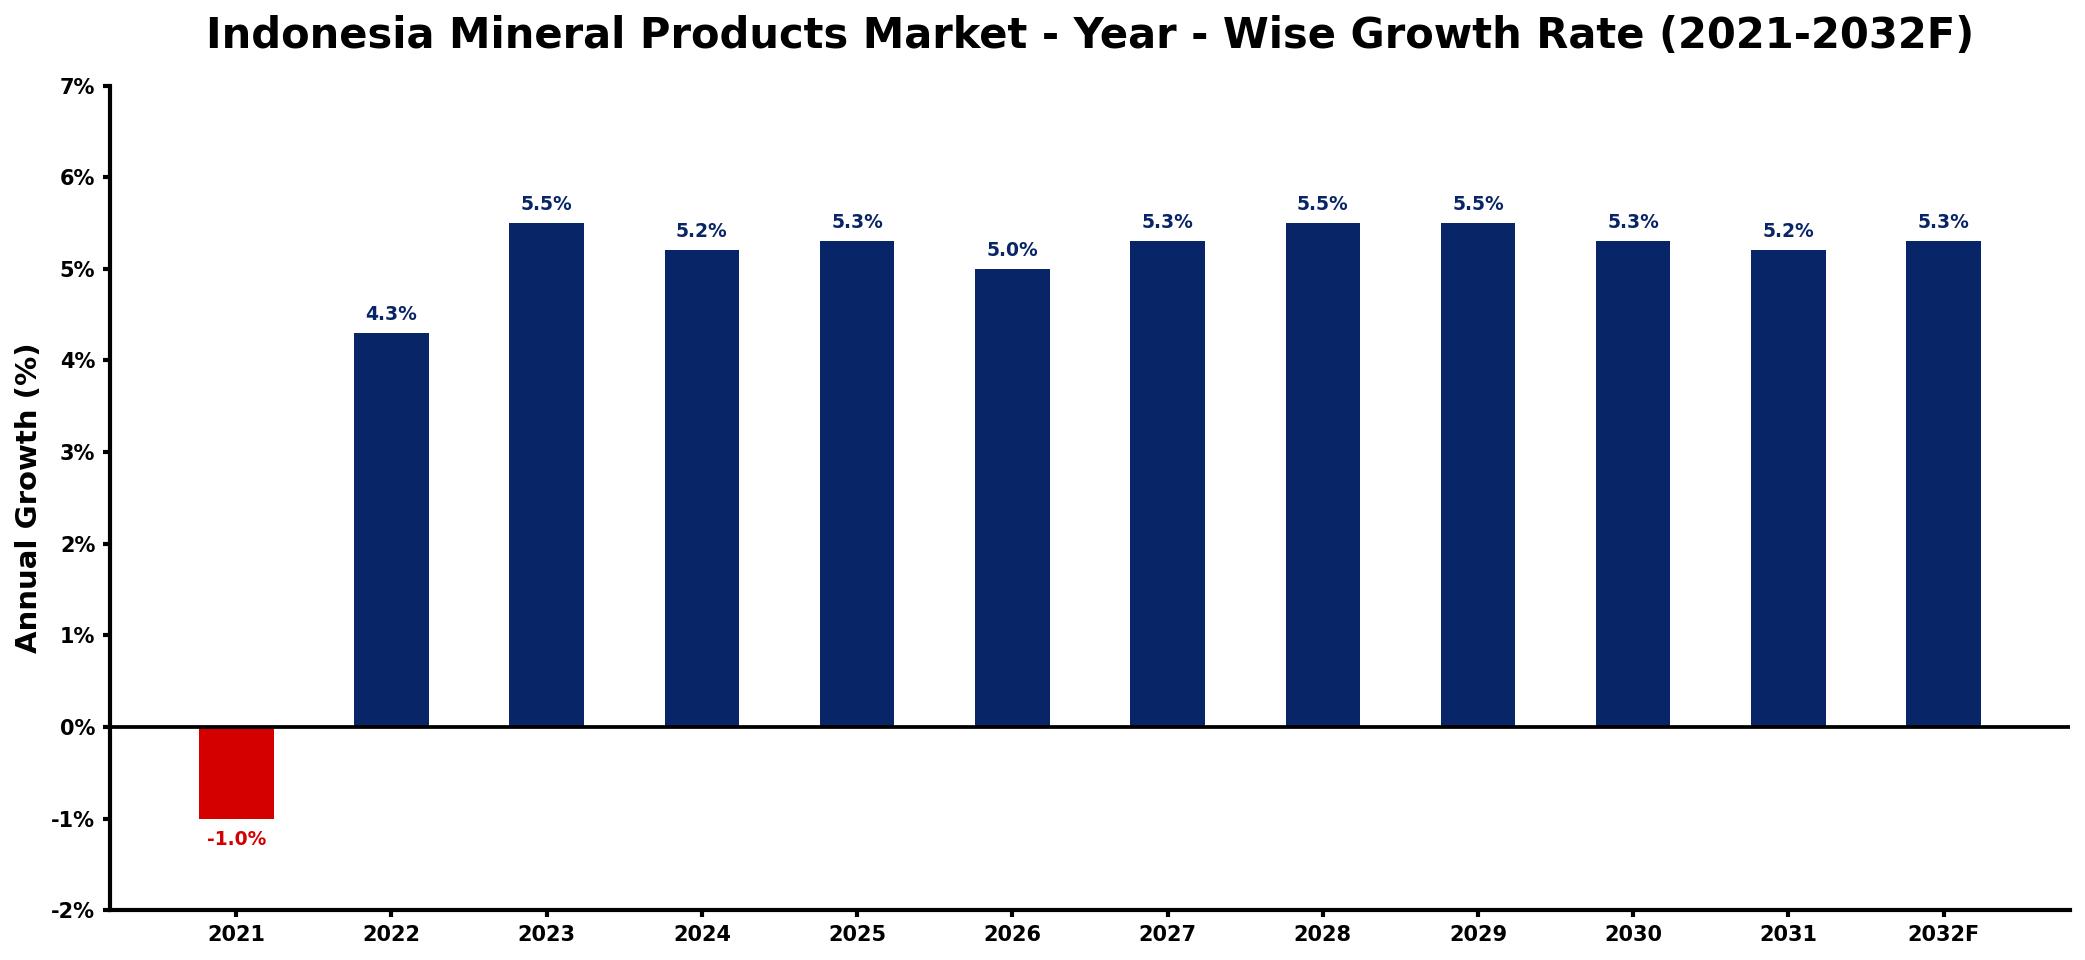
The table below presents the year‑wise growth rates along with the key drivers influencing the market
| Year | Growth Rate | Major Drivers |
| 2021 | -1.0% | decrease in construction projects |
| 2022 | 4.3% | rise in infrastructure investments |
| 2023 | 5.5% | expansion of renewable energy initiatives |
| 2024 | 5.2% | increased demand for electric vehicles |
| 2025 | 5.3% | growth in construction sector activities |
| 2026 | 5.0% | emergence of new mining technologies |
| 2027 | 5.3% | surge in global market demand |
| 2028 | 5.5% | increased overall sector activity |
| 2029 | 5.5% | increased pharmaceutical industry usage |
| 2030 | 5.3% | increased investment in sustainability |
| 2031 | 5.2% | development of new mining regulations |
| 2032 | 5.3% | enhanced supply chain efficiencies |
Note: Market size estimations and growth projections presented in this report are based on 6Wresearch's proprietary forecasting methodology, utilizing the latest available industry data, government publications, and primary research inputs.
Indonesia Mineral Products Market Synopsis
The driving force behind the Indonesia Mineral Products Market is the substantial investment in infrastructure development. Public and private sector players are investing heavily to expand facilities related to mining and metallurgy, which is crucial for meeting the growing demand for mineral-based products.
Consumer confidence is on the rise due to increasing disposable incomes and expenditure on building materials, which has fostered a favorable environment for products such as granite, marble, and sandstone. This demand is further buoyed by strong international trade, particularly with neighboring Asian countries.
Indonesia Mineral Products Market Key Takeaways
- Robust demand for mineral products is driven by urbanization and industrial expansion in Indonesia.
- Investment in infrastructure projects continues to surge, enhancing market growth prospects.
- Export dynamics are shifting positively, with notable gains in shipments to Asian neighbors.
- Consumer spending on building materials has increased, reflecting higher confidence in the economy.
- Growing concerns over environmental impacts are shaping operational practices within the industry.
Evaluation of Restraints in Indonesia Mineral Products Market
Despite the favorable growth trajectory, the Indonesia Mineral Products Market faces several constraints. One significant challenge is the need to optimize mineral extraction processes to minimize environmental impact and energy consumption. Moreover, the industry grapples with increasing scrutiny regarding responsible sourcing and ethical mining practices. Meeting international standards and regulations is becoming crucial for competitiveness, requiring companies to adapt or risk losing market share. These restraints necessitate a strategic focus on sustainable practices and compliance to maintain growth momentum.
Indonesia Mineral Products Market Trends
Current trends indicate a surge in demand for environmentally sustainable mineral products, as consumers become more conscious of their impact on the planet. Innovations in mining technologies are also emerging, aimed at improving efficiency and reducing waste. Furthermore, an increasing preference for high-quality, durable building materials reflects a shift in consumer preferences towards premium mineral products.
Indonesia Mineral Products Market Opportunities
Opportunities for growth within the Indonesia Mineral Products Market are abundant, particularly in the export sector. As neighboring countries demand higher-quality mineral products, Indonesia's rich natural resources present a lucrative avenue for trade expansion. Furthermore, investment in research and development can foster innovations that align with sustainability trends, creating a competitive edge for companies willing to adapt.
Government Initiatives in the Indonesia Mineral Products Market
The Indonesian government has been actively promoting initiatives to bolster the mineral products market, focusing on sustainable practices and responsible mining. Policies aimed at enhancing infrastructure and attracting investments are being implemented, along with programs that encourage technological innovation in mineral extraction. Such government support is crucial for ensuring that the industry aligns with both domestic needs and global standards.
Future Insights of the Indonesia Mineral Products Market
Looking ahead to 2026-2032, the Indonesia Mineral Products Market is poised for steady growth. The continuous urbanization and industrial activities will maintain demand for various mineral products. With a stronger focus on sustainability, companies will likely invest in more efficient and environmentally friendly practices, ensuring their compliance with international norms. The evolving global trade landscape will also present new opportunities, particularly as Asian markets continue to seek high-quality minerals.
Indonesia Mineral Products Market Latest Developments (2025 - 2026)
Recent developments in the Indonesia Mineral Products Market indicate a proactive shift towards sustainability and ethical mining practices. Companies are increasingly adopting advanced technologies to enhance extraction processes while minimizing environmental footprints. Additionally, there is a notable increase in collaborations between public and private sectors aimed at infrastructure enhancement, which is further expected to stimulate the market.
Indonesia Mineral Products Market - Key Attractiveness of the Report
- 10 Years of Market Numbers
- Historical Data Starting from 2022 to 2025
- Base Year: 2025
- Forecast Data until 2032
- Key Performance Indicators Impacting the Market
- Major Upcoming Developments and Projects
Key Highlights of the Report:
- Indonesia Mineral Products Market Outlook
- Market Size of Indonesia Mineral Products Market, 2025
- Forecast of Indonesia Mineral Products Market, 2032
- Historical Data and Forecast of Indonesia Mineral Products Revenues & Volume for the Period 2022-2032F
- Indonesia Mineral Products Market Trend Evolution
- Indonesia Mineral Products Market Drivers and Challenges
- Indonesia Mineral Products Price Trends
- Indonesia Mineral Products Porter's Five Forces
- Indonesia Mineral Products Industry Life Cycle
- Historical Data and Forecast of Indonesia Mineral Products Market Revenues & Volume By Types for the Period 2022-2032F
- Historical Data and Forecast of Indonesia Mineral Products Market Revenues & Volume By Cement and Concrete Product for the Period 2022-2032F
- Historical Data and Forecast of Indonesia Mineral Products Market Revenues & Volume By Glass and Glass Product for the Period 2022-2032F
- Historical Data and Forecast of Indonesia Mineral Products Market Revenues & Volume By Other Non-Metallic Mineral Product for the Period 2022-2032F
- Historical Data and Forecast of Indonesia Mineral Products Market Revenues & Volume By Clay Product and Refractory for the Period 2022-2032F
- Historical Data and Forecast of Indonesia Mineral Products Market Revenues & Volume By Lime and Gypsum Product for the Period 2022-2032F
- Historical Data and Forecast of Indonesia Mineral Products Market Revenues & Volume By Applications for the Period 2022-2032F
- Historical Data and Forecast of Indonesia Mineral Products Market Revenues & Volume By Architecture for the Period 2022-2032F
- Historical Data and Forecast of Indonesia Mineral Products Market Revenues & Volume By Industry for the Period 2022-2032F
- Historical Data and Forecast of Indonesia Mineral Products Market Revenues & Volume By Manufacture for the Period 2022-2032F
- Historical Data and Forecast of Indonesia Mineral Products Market Revenues & Volume By Others for the Period 2022-2032F
- Indonesia Mineral Products Import Export Trade Statistics
- Market Opportunity Assessment By Types
- Market Opportunity Assessment By Applications
- Indonesia Mineral Products Top Companies Market Share
- Indonesia Mineral Products Competitive Benchmarking By Technical and Operational Parameters
- Indonesia Mineral Products Company Profiles
- Indonesia Mineral Products Key Strategic Recommendations
Frequently Asked Questions About the Market Study (FAQs):
The Indonesia Mineral Products Market is projected to reach USD 470 Million by 2032, growing from USD 357 Million in 2025, reflecting a CAGR of 4.0% from 2026 to 2032.
Shifts in international trade policies, particularly due to US-China tensions, have led to positive export gains for Indonesia, primarily through shipments to neighboring countries like India and the Philippines.
Rising disposable incomes and urbanization are major factors driving consumer demand, along with an increased expenditure on building materials that reflect higher confidence in the economy.
Current trends include a shift towards sustainability, with increased demand for eco-friendly mineral products and innovative mining technologies aimed at reducing environmental impacts.
Government initiatives are crucial for enhancing market growth, focusing on sustainable practices, infrastructure improvements, and attracting investments that align with international standards.
6Wresearch actively monitors the Indonesia Mineral Products Market and publishes its comprehensive annual report, highlighting emerging trends, growth drivers, revenue analysis, and forecast outlook. Our insights help businesses to make data-backed strategic decisions with ongoing market dynamics. Our analysts track relevent industries related to the Indonesia Mineral Products Market, allowing our clients with actionable intelligence and reliable forecasts tailored to emerging regional needs.
Yes, we provide customisation as per your requirements. To learn more, feel free to contact us on sales@6wresearch.com
1 Executive Summary |
2 Introduction |
2.1 Key Highlights of the Report |
2.2 Report Description |
2.3 Market Scope & Segmentation |
2.4 Research Methodology |
2.5 Assumptions |
3 Indonesia Mineral Products Market Overview |
3.1 Indonesia Country Macro Economic Indicators |
3.2 Indonesia Mineral Products Market Revenues & Volume, 2022 & 2032F |
3.3 Indonesia Mineral Products Market - Industry Life Cycle |
3.4 Indonesia Mineral Products Market - Porter's Five Forces |
3.5 Indonesia Mineral Products Market Revenues & Volume Share, By Types, 2022 & 2032F |
3.6 Indonesia Mineral Products Market Revenues & Volume Share, By Applications, 2022 & 2032F |
4 Indonesia Mineral Products Market Dynamics |
4.1 Impact Analysis |
4.2 Market Drivers |
4.2.1 Increasing demand for mineral products in various industries such as construction, automotive, and electronics. |
4.2.2 Government initiatives to promote the mining sector and attract foreign investments. |
4.2.3 Growing infrastructure projects in Indonesia leading to higher consumption of mineral products. |
4.3 Market Restraints |
4.3.1 Environmental concerns and regulations impacting mining operations and production of mineral products. |
4.3.2 Volatility in commodity prices affecting the profitability of mineral products. |
4.3.3 Infrastructure challenges and logistics issues hindering the distribution of mineral products. |
5 Indonesia Mineral Products Market Trends |
6 Indonesia Mineral Products Market, By Types |
6.1 Indonesia Mineral Products Market, By Types |
6.1.1 Overview and Analysis |
6.1.2 Indonesia Mineral Products Market Revenues & Volume, By Types, 2022-2032F |
6.1.3 Indonesia Mineral Products Market Revenues & Volume, By Cement and Concrete Product, 2022-2032F |
6.1.4 Indonesia Mineral Products Market Revenues & Volume, By Glass and Glass Product, 2022-2032F |
6.1.5 Indonesia Mineral Products Market Revenues & Volume, By Other Non-Metallic Mineral Product, 2022-2032F |
6.1.6 Indonesia Mineral Products Market Revenues & Volume, By Clay Product and Refractory, 2022-2032F |
6.1.7 Indonesia Mineral Products Market Revenues & Volume, By Lime and Gypsum Product, 2022-2032F |
6.2 Indonesia Mineral Products Market, By Applications |
6.2.1 Overview and Analysis |
6.2.2 Indonesia Mineral Products Market Revenues & Volume, By Architecture, 2022-2032F |
6.2.3 Indonesia Mineral Products Market Revenues & Volume, By Industry, 2022-2032F |
6.2.4 Indonesia Mineral Products Market Revenues & Volume, By Manufacture, 2022-2032F |
6.2.5 Indonesia Mineral Products Market Revenues & Volume, By Others, 2022-2032F |
7 Indonesia Mineral Products Market Import-Export Trade Statistics |
7.1 Indonesia Mineral Products Market Export to Major Countries |
7.2 Indonesia Mineral Products Market Imports from Major Countries |
8 Indonesia Mineral Products Market Key Performance Indicators |
8.1 Average selling price of mineral products in Indonesia. |
8.2 Percentage of mineral product imports vs. domestic production. |
8.3 Capacity utilization rate of mineral processing facilities. |
8.4 Exploration and development expenditure in the Indonesian mining sector. |
8.5 Number of new mining permits issued by the government. |
9 Indonesia Mineral Products Market - Opportunity Assessment |
9.1 Indonesia Mineral Products Market Opportunity Assessment, By Types, 2022 & 2032F |
9.2 Indonesia Mineral Products Market Opportunity Assessment, By Applications, 2022 & 2032F |
10 Indonesia Mineral Products Market - Competitive Landscape |
10.1 Indonesia Mineral Products Market Revenue Share, By Companies, 2025 |
10.2 Indonesia Mineral Products Market Competitive Benchmarking, By Operating and Technical Parameters |
11 Company Profiles |
12 Recommendations |
13 Disclaimer |
Global Go To Market Strategy - 2030
Export potential enables firms to identify high-growth global markets with greater confidence by combining advanced trade intelligence with a structured quantitative methodology. The framework analyzes emerging demand trends and country-level import patterns while integrating macroeconomic and trade datasets such as GDP and population forecasts, bilateral import–export flows, tariff structures, elasticity differentials between developed and developing economies, geographic distance, and import demand projections. Using weighted trade values from 2020–2024 as the base period to project country-to-country export potential for 2030, these inputs are operationalized through calculated drivers such as gravity model parameters, tariff impact factors, and projected GDP per-capita growth. Through an analysis of hidden potentials, demand hotspots, and market conditions that are most favorable to success, this method enables firms to focus on target countries, maximize returns, and global expansion with data, backed by accuracy.
By factoring in the projected importer demand gap that is currently unmet and could be potential opportunity, it identifies the potential for the Exporter (Country) among 190 countries, against the general trade analysis, which identifies the biggest importer or exporter.
To discover high-growth global markets and optimize your business strategy:
Click Here
Pricing
- Single User License$ 1,995
- Department License$ 2,400
- Site License$ 3,120
- Global License$ 3,795

Leadership Perspectives from Industry Events
Search
Thought Leadership and Analyst Meet


Our Clients
6WResearch In News
- India Air Conditioner Market Set for Strong Rebound in 2026 After Weather-Led Correction and GST-Driven Recovery: 6Wresearch
- ADAS in India: How Automatic Emergency Braking, Blind Spot Detection & Driver Monitoring are Transforming Road Safety
- Doha a strategic location for EV manufacturing hub: IPA Qatar
- Demand for luxury TVs surging in the GCC, says Samsung
- Empowering Growth: The Thriving Journey of Bangladesh’s Cable Industry
- Demand for luxury TVs surging in the GCC, says Samsung
Latest Reports
- Nicaragua RPG Gaming Market (2026-2032)
- New Zealand RPG Gaming Market (2026-2032)
- Netherlands RPG Gaming Market (2026-2032)
- Nauru RPG Gaming Market (2026-2032)
- Namibia RPG Gaming Market (2026-2032)
- Mozambique RPG Gaming Market (2026-2032)
- Montenegro RPG Gaming Market (2026-2032)
- Mongolia RPG Gaming Market (2026-2032)
- Monaco RPG Gaming Market (2026-2032)
- Micronesia RPG Gaming Market (2026-2032)
Industry Events and Analyst Meet

EV India Expo 2026

HIMTEX 2026

India Refining Summit 2026

India EV Show 2026

EV tech India Expo 2026
Whitepaper
- Middle East & Africa Commercial Security Market Click here to view more.
- Middle East & Africa Fire Safety Systems & Equipment Market Click here to view more.
- GCC Drone Market Click here to view more.
- Middle East Lighting Fixture Market Click here to view more.
- GCC Physical & Perimeter Security Market Click here to view more.