Indonesia Mobile Asset Management (MAM) Market (2026-2032) Outlook | Forecast, Growth, Trends, Industry, Companies, Revenue, Value, Size, Share & Analysis
Market Forecast By Components (Solutions, Services), By Asset Types (Fixed Assets, Mobile Assets), By Organization Size (SMEs, Large Enterprises), By Vertical (Building Automation, Manufacturing, Healthcare, Retail, Energy & Utilities, Transportation & Logistics, Metal & Mining, Others), By Deployment Modes (On-premises, Cloud) And Competitive Landscape
| Product Code: ETC067847 | Publication Date: Jul 2023 | Updated Date: Jun 2026 | Product Type: Report | |
| Publisher: 6Wresearch | Author: Ravi Bhandari | No. of Pages: 70 | No. of Figures: 35 | No. of Tables: 5 |
Indonesia Mobile Asset Management (MAM) Market Size, Share & Growth Rate
The Indonesia Mobile Asset Management (MAM) Market was estimated at USD 193 Million in 2025 and is projected to reach USD 254 Million by 2032, growing at a CAGR of 4.0% from 2026 to 2032. This growth trajectory reflects the increasing demand for sophisticated asset tracking solutions tailored to enhance operational efficiency. The rising use of smartphones and internet facilities in Indonesia, coupled with growing pressures to minimize operational costs, will significantly influence market dynamics in the coming years.
Indonesia Mobile Asset Management (MAM) Market Year-wise Growth Rate and Key Drivers
This graph highlights how the Indonesia Mobile Asset Management (MAM) Market has steadily grown over the years, supported by major growth factors.
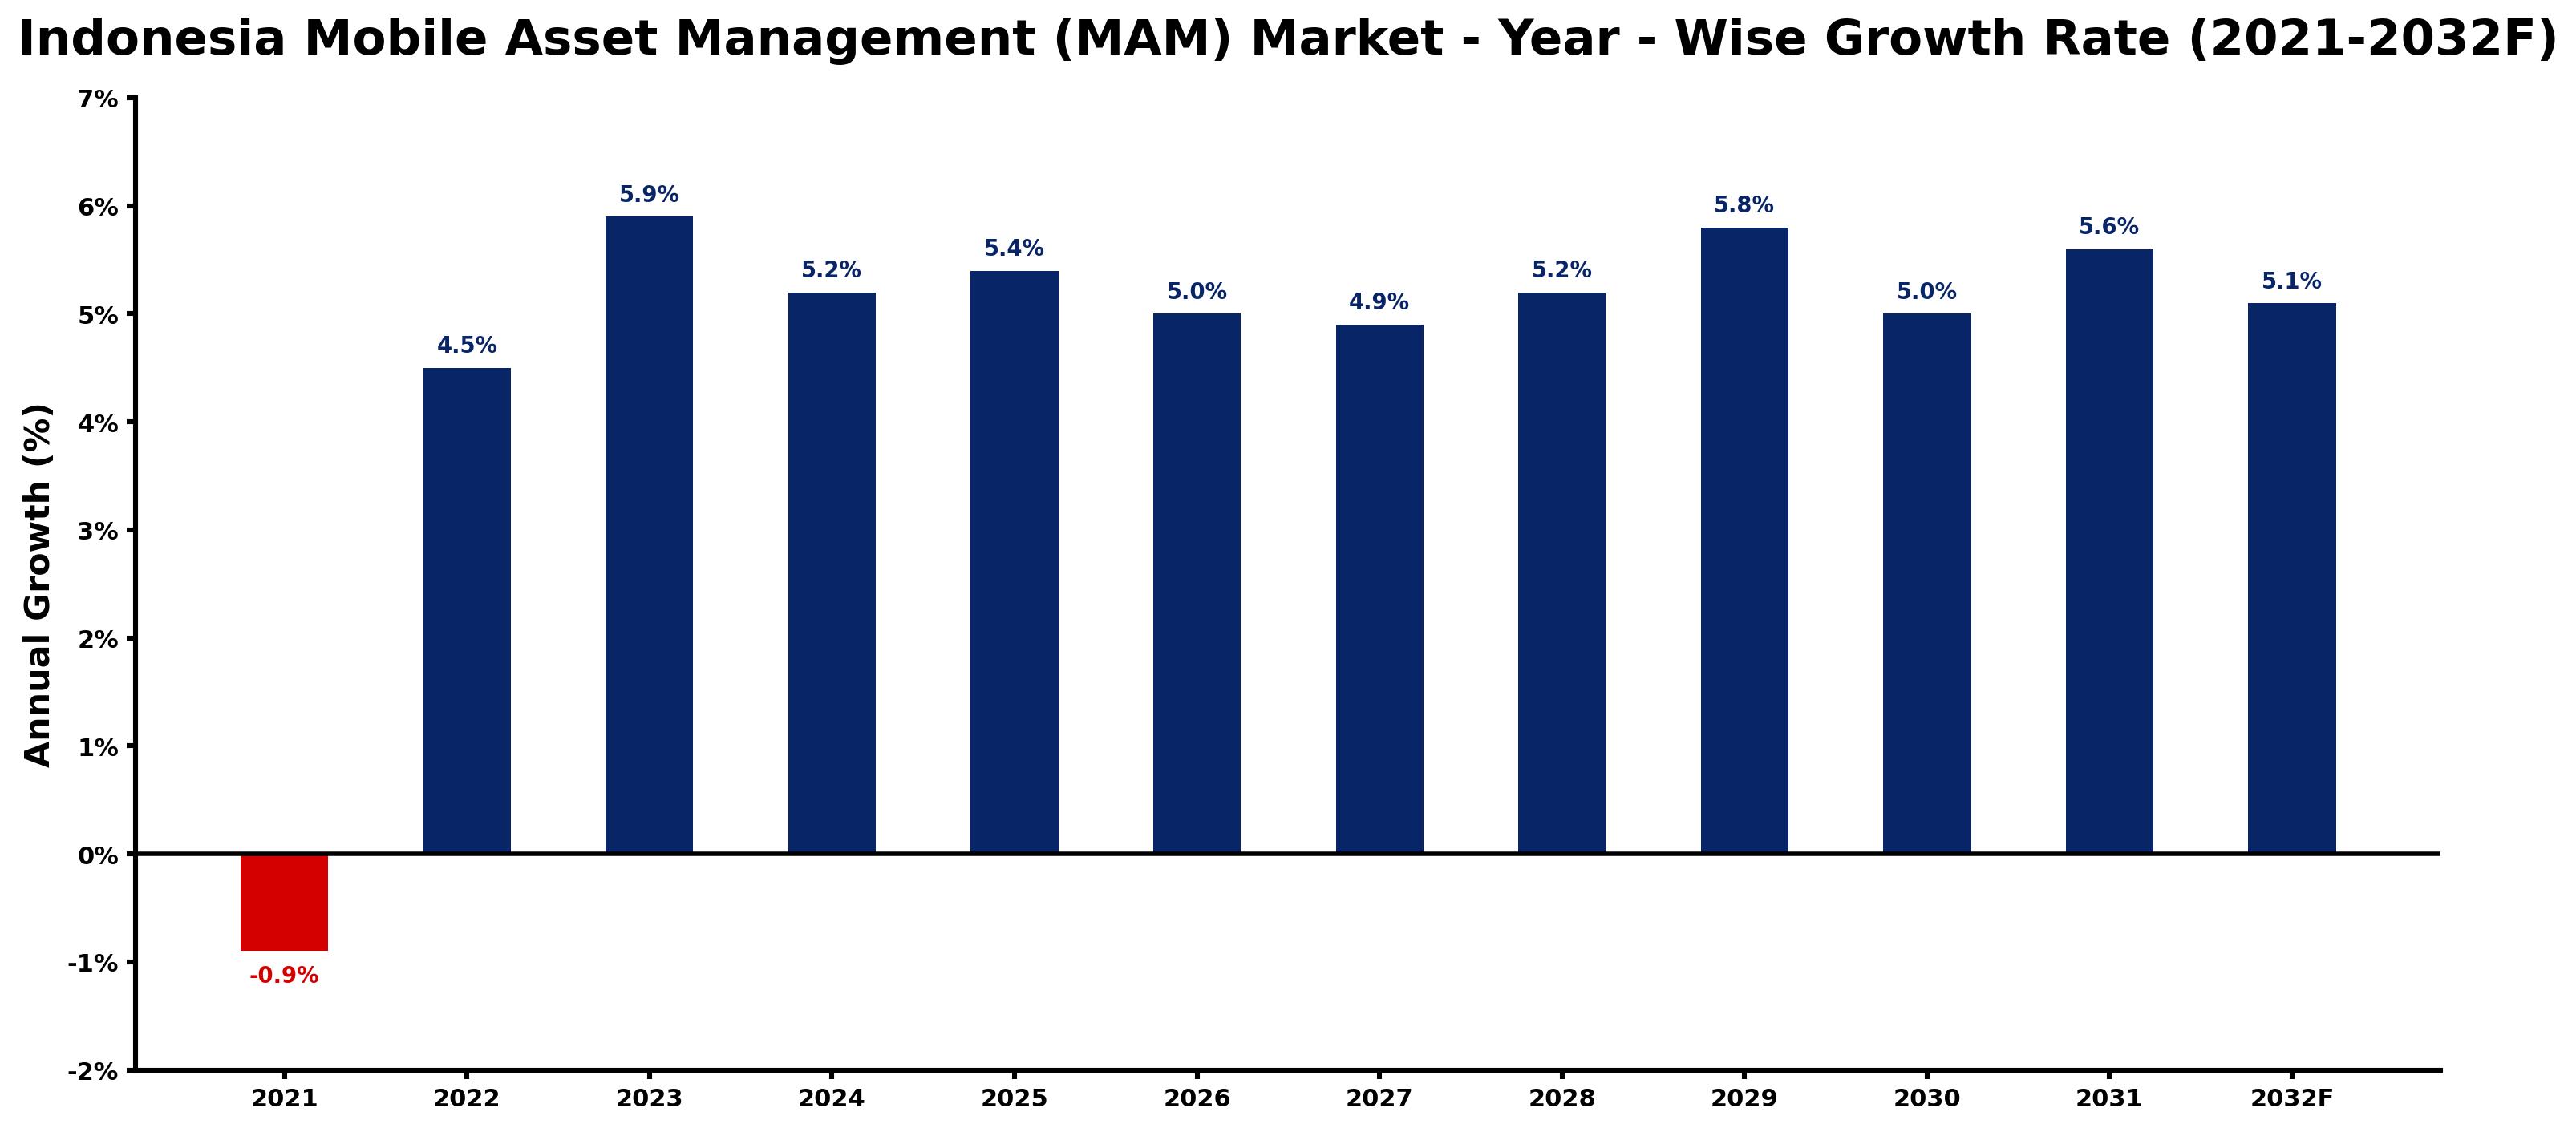
The table below presents the year‑wise growth rates along with the key drivers influencing the market
| Year | Growth Rate | Major Drivers |
| 2021 | -0.9% | Growing urbanization and commercial development |
| 2022 | 4.5% | Expansion of manufacturing activities |
| 2023 | 5.9% | Increasing smart city development projects |
| 2024 | 5.2% | Growing urbanization and commercial development |
| 2025 | 5.4% | Government infrastructure modernization initiatives |
| 2026 | 5.0% | Increasing industrial automation investments |
| 2027 | 4.9% | Rapid growth in telecom and data center sectors |
| 2028 | 5.2% | Increasing adoption of advanced technologies |
| 2029 | 5.8% | Government infrastructure modernization initiatives |
| 2030 | 5.0% | Increasing smart city development projects |
| 2031 | 5.6% | Expansion of manufacturing activities |
| 2032 | 5.1% | Government infrastructure modernization initiatives |
Note - Market size estimations and growth projections presented in this report are based on 6Wresearch’s advanced forecasting approach, validated with industry datasets as of June 2026.
Indonesia Mobile Asset Management (MAM) Market Synopsis
Recent trends indicate a surge in interest toward mobile asset management solutions, particularly as businesses strive for competitive advantage in a rapidly evolving landscape. As organizations recognize the importance of real-time visibility into their assets, MAM systems are becoming indispensable tools for informed decision-making.
However, despite this momentum, the market faces challenges, particularly in terms of awareness and technical capability among smaller enterprises. Many potential users remain unacquainted with the advantages of MAM, which may limit widespread adoption and consequently impact overall market growth.
Indonesia Mobile Asset Management (MAM) Market Key Takeaways
- Increased demand for real-time asset tracking solutions is propelling market growth.
- Mobile asset management is becoming a priority for organizations aiming to streamline operations and reduce costs.
- Awareness and technical proficiency in MAM solutions are critical factors for market adoption.
- Government initiatives supporting digitalization in various sectors will further enhance market potential.
- Competitive pressure among organizations is driving innovation in mobile asset management technologies.
Evaluation of Restraints in Indonesia Mobile Asset Management (MAM) Market
One of the primary obstacles facing the Indonesia MAM market is the lack of awareness among smaller businesses regarding the technologies available for effective asset management. This unfamiliarity often leads to hesitance in adopting MAM solutions, thereby perpetuating a technological divide with larger corporations that have the resources to invest in such systems. Additionally, the limited technical capabilities present within some organizations can hinder the implementation and maintenance of these advanced solutions, creating a significant barrier to entry for potential users.
Indonesia Mobile Asset Management (MAM) Market Trends
As technology evolves, the Indonesia MAM market is witnessing several transformative trends. The integration of Internet of Things (IoT) technology is enabling enhanced real-time tracking and monitoring capabilities, allowing businesses to gain deeper insights into their asset utilization. Additionally, as mobile applications become more user-friendly, they are increasingly appealing to a broader range of organizations, streamlining asset management processes and enabling more efficient operations.
Indonesia Mobile Asset Management (MAM) Market Opportunities
There is a significant opportunity for growth in the Indonesian MAM market, especially as digital transformation initiatives continue to gain traction across various sectors. Organizations looking to optimize asset management can leverage advanced MAM solutions to improve efficiency, reduce operational costs, and ultimately enhance their bottom line. With government support for digitalization, firms can explore partnerships and investments in mobile asset management technologies to gain competitive advantages.
Government Initiatives in the Indonesia Mobile Asset Management (MAM) Market
The Indonesian government is actively promoting digitalization across multiple industries, which serves as a catalyst for the MAM market. Various programs and incentives are designed to encourage organizations to adopt advanced technologies that streamline processes and boost operational efficiency. By fostering an environment conducive to technological advancement, these initiatives are expected to facilitate the broader uptake of mobile asset management solutions within the region.
Future Insights of the Indonesia Mobile Asset Management (MAM) Market
Looking ahead to 2026-2032, the Indonesia MAM market is poised for sustained growth. Companies will increasingly recognize the importance of adopting mobile asset management systems as competitive pressures intensify and the need for cost-effective operational strategies becomes paramount. As technology continues to evolve and become more accessible, businesses across diverse sectors are likely to invest in these solutions, reinforcing the market’s upward trajectory.
Indonesia Mobile Asset Management (MAM) Market Latest Developments (May 2025 - June 2026)
Recent developments in the Indonesia MAM landscape reveal a focused effort among organizations to integrate advanced mobile solutions into their operational frameworks. There has been a noticeable uptick in collaborative efforts among tech firms and businesses to develop tailored MAM systems that cater to the unique needs of various industries. This trend indicates a clear shift toward embracing innovative technology to drive efficiency and improve asset management practices.
Indonesia Mobile Asset Management (MAM) Market - Key Attractiveness of the Report
- 10 Years of Market Numbers
- Historical Data Starting from 2022 to 2025
- Base Year: 2025
- Forecast Data until 2032
- Key Performance Indicators Impacting the Market
- Major Upcoming Developments and Projects
Key Highlights of the Report:
- Indonesia Mobile Asset Management (MAM) Market Outlook
- Market Size of Indonesia Mobile Asset Management (MAM) Market, 2025
- Forecast of Indonesia Mobile Asset Management (MAM) Market, 2032F
- Historical Data and Forecast of Indonesia Mobile Asset Management (MAM) Revenues & Volume for the Period 2022-2032F
- Indonesia Mobile Asset Management (MAM) Market Trend Evolution
- Indonesia Mobile Asset Management (MAM) Market Drivers and Challenges
- Indonesia Mobile Asset Management (MAM) Price Trends
- Indonesia Mobile Asset Management (MAM) Porter's Five Forces
- Indonesia Mobile Asset Management (MAM) Industry Life Cycle
- Historical Data and Forecast of Indonesia Mobile Asset Management (MAM) Market Revenues & Volume By Components for the Period 2022-2032F
- Historical Data and Forecast of Indonesia Mobile Asset Management (MAM) Market Revenues & Volume By Solutions for the Period 2022-2032F
- Historical Data and Forecast of Indonesia Mobile Asset Management (MAM) Market Revenues & Volume By Services for the Period 2022-2032F
- Historical Data and Forecast of Indonesia Mobile Asset Management (MAM) Market Revenues & Volume By Asset Types for the Period 2022-2032F
- Historical Data and Forecast of Indonesia Mobile Asset Management (MAM) Market Revenues & Volume By Fixed Assets for the Period 2022-2032F
- Historical Data and Forecast of Indonesia Mobile Asset Management (MAM) Market Revenues & Volume By Mobile Assets for the Period 2022-2032F
- Historical Data and Forecast of Indonesia Mobile Asset Management (MAM) Market Revenues & Volume By Organization Size for the Period 2022-2032F
- Historical Data and Forecast of Indonesia Mobile Asset Management (MAM) Market Revenues & Volume By SMEs for the Period 2022-2032F
- Historical Data and Forecast of Indonesia Mobile Asset Management (MAM) Market Revenues & Volume By Large Enterprises for the Period 2022-2032F
- Historical Data and Forecast of Indonesia Mobile Asset Management (MAM) Market Revenues & Volume By Vertical for the Period 2022-2032F
- Historical Data and Forecast of Indonesia Mobile Asset Management (MAM) Market Revenues & Volume By Building Automation for the Period 2022-2032F
- Historical Data and Forecast of Indonesia Mobile Asset Management (MAM) Market Revenues & Volume By Manufacturing for the Period 2022-2032F
- Historical Data and Forecast of Indonesia Mobile Asset Management (MAM) Market Revenues & Volume By Healthcare for the Period 2022-2032F
- Historical Data and Forecast of Indonesia Mobile Asset Management (MAM) Market Revenues & Volume By Retail for the Period 2022-2032F
- Historical Data and Forecast of Indonesia Mobile Asset Management (MAM) Market Revenues & Volume By Energy & Utilities for the Period 2022-2032F
- Historical Data and Forecast of Indonesia Mobile Asset Management (MAM) Market Revenues & Volume By Transportation & Logistics for the Period 2022-2032F
- Historical Data and Forecast of Indonesia Mobile Asset Management (MAM) Market Revenues & Volume By Metal & Mining for the Period 2022-2032F
- Historical Data and Forecast of Indonesia Mobile Asset Management (MAM) Market Revenues & Volume By Others for the Period 2022-2032F
- Historical Data and Forecast of Indonesia Mobile Asset Management (MAM) Market Revenues & Volume By Deployment Modes for the Period 2022-2032F
- Historical Data and Forecast of Indonesia Mobile Asset Management (MAM) Market Revenues & Volume By On-premises for the Period 2022-2032F
- Historical Data and Forecast of Indonesia Mobile Asset Management (MAM) Market Revenues & Volume By Cloud for the Period 2022-2032F
- Indonesia Mobile Asset Management (MAM) Import Export Trade Statistics
- Market Opportunity Assessment By Components
- Market Opportunity Assessment By Asset Types
- Market Opportunity Assessment By Organization Size
- Market Opportunity Assessment By Vertical
- Market Opportunity Assessment By Deployment Modes
- Indonesia Mobile Asset Management (MAM) Top Companies Market Share
- Indonesia Mobile Asset Management (MAM) Competitive Benchmarking By Technical and Operational Parameters
- Indonesia Mobile Asset Management (MAM) Company Profiles
- Indonesia Mobile Asset Management (MAM) Key Strategic Recommendations
Indonesia Mobile Asset Management (MAM) Market - Frequently Asked Questions
The Indonesia Mobile Asset Management market is estimated to grow from USD 193 Million in 2025 to USD 254 Million by 2032, reflecting a CAGR of 4.0% from 2026 to 2032.
Organizations are increasingly motivated by the need to enhance operational efficiency and minimize costs. The competitive landscape and stakeholder pressures to improve margins further fuel the adoption of MAM solutions.
Government initiatives aimed at promoting digitalization across industries serve as a significant boost to the MAM market. These initiatives create a favorable environment for businesses to invest in advanced asset management technologies.
Smaller enterprises often struggle with a lack of awareness about available technologies and limited technical capabilities, which may hinder their ability to implement and maintain effective MAM solutions.
Current trends include the adoption of IoT technologies for enhanced tracking and monitoring capabilities, as well as a shift toward more user-friendly mobile applications that simplify asset management processes.
6Wresearch actively monitors the Indonesia Mobile Asset Management (MAM) Market and publishes its comprehensive annual report, highlighting emerging trends, growth drivers, revenue analysis, and forecast outlook. Our insights help businesses to make data-backed strategic decisions with ongoing market dynamics. Our analysts track relevent industries related to the Indonesia Mobile Asset Management (MAM) Market, allowing our clients with actionable intelligence and reliable forecasts tailored to emerging regional needs.
Yes, we provide customisation as per your requirements. To learn more, feel free to contact us on sales@6wresearch.com
1 Executive Summary |
2 Introduction |
2.1 Key Highlights of the Report |
2.2 Report Description |
2.3 Market Scope & Segmentation |
2.4 Research Methodology |
2.5 Assumptions |
3 Indonesia Mobile Asset Management (MAM) Market Overview |
3.1 Indonesia Country Macro Economic Indicators |
3.2 Indonesia Mobile Asset Management (MAM) Market Revenues & Volume, 2022 & 2032F |
3.3 Indonesia Mobile Asset Management (MAM) Market - Industry Life Cycle |
3.4 Indonesia Mobile Asset Management (MAM) Market - Porter's Five Forces |
3.5 Indonesia Mobile Asset Management (MAM) Market Revenues & Volume Share, By Components, 2022 & 2032F |
3.6 Indonesia Mobile Asset Management (MAM) Market Revenues & Volume Share, By Asset Types, 2022 & 2032F |
3.7 Indonesia Mobile Asset Management (MAM) Market Revenues & Volume Share, By Organization Size, 2022 & 2032F |
3.8 Indonesia Mobile Asset Management (MAM) Market Revenues & Volume Share, By Vertical, 2022 & 2032F |
3.9 Indonesia Mobile Asset Management (MAM) Market Revenues & Volume Share, By Deployment Modes, 2022 & 2032F |
4 Indonesia Mobile Asset Management (MAM) Market Dynamics |
4.1 Impact Analysis |
4.2 Market Drivers |
4.3 Market Restraints |
5 Indonesia Mobile Asset Management (MAM) Market Trends |
6 Indonesia Mobile Asset Management (MAM) Market, By Types |
6.1 Indonesia Mobile Asset Management (MAM) Market, By Components |
6.1.1 Overview and Analysis |
6.1.2 Indonesia Mobile Asset Management (MAM) Market Revenues & Volume, By Components, 2022-2032F |
6.1.3 Indonesia Mobile Asset Management (MAM) Market Revenues & Volume, By Solutions, 2022-2032F |
6.1.4 Indonesia Mobile Asset Management (MAM) Market Revenues & Volume, By Services, 2022-2032F |
6.2 Indonesia Mobile Asset Management (MAM) Market, By Asset Types |
6.2.1 Overview and Analysis |
6.2.2 Indonesia Mobile Asset Management (MAM) Market Revenues & Volume, By Fixed Assets, 2022-2032F |
6.2.3 Indonesia Mobile Asset Management (MAM) Market Revenues & Volume, By Mobile Assets, 2022-2032F |
6.3 Indonesia Mobile Asset Management (MAM) Market, By Organization Size |
6.3.1 Overview and Analysis |
6.3.2 Indonesia Mobile Asset Management (MAM) Market Revenues & Volume, By SMEs, 2022-2032F |
6.3.3 Indonesia Mobile Asset Management (MAM) Market Revenues & Volume, By Large Enterprises, 2022-2032F |
6.4 Indonesia Mobile Asset Management (MAM) Market, By Vertical |
6.4.1 Overview and Analysis |
6.4.2 Indonesia Mobile Asset Management (MAM) Market Revenues & Volume, By Building Automation, 2022-2032F |
6.4.3 Indonesia Mobile Asset Management (MAM) Market Revenues & Volume, By Manufacturing, 2022-2032F |
6.4.4 Indonesia Mobile Asset Management (MAM) Market Revenues & Volume, By Healthcare, 2022-2032F |
6.4.5 Indonesia Mobile Asset Management (MAM) Market Revenues & Volume, By Retail, 2022-2032F |
6.4.6 Indonesia Mobile Asset Management (MAM) Market Revenues & Volume, By Energy & Utilities, 2022-2032F |
6.4.7 Indonesia Mobile Asset Management (MAM) Market Revenues & Volume, By Transportation & Logistics, 2022-2032F |
6.4.8 Indonesia Mobile Asset Management (MAM) Market Revenues & Volume, By Others, 2022-2032F |
6.4.9 Indonesia Mobile Asset Management (MAM) Market Revenues & Volume, By Others, 2022-2032F |
6.5 Indonesia Mobile Asset Management (MAM) Market, By Deployment Modes |
6.5.1 Overview and Analysis |
6.5.2 Indonesia Mobile Asset Management (MAM) Market Revenues & Volume, By On-premises, 2022-2032F |
6.5.3 Indonesia Mobile Asset Management (MAM) Market Revenues & Volume, By Cloud, 2022-2032F |
7 Indonesia Mobile Asset Management (MAM) Market Import-Export Trade Statistics |
7.1 Indonesia Mobile Asset Management (MAM) Market Export to Major Countries |
7.2 Indonesia Mobile Asset Management (MAM) Market Imports from Major Countries |
8 Indonesia Mobile Asset Management (MAM) Market Key Performance Indicators |
9 Indonesia Mobile Asset Management (MAM) Market - Opportunity Assessment |
9.1 Indonesia Mobile Asset Management (MAM) Market Opportunity Assessment, By Components, 2022 & 2032F |
9.2 Indonesia Mobile Asset Management (MAM) Market Opportunity Assessment, By Asset Types, 2022 & 2032F |
9.3 Indonesia Mobile Asset Management (MAM) Market Opportunity Assessment, By Organization Size, 2022 & 2032F |
9.4 Indonesia Mobile Asset Management (MAM) Market Opportunity Assessment, By Vertical, 2022 & 2032F |
9.5 Indonesia Mobile Asset Management (MAM) Market Opportunity Assessment, By Deployment Modes, 2022 & 2032F |
10 Indonesia Mobile Asset Management (MAM) Market - Competitive Landscape |
10.1 Indonesia Mobile Asset Management (MAM) Market Revenue Share, By Companies, 2025 |
10.2 Indonesia Mobile Asset Management (MAM) Market Competitive Benchmarking, By Operating and Technical Parameters |
11 Company Profiles |
12 Recommendations |
13 Disclaimer |
Global Go To Market Strategy - 2030
Export potential enables firms to identify high-growth global markets with greater confidence by combining advanced trade intelligence with a structured quantitative methodology. The framework analyzes emerging demand trends and country-level import patterns while integrating macroeconomic and trade datasets such as GDP and population forecasts, bilateral import–export flows, tariff structures, elasticity differentials between developed and developing economies, geographic distance, and import demand projections. Using weighted trade values from 2020–2024 as the base period to project country-to-country export potential for 2030, these inputs are operationalized through calculated drivers such as gravity model parameters, tariff impact factors, and projected GDP per-capita growth. Through an analysis of hidden potentials, demand hotspots, and market conditions that are most favorable to success, this method enables firms to focus on target countries, maximize returns, and global expansion with data, backed by accuracy.
By factoring in the projected importer demand gap that is currently unmet and could be potential opportunity, it identifies the potential for the Exporter (Country) among 190 countries, against the general trade analysis, which identifies the biggest importer or exporter.
To discover high-growth global markets and optimize your business strategy:
Click Here
Pricing
- Single User License$ 1,995
- Department License$ 2,400
- Site License$ 3,120
- Global License$ 3,795

Leadership Perspectives from Industry Events
Search
Thought Leadership and Analyst Meet


Our Clients
6WResearch In News
- India Air Conditioner Market Set for Strong Rebound in 2026 After Weather-Led Correction and GST-Driven Recovery: 6Wresearch
- ADAS in India: How Automatic Emergency Braking, Blind Spot Detection & Driver Monitoring are Transforming Road Safety
- Doha a strategic location for EV manufacturing hub: IPA Qatar
- Demand for luxury TVs surging in the GCC, says Samsung
- Empowering Growth: The Thriving Journey of Bangladesh’s Cable Industry
- Demand for luxury TVs surging in the GCC, says Samsung
Latest Reports
- Nicaragua RPG Gaming Market (2026-2032)
- New Zealand RPG Gaming Market (2026-2032)
- Netherlands RPG Gaming Market (2026-2032)
- Nauru RPG Gaming Market (2026-2032)
- Namibia RPG Gaming Market (2026-2032)
- Mozambique RPG Gaming Market (2026-2032)
- Montenegro RPG Gaming Market (2026-2032)
- Mongolia RPG Gaming Market (2026-2032)
- Monaco RPG Gaming Market (2026-2032)
- Micronesia RPG Gaming Market (2026-2032)
Industry Events and Analyst Meet

EV India Expo 2026

HIMTEX 2026

India Refining Summit 2026

India EV Show 2026

EV tech India Expo 2026
Whitepaper
- Middle East & Africa Commercial Security Market Click here to view more.
- Middle East & Africa Fire Safety Systems & Equipment Market Click here to view more.
- GCC Drone Market Click here to view more.
- Middle East Lighting Fixture Market Click here to view more.
- GCC Physical & Perimeter Security Market Click here to view more.