Indonesia Nitrogenous Fertilizers Market (2024-2030) | Forecast, Industry, Outlook, Trends, Size, Growth, Value, Companies, Share, Revenue & Analysis
Market Forecast By Product (Urea, Ammonium Nitrate, Ammonium Sulfate, Ammonia, Calcium Ammonium Nitrate (CAN), Others), By Application (Cereals & Grains, Oilseeds & Pulses, Fruits & Vegetables, Others) And Competitive Landscape
| Product Code: ETC025308 | Publication Date: Jul 2023 | Updated Date: Feb 2026 | Product Type: Report | |
| Publisher: 6Wresearch | Author: Ravi Bhandari | No. of Pages: 70 | No. of Figures: 35 | No. of Tables: 5 |
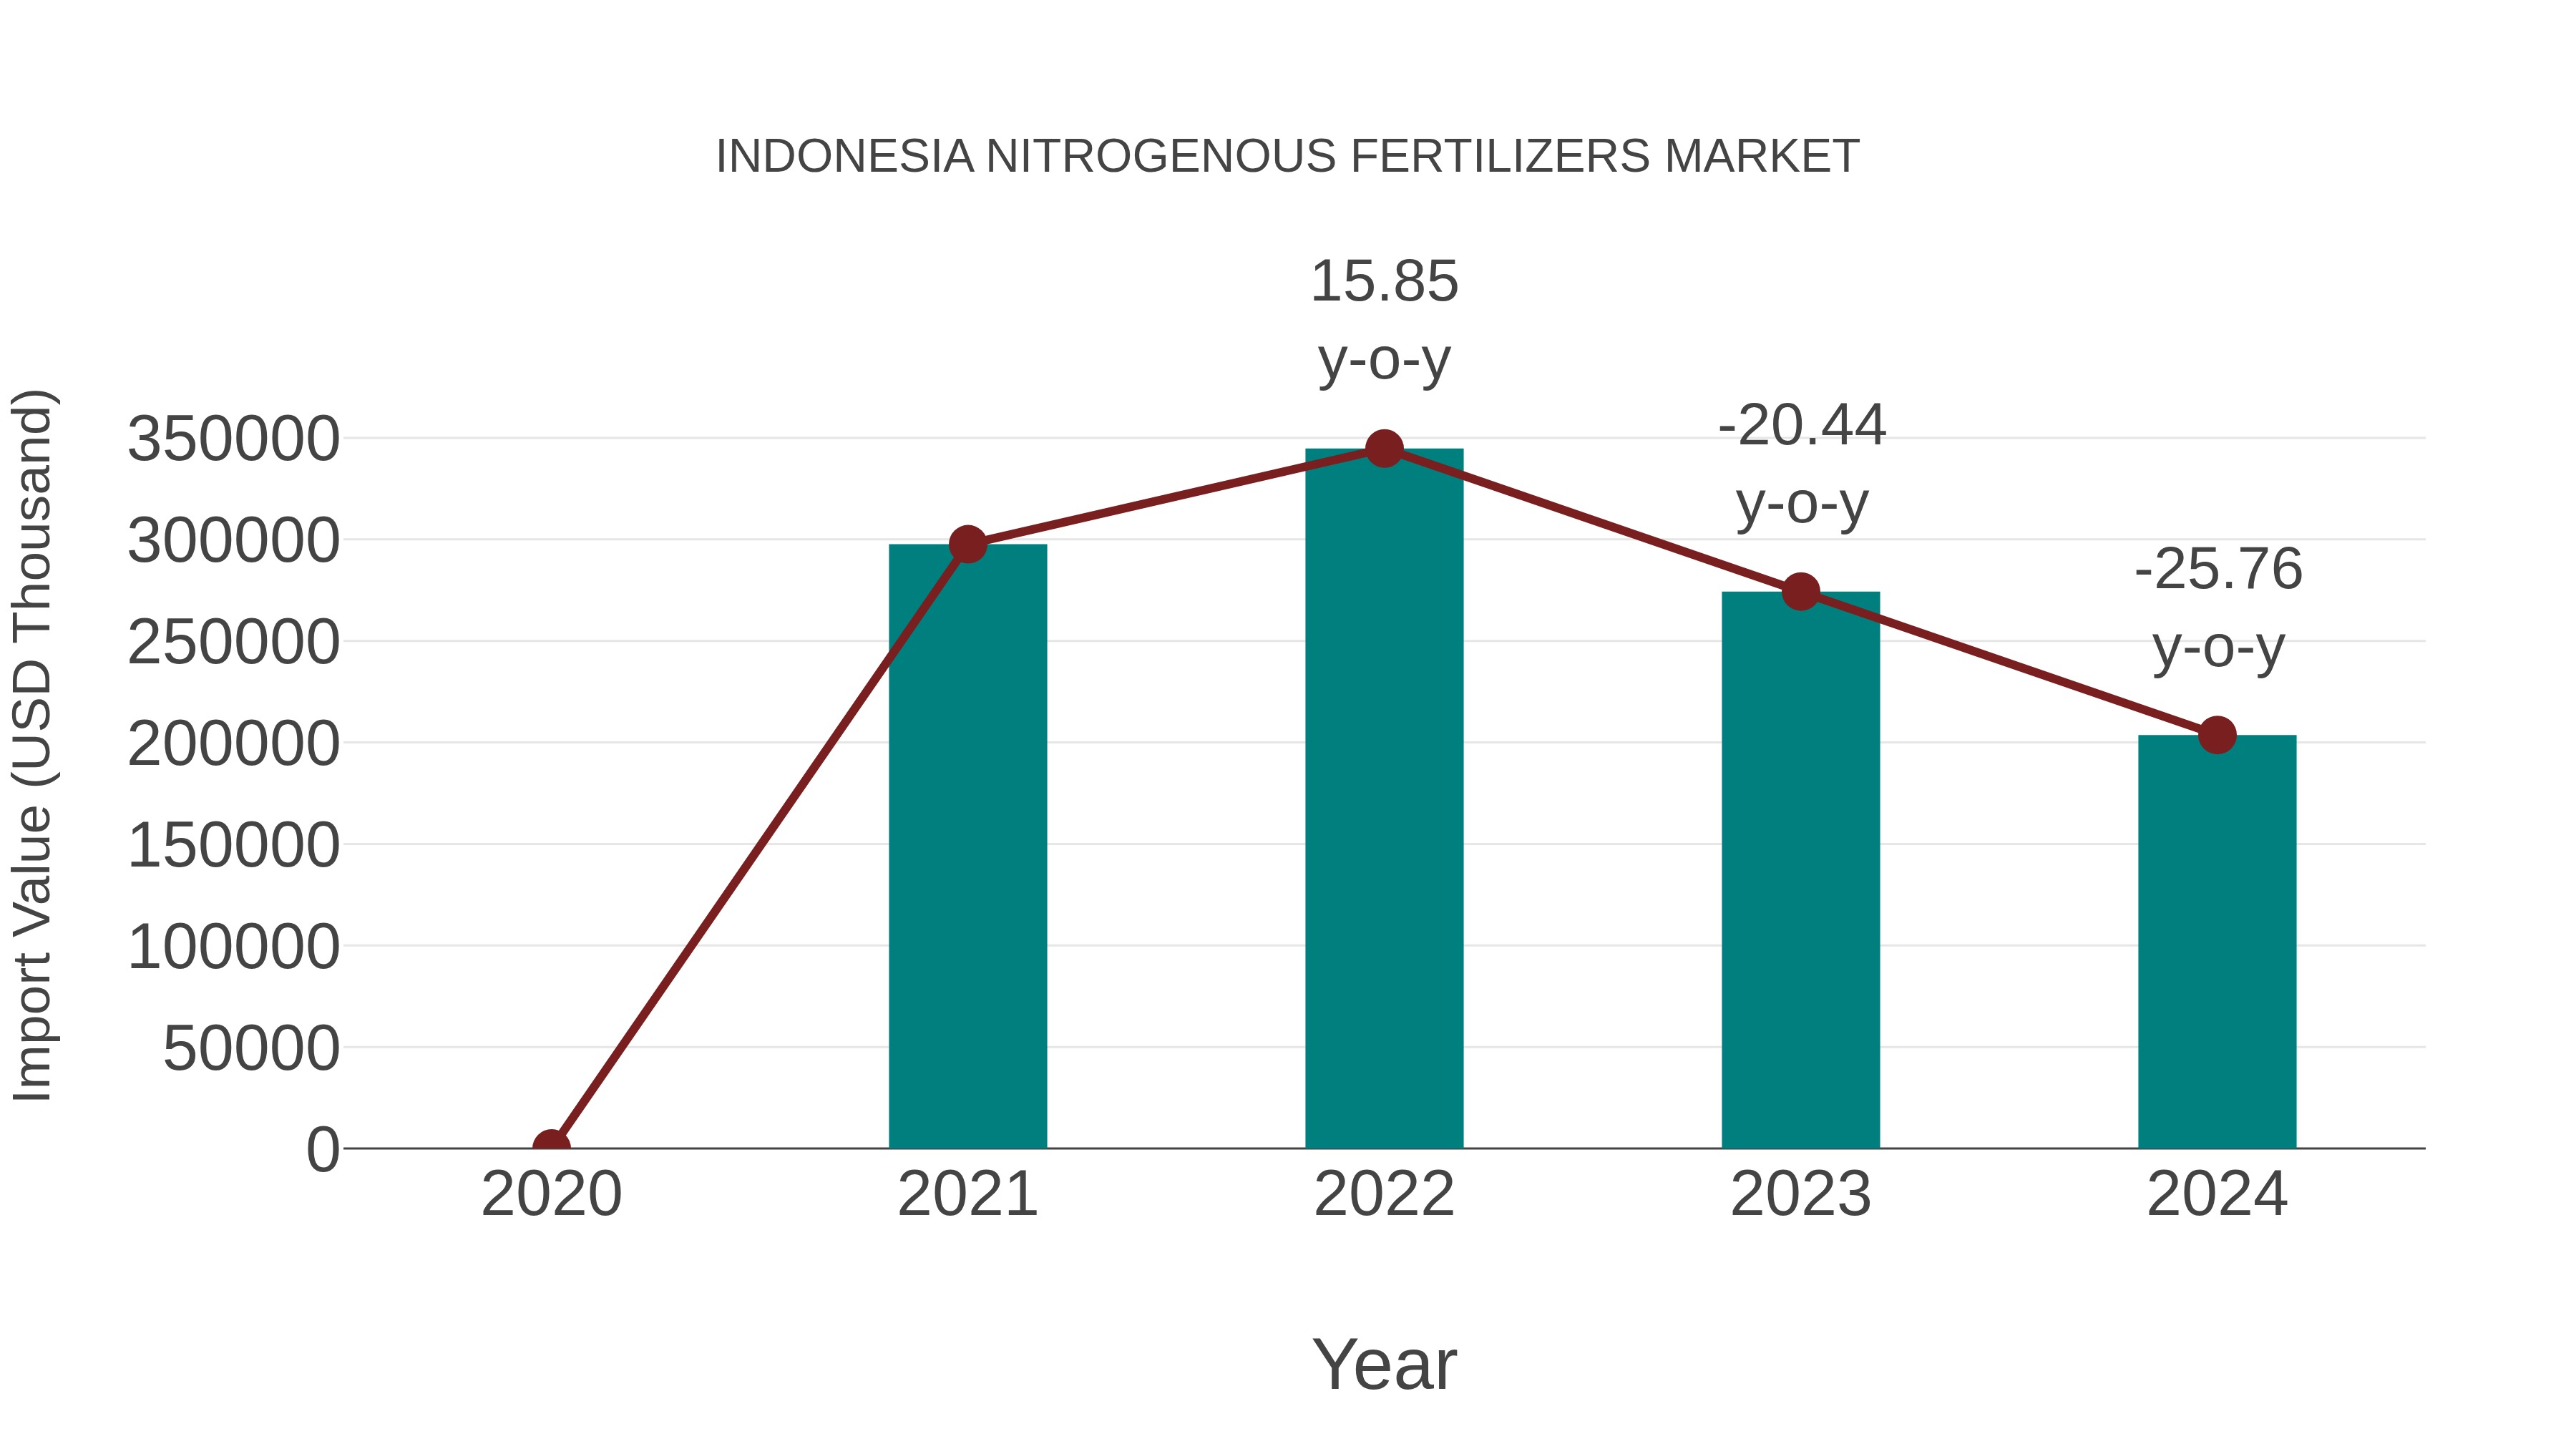
Indonesia Nitrogenous Fertilizers Market: Import Trend Analysis
In the Indonesia nitrogenous fertilizers market, the import trend experienced a decline from 2023 to 2024, with a growth rate of -25.76%. The compound annual growth rate (CAGR) for the period 2020-2024 stood at -11.88%. This negative trend could be attributed to shifts in demand dynamics or changes in trade policies affecting market stability.
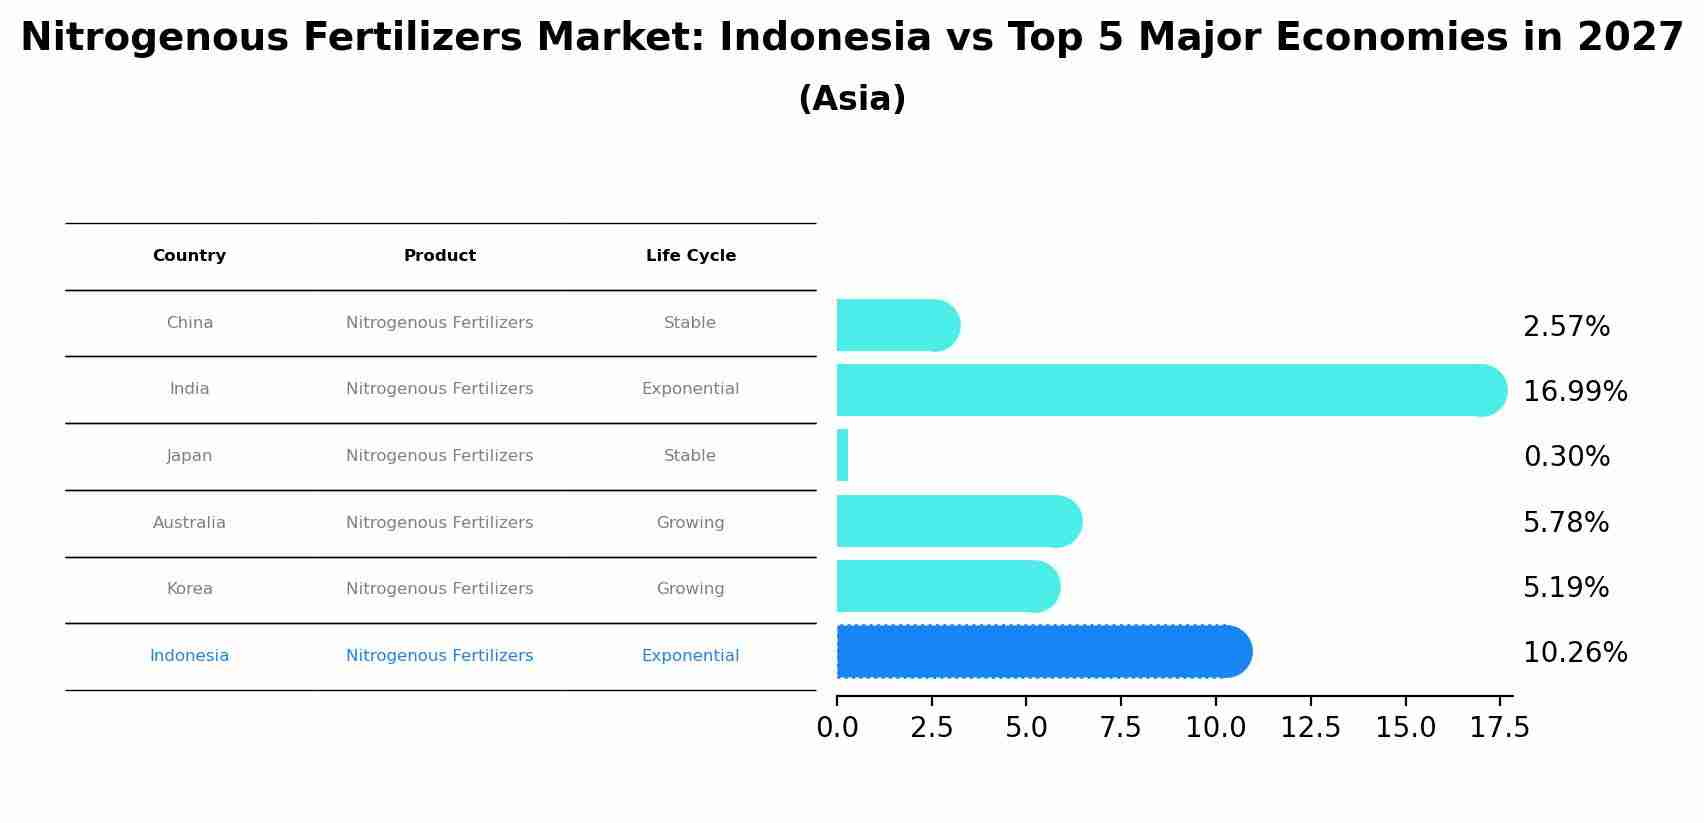
Nitrogenous Fertilizers Market: Indonesia vs Top 5 Major Economies in 2027 (Asia)
Indonesia's Nitrogenous Fertilizers market is anticipated to experience a high growth rate of 10.26% by 2027, reflecting trends observed in the largest economy China, followed by India, Japan, Australia and South Korea.
Indonesia Nitrogenous Fertilizers Market Synopsis
Indonesia is the world?s largest producer of nitrogenous fertilizers accounting for 33% of global production in 2020. Indonesia demand for nitrogenous fertilizer has been increasing steadily over the past decade due to its growing agricultural sector and rising population. The country also imports a significant amount of products such as urea and ammonium nitrate from abroad which helps meet domestic needs. This report provides an overview of the Indonesia nitrogenous fertilizer market along with key drivers challenges and key players in this space.
Key Factors Driving the Market
The main driver behind theof Indonesia`s nitrogenous fertilizers market is its large agricultural sector that accounts for around 12% to 15% of GDP. As farmers are increasingly adopting modern methods such as soil testing before applying fertilizers to improve yields there is greater demand for these products. Additionally government initiatives such as subsidies on certain types of fertilizer have further contributed to increased consumption in recent years. Furthermore strong export potential has enabled manufacturers to increase their presence both domestically and overseas by selling their products at competitive prices.
Key Highlights of the Report:
- Indonesia Nitrogenous Fertilizers Market Outlook
- Market Size of Indonesia Nitrogenous Fertilizers Market, 2023
- Forecast of Indonesia Nitrogenous Fertilizers Market, 2030
- Historical Data and Forecast of Indonesia Nitrogenous Fertilizers Revenues & Volume for the Period 2020-2030
- Indonesia Nitrogenous Fertilizers Market Trend Evolution
- Indonesia Nitrogenous Fertilizers Market Drivers and Challenges
- Indonesia Nitrogenous Fertilizers Price Trends
- Indonesia Nitrogenous Fertilizers Porter's Five Forces
- Indonesia Nitrogenous Fertilizers Industry Life Cycle
- Historical Data and Forecast of Indonesia Nitrogenous Fertilizers Market Revenues & Volume By Product for the Period 2020-2030
- Historical Data and Forecast of Indonesia Nitrogenous Fertilizers Market Revenues & Volume By Urea for the Period 2020-2030
- Historical Data and Forecast of Indonesia Nitrogenous Fertilizers Market Revenues & Volume By Ammonium Nitrate for the Period 2020-2030
- Historical Data and Forecast of Indonesia Nitrogenous Fertilizers Market Revenues & Volume By Ammonium Sulfate for the Period 2020-2030
- Historical Data and Forecast of Indonesia Nitrogenous Fertilizers Market Revenues & Volume By Ammonia for the Period 2020-2030
- Historical Data and Forecast of Indonesia Nitrogenous Fertilizers Market Revenues & Volume By Calcium Ammonium Nitrate (CAN) for the Period 2020-2030
- Historical Data and Forecast of Indonesia Nitrogenous Fertilizers Market Revenues & Volume By Others for the Period 2020-2030
- Historical Data and Forecast of Indonesia Nitrogenous Fertilizers Market Revenues & Volume By Application for the Period 2020-2030
- Historical Data and Forecast of Indonesia Nitrogenous Fertilizers Market Revenues & Volume By Cereals & Grains for the Period 2020-2030
- Historical Data and Forecast of Indonesia Nitrogenous Fertilizers Market Revenues & Volume By Oilseeds & Pulses for the Period 2020-2030
- Historical Data and Forecast of Indonesia Nitrogenous Fertilizers Market Revenues & Volume By Fruits & Vegetables for the Period 2020-2030
- Historical Data and Forecast of Indonesia Nitrogenous Fertilizers Market Revenues & Volume By Others for the Period 2020-2030
- Indonesia Nitrogenous Fertilizers Import Export Trade Statistics
- Market Opportunity Assessment By Product
- Market Opportunity Assessment By Application
- Indonesia Nitrogenous Fertilizers Top Companies Market Share
- Indonesia Nitrogenous Fertilizers Competitive Benchmarking By Technical and Operational Parameters
- Indonesia Nitrogenous Fertilizers Company Profiles
- Indonesia Nitrogenous Fertilizers Key Strategic Recommendations
Frequently Asked Questions About the Market Study (FAQs):
6Wresearch actively monitors the Indonesia Nitrogenous Fertilizers Market and publishes its comprehensive annual report, highlighting emerging trends, growth drivers, revenue analysis, and forecast outlook. Our insights help businesses to make data-backed strategic decisions with ongoing market dynamics. Our analysts track relevent industries related to the Indonesia Nitrogenous Fertilizers Market, allowing our clients with actionable intelligence and reliable forecasts tailored to emerging regional needs.
Yes, we provide customisation as per your requirements. To learn more, feel free to contact us on sales@6wresearch.com
1 Executive Summary |
2 Introduction |
2.1 Key Highlights of the Report |
2.2 Report Description |
2.3 Market Scope & Segmentation |
2.4 Research Methodology |
2.5 Assumptions |
3 Indonesia Nitrogenous Fertilizers Market Overview |
3.1 Indonesia Country Macro Economic Indicators |
3.2 Indonesia Nitrogenous Fertilizers Market Revenues & Volume, 2020 & 2030F |
3.3 Indonesia Nitrogenous Fertilizers Market - Industry Life Cycle |
3.4 Indonesia Nitrogenous Fertilizers Market - Porter's Five Forces |
3.5 Indonesia Nitrogenous Fertilizers Market Revenues & Volume Share, By Product, 2020 & 2030F |
3.6 Indonesia Nitrogenous Fertilizers Market Revenues & Volume Share, By Application, 2020 & 2030F |
4 Indonesia Nitrogenous Fertilizers Market Dynamics |
4.1 Impact Analysis |
4.2 Market Drivers |
4.2.1 Increasing demand for food production due to growing population |
4.2.2 Government support and initiatives to promote agriculture |
4.2.3 Technological advancements in fertilizer production |
4.3 Market Restraints |
4.3.1 Fluctuating prices of raw materials |
4.3.2 Environmental concerns related to the excessive use of nitrogenous fertilizers |
4.3.3 Competition from organic fertilizers |
5 Indonesia Nitrogenous Fertilizers Market Trends |
6 Indonesia Nitrogenous Fertilizers Market, By Types |
6.1 Indonesia Nitrogenous Fertilizers Market, By Product |
6.1.1 Overview and Analysis |
6.1.2 Indonesia Nitrogenous Fertilizers Market Revenues & Volume, By Product, 2020-2030F |
6.1.3 Indonesia Nitrogenous Fertilizers Market Revenues & Volume, By Urea, 2020-2030F |
6.1.4 Indonesia Nitrogenous Fertilizers Market Revenues & Volume, By Ammonium Nitrate, 2020-2030F |
6.1.5 Indonesia Nitrogenous Fertilizers Market Revenues & Volume, By Ammonium Sulfate, 2020-2030F |
6.1.6 Indonesia Nitrogenous Fertilizers Market Revenues & Volume, By Ammonia, 2020-2030F |
6.1.7 Indonesia Nitrogenous Fertilizers Market Revenues & Volume, By Calcium Ammonium Nitrate (CAN), 2020-2030F |
6.1.8 Indonesia Nitrogenous Fertilizers Market Revenues & Volume, By Others, 2020-2030F |
6.2 Indonesia Nitrogenous Fertilizers Market, By Application |
6.2.1 Overview and Analysis |
6.2.2 Indonesia Nitrogenous Fertilizers Market Revenues & Volume, By Cereals & Grains, 2020-2030F |
6.2.3 Indonesia Nitrogenous Fertilizers Market Revenues & Volume, By Oilseeds & Pulses, 2020-2030F |
6.2.4 Indonesia Nitrogenous Fertilizers Market Revenues & Volume, By Fruits & Vegetables, 2020-2030F |
6.2.5 Indonesia Nitrogenous Fertilizers Market Revenues & Volume, By Others, 2020-2030F |
7 Indonesia Nitrogenous Fertilizers Market Import-Export Trade Statistics |
7.1 Indonesia Nitrogenous Fertilizers Market Export to Major Countries |
7.2 Indonesia Nitrogenous Fertilizers Market Imports from Major Countries |
8 Indonesia Nitrogenous Fertilizers Market Key Performance Indicators |
8.1 Adoption rate of new nitrogenous fertilizer technologies |
8.2 Farmer education and training programs on efficient fertilizer use |
8.3 Soil health indicators such as nutrient levels and pH balance |
9 Indonesia Nitrogenous Fertilizers Market - Opportunity Assessment |
9.1 Indonesia Nitrogenous Fertilizers Market Opportunity Assessment, By Product, 2020 & 2030F |
9.2 Indonesia Nitrogenous Fertilizers Market Opportunity Assessment, By Application, 2020 & 2030F |
10 Indonesia Nitrogenous Fertilizers Market - Competitive Landscape |
10.1 Indonesia Nitrogenous Fertilizers Market Revenue Share, By Companies, 2023 |
10.2 Indonesia Nitrogenous Fertilizers Market Competitive Benchmarking, By Operating and Technical Parameters |
11 Company Profiles |
12 Recommendations |
13 Disclaimer |
Global Go To Market Strategy - 2030
Export potential enables firms to identify high-growth global markets with greater confidence by combining advanced trade intelligence with a structured quantitative methodology. The framework analyzes emerging demand trends and country-level import patterns while integrating macroeconomic and trade datasets such as GDP and population forecasts, bilateral import–export flows, tariff structures, elasticity differentials between developed and developing economies, geographic distance, and import demand projections. Using weighted trade values from 2020–2024 as the base period to project country-to-country export potential for 2030, these inputs are operationalized through calculated drivers such as gravity model parameters, tariff impact factors, and projected GDP per-capita growth. Through an analysis of hidden potentials, demand hotspots, and market conditions that are most favorable to success, this method enables firms to focus on target countries, maximize returns, and global expansion with data, backed by accuracy.
By factoring in the projected importer demand gap that is currently unmet and could be potential opportunity, it identifies the potential for the Exporter (Country) among 190 countries, against the general trade analysis, which identifies the biggest importer or exporter.
To discover high-growth global markets and optimize your business strategy:
Click Here
Pricing
- Single User License$ 1,995
- Department License$ 2,400
- Site License$ 3,120
- Global License$ 3,795

Leadership Perspectives from Industry Events
Search
Thought Leadership and Analyst Meet


Our Clients
6WResearch In News
- India Air Conditioner Market Set for Strong Rebound in 2026 After Weather-Led Correction and GST-Driven Recovery: 6Wresearch
- ADAS in India: How Automatic Emergency Braking, Blind Spot Detection & Driver Monitoring are Transforming Road Safety
- Doha a strategic location for EV manufacturing hub: IPA Qatar
- Demand for luxury TVs surging in the GCC, says Samsung
- Empowering Growth: The Thriving Journey of Bangladesh’s Cable Industry
- Demand for luxury TVs surging in the GCC, says Samsung
Latest Reports
- Nicaragua RPG Gaming Market (2026-2032)
- New Zealand RPG Gaming Market (2026-2032)
- Netherlands RPG Gaming Market (2026-2032)
- Nauru RPG Gaming Market (2026-2032)
- Namibia RPG Gaming Market (2026-2032)
- Mozambique RPG Gaming Market (2026-2032)
- Montenegro RPG Gaming Market (2026-2032)
- Mongolia RPG Gaming Market (2026-2032)
- Monaco RPG Gaming Market (2026-2032)
- Micronesia RPG Gaming Market (2026-2032)
Industry Events and Analyst Meet

EV India Expo 2026

HIMTEX 2026

India Refining Summit 2026

India EV Show 2026

EV tech India Expo 2026
Whitepaper
- Middle East & Africa Commercial Security Market Click here to view more.
- Middle East & Africa Fire Safety Systems & Equipment Market Click here to view more.
- GCC Drone Market Click here to view more.
- Middle East Lighting Fixture Market Click here to view more.
- GCC Physical & Perimeter Security Market Click here to view more.