Indonesia Nitrosylsulfuric Acid Market (2026-2032) Outlook | Companies, Trends, Analysis, Size, Forecast, Revenue, Share, Value, Growth & Industry
Market Forecast By Type (40% Solution, Other), By Application (Dyes Intermediate, Other) And Competitive Landscape
| Product Code: ETC202660 | Publication Date: Jul 2023 | Updated Date: Jul 2026 | Product Type: Market Research Report | |
| Publisher: 6Wresearch | Author: Ravi Bhandari | No. of Pages: 60 | No. of Figures: 40 | No. of Tables: 7 |
Indonesia Nitrosylsulfuric Acid Market Size, Share & Growth Rate
The Indonesia Nitrosylsulfuric Acid Market was estimated at USD 169 Million in 2025 and is projected to reach USD 223 Million by 2032, growing at a CAGR of 4.0% from 2026 to 2032. This upward trajectory is primarily driven by increasing demand from automotive, pharmaceuticals, and other industrial sectors that leverage nitrosylsulfuric acid as a critical component in their processes. Additionally, the trend towards environmentally-friendly products and stringent regulations further fuels market growth, paving the way for innovative applications and enhanced demand.
Indonesia Nitrosylsulfuric Acid Market Year-wise Growth Rate and Key Drivers
This graph highlights how the Indonesia Nitrosylsulfuric Acid Market has steadily grown over the years, supported by major growth factors.
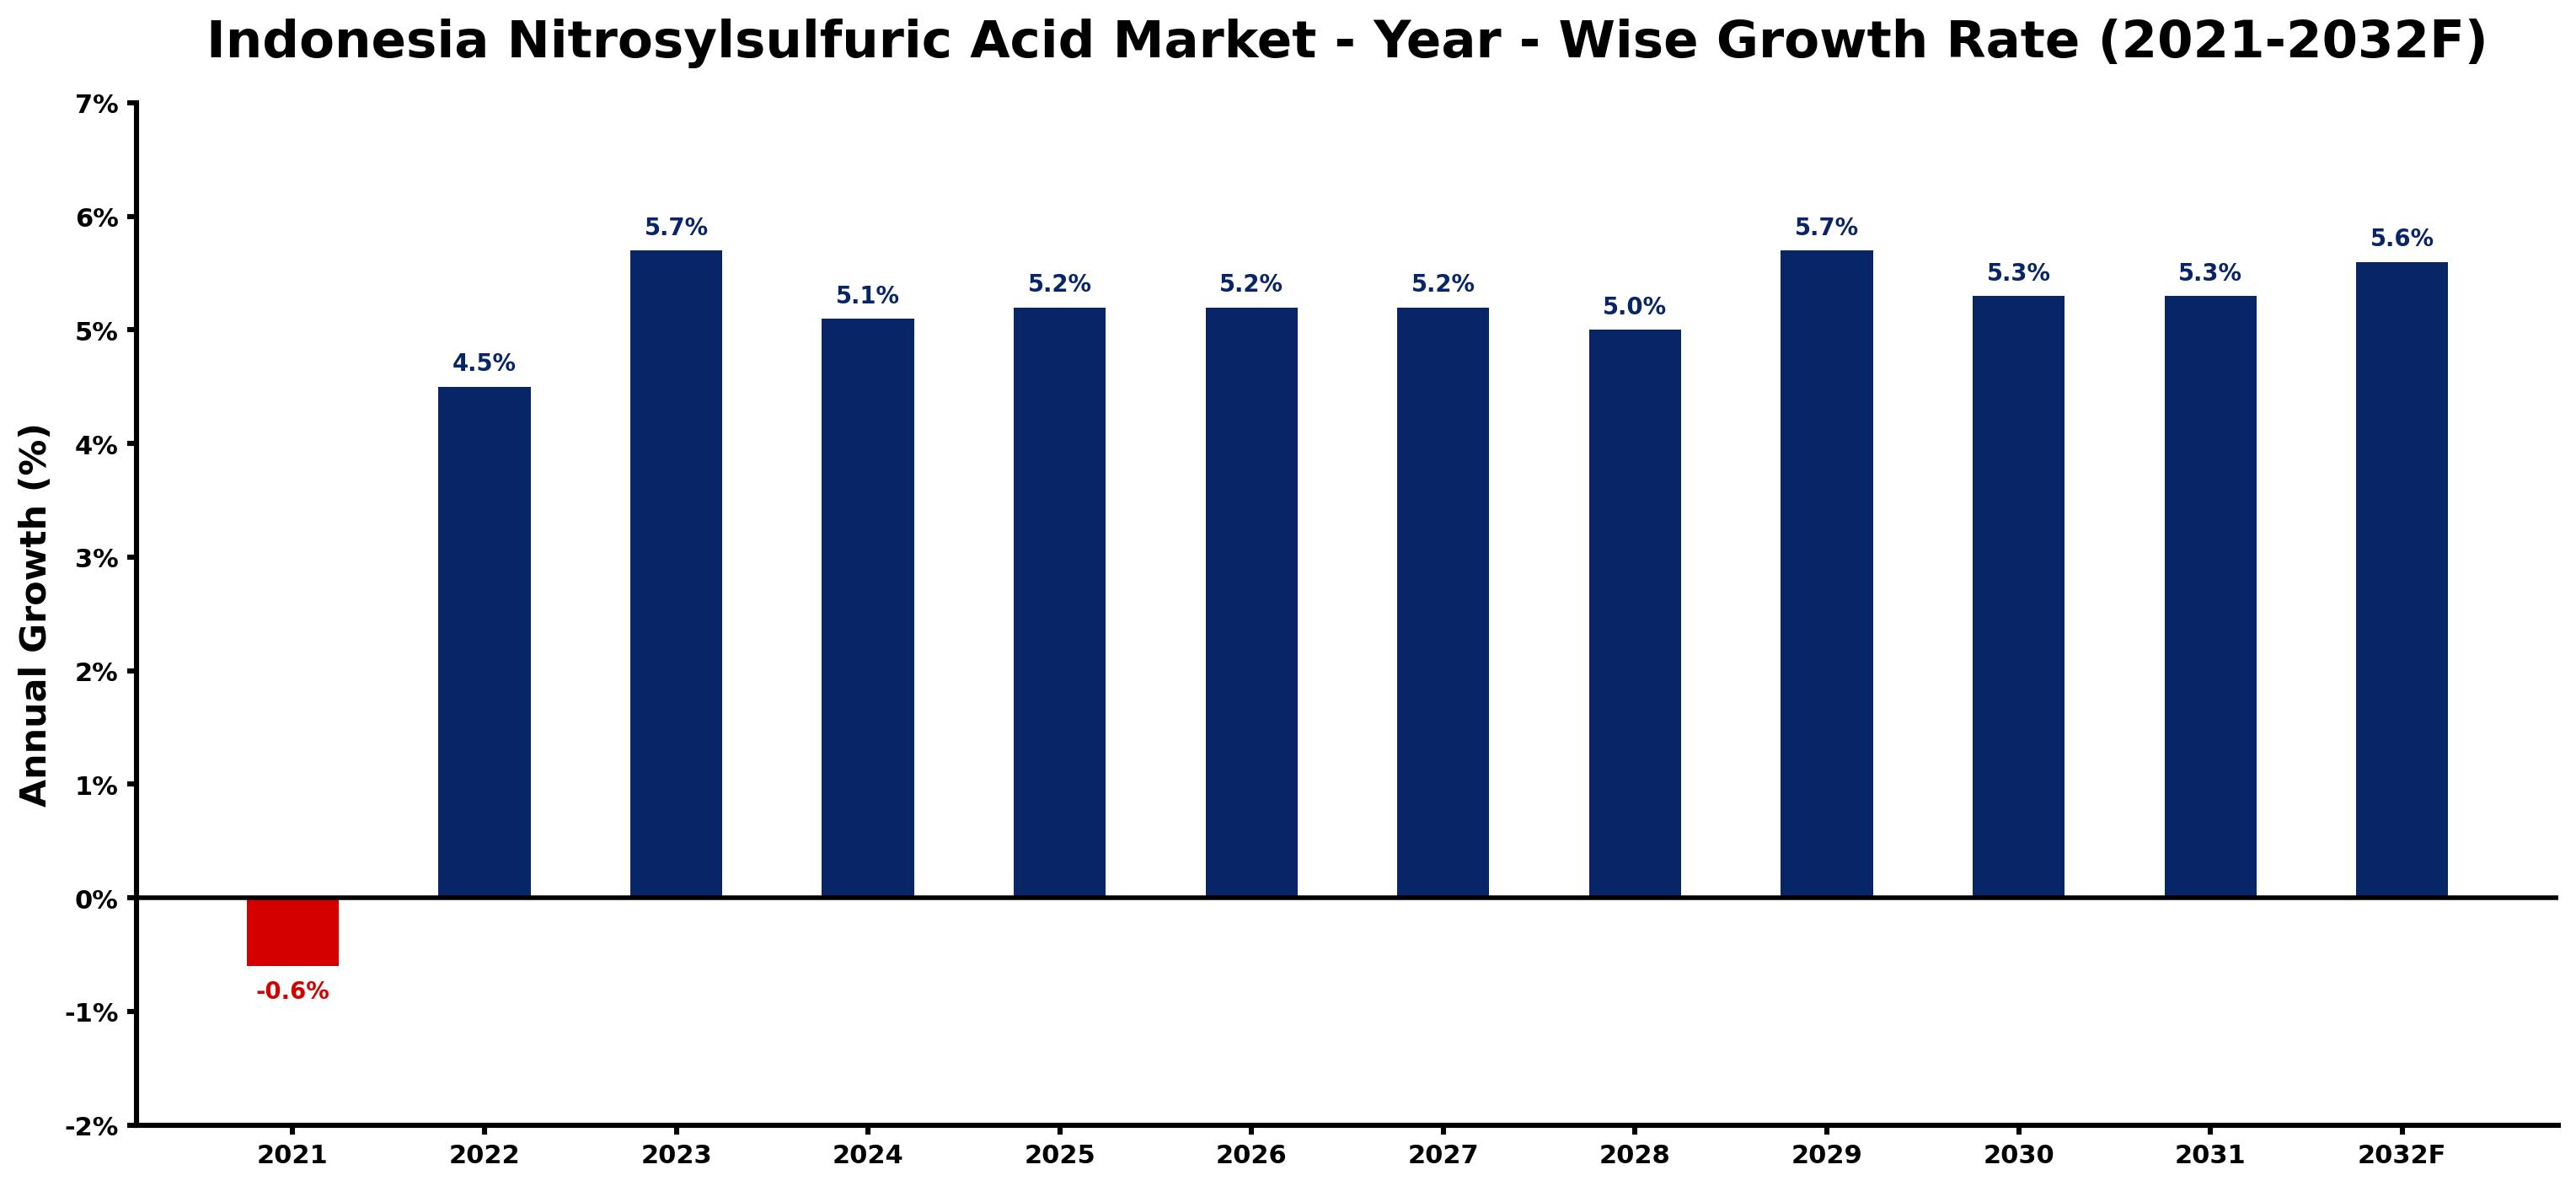
The table below presents the year‑wise growth rates along with the key drivers influencing the market
| Year | Growth Rate | Major Drivers |
| 2021 | -0.6% | decreased industrial manufacturing activity |
| 2022 | 4.5% | rising demand from agriculture sector |
| 2023 | 5.7% | increased investments in chemical sector |
| 2024 | 5.1% | expansion of energy production facilities |
| 2025 | 5.2% | growing urban infrastructure projects |
| 2026 | 5.2% | increased focus on sustainable practices |
| 2027 | 5.2% | rising exports to neighboring regions |
| 2028 | 5.0% | growing demand for specialty chemicals |
| 2029 | 5.7% | increased research and development initiatives |
| 2030 | 5.3% | rising infrastructure development spending |
| 2031 | 5.3% | increased collaboration with international partners |
| 2032 | 5.6% | growing trend of industrial automation |
Note: Market size estimations and growth projections presented in this report are based on 6Wresearch's proprietary forecasting methodology, utilizing the latest available industry data, government publications, and primary research inputs.
Indonesia Nitrosylsulfuric Acid Market Synopsis
The burgeoning interest in nitrosylsulfuric acid in Indonesia is the strongest force shaping the market today. As industries such as automotive manufacturing and electronics increasingly adopt this compound, the scope for significant growth becomes evident.
Moreover, new product innovations from key market players are likely to create a wave of opportunities. These advancements, coupled with government initiatives supporting research and development in advanced chemicals, position the Indonesia Nitrosylsulfuric Acid Market for remarkable expansion in the coming years.
Indonesia Nitrosylsulfuric Acid Market Key Takeaways
- Robust demand from diverse industries is shaping the growth of the market.
- Environmental considerations and regulatory measures are influencing market dynamics.
- Product innovation is expected to open new avenues in application areas.
- Government initiatives are boosting investments and capacity utilization in the sector.
- The overall impact of the COVID-19 pandemic has been moderate due to the essential nature of the product.
Evaluation of Restraints in Indonesia Nitrosylsulfuric Acid Market
While the Indonesia Nitrosylsulfuric Acid Market is positioned for growth, several challenges could restrain its progress. Fluctuating raw material prices due to macroeconomic variables can impede manufacturing and lead to unstable pricing strategies. Additionally, compliance with stringent regulations regarding production processes remains a significant concern for industry players, necessitating constant adaptation and investment. Health risks associated with the use of this compound also pose challenges for companies operating in this space, as they must navigate both operational and safety protocols.
Indonesia Nitrosylsulfuric Acid Market Trends
Current trends indicate a growing reliance on nitrosylsulfuric acid across multiple sectors, driven by its versatility as a catalyst and intermediate in chemical processes. Furthermore, an increasing emphasis on sustainability is prompting manufacturers to innovate formulations that align with green chemistry principles. The exploration of newer applications in agrochemicals and pharmaceuticals is also gaining traction, alongside advancements in production technology that enhance efficiency and reduce environmental impact.
Indonesia Nitrosylsulfuric Acid Market Opportunities
The market presents genuine growth opportunities through collaborative efforts among manufacturers to enhance research and development in nitrosylsulfuric acid applications. Investment in automated manufacturing processes is expected to improve production capabilities while reducing costs. Additionally, tapping into emerging industries such as biofuels and specialty chemicals could unlock new revenue streams for local manufacturers, ensuring sustained demand in the long run.
Government Initiatives in the Indonesia Nitrosylsulfuric Acid Market
The Indonesian government is actively fostering the growth of the nitrosylsulfuric acid sector through various initiatives, including tax incentives aimed at attracting investment. Programs designed to create dedicated research and development hubs are also instrumental in promoting innovation within the chemical sector. These efforts are not only enhancing local capabilities but also encouraging foreign investments, thereby strengthening the market landscape for nitrosylsulfuric acid.
Future Insights of the Indonesia Nitrosylsulfuric Acid Market
Looking ahead to the period from 2026 to 2032, the Indonesia Nitrosylsulfuric Acid Market is poised for sustained growth. With the continuous expansion of downstream industries utilizing this compound, market players will likely benefit from heightened demand. Moreover, technological advancements in production methods and an increasing focus on environmentally responsible practices will guide the market trajectory, making it essential for stakeholders to remain agile and innovative to capture forthcoming opportunities.
Indonesia Nitrosylsulfuric Acid Market Latest Developments (2025 - 2026)
Recent developments within the Indonesia Nitrosylsulfuric Acid Market have highlighted a resurgence in production capacity as companies adapt to post-pandemic demands. Innovations in synthesis processes have also emerged, aimed at improving yield and reducing costs. Collaborations between domestic manufacturers and research institutions are paving the way for breakthroughs in applications, aligning product development with market needs. These trends indicate a robust response from the industry to capitalize on emerging opportunities.
Indonesia Nitrosylsulfuric Acid Market - Key Attractiveness of the Report
- 10 Years of Market Numbers
- Historical Data Starting from 2022 to 2025
- Base Year: 2025
- Forecast Data until 2032
- Key Performance Indicators Impacting the Market
- Major Upcoming Developments and Projects
Key Highlights of the Report:
- Indonesia Nitrosylsulfuric Acid Market Outlook
- Market Size of Indonesia Nitrosylsulfuric Acid Market, 2025
- Forecast of Indonesia Nitrosylsulfuric Acid Market, 2032
- Historical Data and Forecast of Indonesia Nitrosylsulfuric Acid Revenues & Volume for the Period 2022-2032F
- Indonesia Nitrosylsulfuric Acid Market Trend Evolution
- Indonesia Nitrosylsulfuric Acid Market Drivers and Challenges
- Indonesia Nitrosylsulfuric Acid Price Trends
- Indonesia Nitrosylsulfuric Acid Porter's Five Forces
- Indonesia Nitrosylsulfuric Acid Industry Life Cycle
- Historical Data and Forecast of Indonesia Nitrosylsulfuric Acid Market Revenues & Volume By Type for the Period 2022-2032F
- Historical Data and Forecast of Indonesia Nitrosylsulfuric Acid Market Revenues & Volume By 40% Solution for the Period 2022-2032F
- Historical Data and Forecast of Indonesia Nitrosylsulfuric Acid Market Revenues & Volume By Other for the Period 2022-2032F
- Historical Data and Forecast of Indonesia Nitrosylsulfuric Acid Market Revenues & Volume By Application for the Period 2022-2032F
- Historical Data and Forecast of Indonesia Nitrosylsulfuric Acid Market Revenues & Volume By Dyes Intermediate for the Period 2022-2032F
- Historical Data and Forecast of Indonesia Nitrosylsulfuric Acid Market Revenues & Volume By Other for the Period 2022-2032F
- Indonesia Nitrosylsulfuric Acid Import Export Trade Statistics
- Market Opportunity Assessment By Type
- Market Opportunity Assessment By Application
- Indonesia Nitrosylsulfuric Acid Top Companies Market Share
- Indonesia Nitrosylsulfuric Acid Competitive Benchmarking By Technical and Operational Parameters
- Indonesia Nitrosylsulfuric Acid Company Profiles
- Indonesia Nitrosylsulfuric Acid Key Strategic Recommendations
Frequently Asked Questions About the Market Study (FAQs):
The growth is primarily driven by increasing demand from automotive, electronics, and pharmaceutical sectors that rely on nitrosylsulfuric acid for various applications, coupled with environmental regulations that encourage its use.
Although the pandemic initially caused disruptions across sectors, the nitrosylsulfuric acid market experienced a moderate impact since the product is considered essential. Post-lockdown, demand surged, particularly due to export restrictions from key producers.
The market was estimated at USD 169 Million in 2025 and is projected to reach USD 223 Million by 2032, growing at a CAGR of 4.0% from 2026 to 2032.
The Indonesian government is implementing tax incentives and establishing dedicated research and development clusters to promote innovation and attract investments in the nitrosylsulfuric acid sector.
Companies face challenges such as fluctuating raw material prices and compliance with stringent safety regulations, which could impact operational costs and market competitiveness.
Manufacturers are focusing on product innovations and enhanced production methodologies to improve efficiency and sustainability, thereby aligning with current market demands.
6Wresearch actively monitors the Indonesia Nitrosylsulfuric Acid Market and publishes its comprehensive annual report, highlighting emerging trends, growth drivers, revenue analysis, and forecast outlook. Our insights help businesses to make data-backed strategic decisions with ongoing market dynamics. Our analysts track relevent industries related to the Indonesia Nitrosylsulfuric Acid Market, allowing our clients with actionable intelligence and reliable forecasts tailored to emerging regional needs.
Yes, we provide customisation as per your requirements. To learn more, feel free to contact us on sales@6wresearch.com
1 Executive Summary |
2 Introduction |
2.1 Key Highlights of the Report |
2.2 Report Description |
2.3 Market Scope & Segmentation |
2.4 Research Methodology |
2.5 Assumptions |
3 Indonesia Nitrosylsulfuric Acid Market Overview |
3.1 Indonesia Country Macro Economic Indicators |
3.2 Indonesia Nitrosylsulfuric Acid Market Revenues & Volume, 2022 & 2032F |
3.3 Indonesia Nitrosylsulfuric Acid Market - Industry Life Cycle |
3.4 Indonesia Nitrosylsulfuric Acid Market - Porter's Five Forces |
3.5 Indonesia Nitrosylsulfuric Acid Market Revenues & Volume Share, By Type, 2022 & 2032F |
3.6 Indonesia Nitrosylsulfuric Acid Market Revenues & Volume Share, By Application, 2022 & 2032F |
4 Indonesia Nitrosylsulfuric Acid Market Dynamics |
4.1 Impact Analysis |
4.2 Market Drivers |
4.2.1 Increasing demand from industries such as pharmaceuticals, agriculture, and chemical manufacturing |
4.2.2 Growing awareness about the benefits and applications of nitrosylsulfuric acid |
4.2.3 Favorable government regulations supporting the use of nitrosylsulfuric acid in various sectors |
4.3 Market Restraints |
4.3.1 Volatility in raw material prices impacting production costs |
4.3.2 Environmental concerns related to the usage and disposal of nitrosylsulfuric acid |
4.3.3 Competition from alternative chemicals or technologies |
5 Indonesia Nitrosylsulfuric Acid Market Trends |
6 Indonesia Nitrosylsulfuric Acid Market, By Types |
6.1 Indonesia Nitrosylsulfuric Acid Market, By Type |
6.1.1 Overview and Analysis |
6.1.2 Indonesia Nitrosylsulfuric Acid Market Revenues & Volume, By Type, 2022-2032F |
6.1.3 Indonesia Nitrosylsulfuric Acid Market Revenues & Volume, By 40% Solution, 2022-2032F |
6.1.4 Indonesia Nitrosylsulfuric Acid Market Revenues & Volume, By Other, 2022-2032F |
6.2 Indonesia Nitrosylsulfuric Acid Market, By Application |
6.2.1 Overview and Analysis |
6.2.2 Indonesia Nitrosylsulfuric Acid Market Revenues & Volume, By Dyes Intermediate, 2022-2032F |
6.2.3 Indonesia Nitrosylsulfuric Acid Market Revenues & Volume, By Other, 2022-2032F |
7 Indonesia Nitrosylsulfuric Acid Market Import-Export Trade Statistics |
7.1 Indonesia Nitrosylsulfuric Acid Market Export to Major Countries |
7.2 Indonesia Nitrosylsulfuric Acid Market Imports from Major Countries |
8 Indonesia Nitrosylsulfuric Acid Market Key Performance Indicators |
8.1 Research and development investment in new applications or formulations of nitrosylsulfuric acid |
8.2 Number of partnerships or collaborations with key industry players to expand market reach |
8.3 Percentage of market growth in niche sectors where nitrosylsulfuric acid is gaining traction |
8.4 Rate of adoption of sustainable practices in the production and use of nitrosylsulfuric acid |
9 Indonesia Nitrosylsulfuric Acid Market - Opportunity Assessment |
9.1 Indonesia Nitrosylsulfuric Acid Market Opportunity Assessment, By Type, 2022 & 2032F |
9.2 Indonesia Nitrosylsulfuric Acid Market Opportunity Assessment, By Application, 2022 & 2032F |
10 Indonesia Nitrosylsulfuric Acid Market - Competitive Landscape |
10.1 Indonesia Nitrosylsulfuric Acid Market Revenue Share, By Companies, 2025 |
10.2 Indonesia Nitrosylsulfuric Acid Market Competitive Benchmarking, By Operating and Technical Parameters |
11 Company Profiles |
12 Recommendations |
13 Disclaimer |
Global Go To Market Strategy - 2030
Export potential enables firms to identify high-growth global markets with greater confidence by combining advanced trade intelligence with a structured quantitative methodology. The framework analyzes emerging demand trends and country-level import patterns while integrating macroeconomic and trade datasets such as GDP and population forecasts, bilateral import–export flows, tariff structures, elasticity differentials between developed and developing economies, geographic distance, and import demand projections. Using weighted trade values from 2020–2024 as the base period to project country-to-country export potential for 2030, these inputs are operationalized through calculated drivers such as gravity model parameters, tariff impact factors, and projected GDP per-capita growth. Through an analysis of hidden potentials, demand hotspots, and market conditions that are most favorable to success, this method enables firms to focus on target countries, maximize returns, and global expansion with data, backed by accuracy.
By factoring in the projected importer demand gap that is currently unmet and could be potential opportunity, it identifies the potential for the Exporter (Country) among 190 countries, against the general trade analysis, which identifies the biggest importer or exporter.
To discover high-growth global markets and optimize your business strategy:
Click Here
Pricing
- Single User License$ 1,995
- Department License$ 2,400
- Site License$ 3,120
- Global License$ 3,795

Leadership Perspectives from Industry Events
Search
Thought Leadership and Analyst Meet


Our Clients
6WResearch In News
- India Air Conditioner Market Set for Strong Rebound in 2026 After Weather-Led Correction and GST-Driven Recovery: 6Wresearch
- ADAS in India: How Automatic Emergency Braking, Blind Spot Detection & Driver Monitoring are Transforming Road Safety
- Doha a strategic location for EV manufacturing hub: IPA Qatar
- Demand for luxury TVs surging in the GCC, says Samsung
- Empowering Growth: The Thriving Journey of Bangladesh’s Cable Industry
- Demand for luxury TVs surging in the GCC, says Samsung
Latest Reports
- Nicaragua RPG Gaming Market (2026-2032)
- New Zealand RPG Gaming Market (2026-2032)
- Netherlands RPG Gaming Market (2026-2032)
- Nauru RPG Gaming Market (2026-2032)
- Namibia RPG Gaming Market (2026-2032)
- Mozambique RPG Gaming Market (2026-2032)
- Montenegro RPG Gaming Market (2026-2032)
- Mongolia RPG Gaming Market (2026-2032)
- Monaco RPG Gaming Market (2026-2032)
- Micronesia RPG Gaming Market (2026-2032)
Industry Events and Analyst Meet

EV India Expo 2026

HIMTEX 2026

India Refining Summit 2026

India EV Show 2026

EV tech India Expo 2026
Whitepaper
- Middle East & Africa Commercial Security Market Click here to view more.
- Middle East & Africa Fire Safety Systems & Equipment Market Click here to view more.
- GCC Drone Market Click here to view more.
- Middle East Lighting Fixture Market Click here to view more.
- GCC Physical & Perimeter Security Market Click here to view more.