Indonesia Non-Meat Ingredients Market (2026-2032) Outlook | Value, Companies, Trends, Share, Analysis, Revenue, Growth, Size, Forecast & Industry
Market Forecast By Ingredient (Binders, Extenders, Fillers, Coloring & Flavoring Agents, Salts & Preservatives), By Type (Beef, Pork, Mutton, Poultry), By Source (Chemical substances, Plant origin, Animal origin), By Product Type (Fresh Processed Meat, Raw-Cooked Meat, Pre-Cooked Meat, Raw Fermented Sausages, Cured Meat, Dried Meat) And Competitive Landscape
| Product Code: ETC4537709 | Publication Date: Jul 2023 | Updated Date: Mar 2026 | Product Type: Report | |
| Publisher: 6Wresearch | Author: Ravi Bhandari | No. of Pages: 85 | No. of Figures: 45 | No. of Tables: 25 |
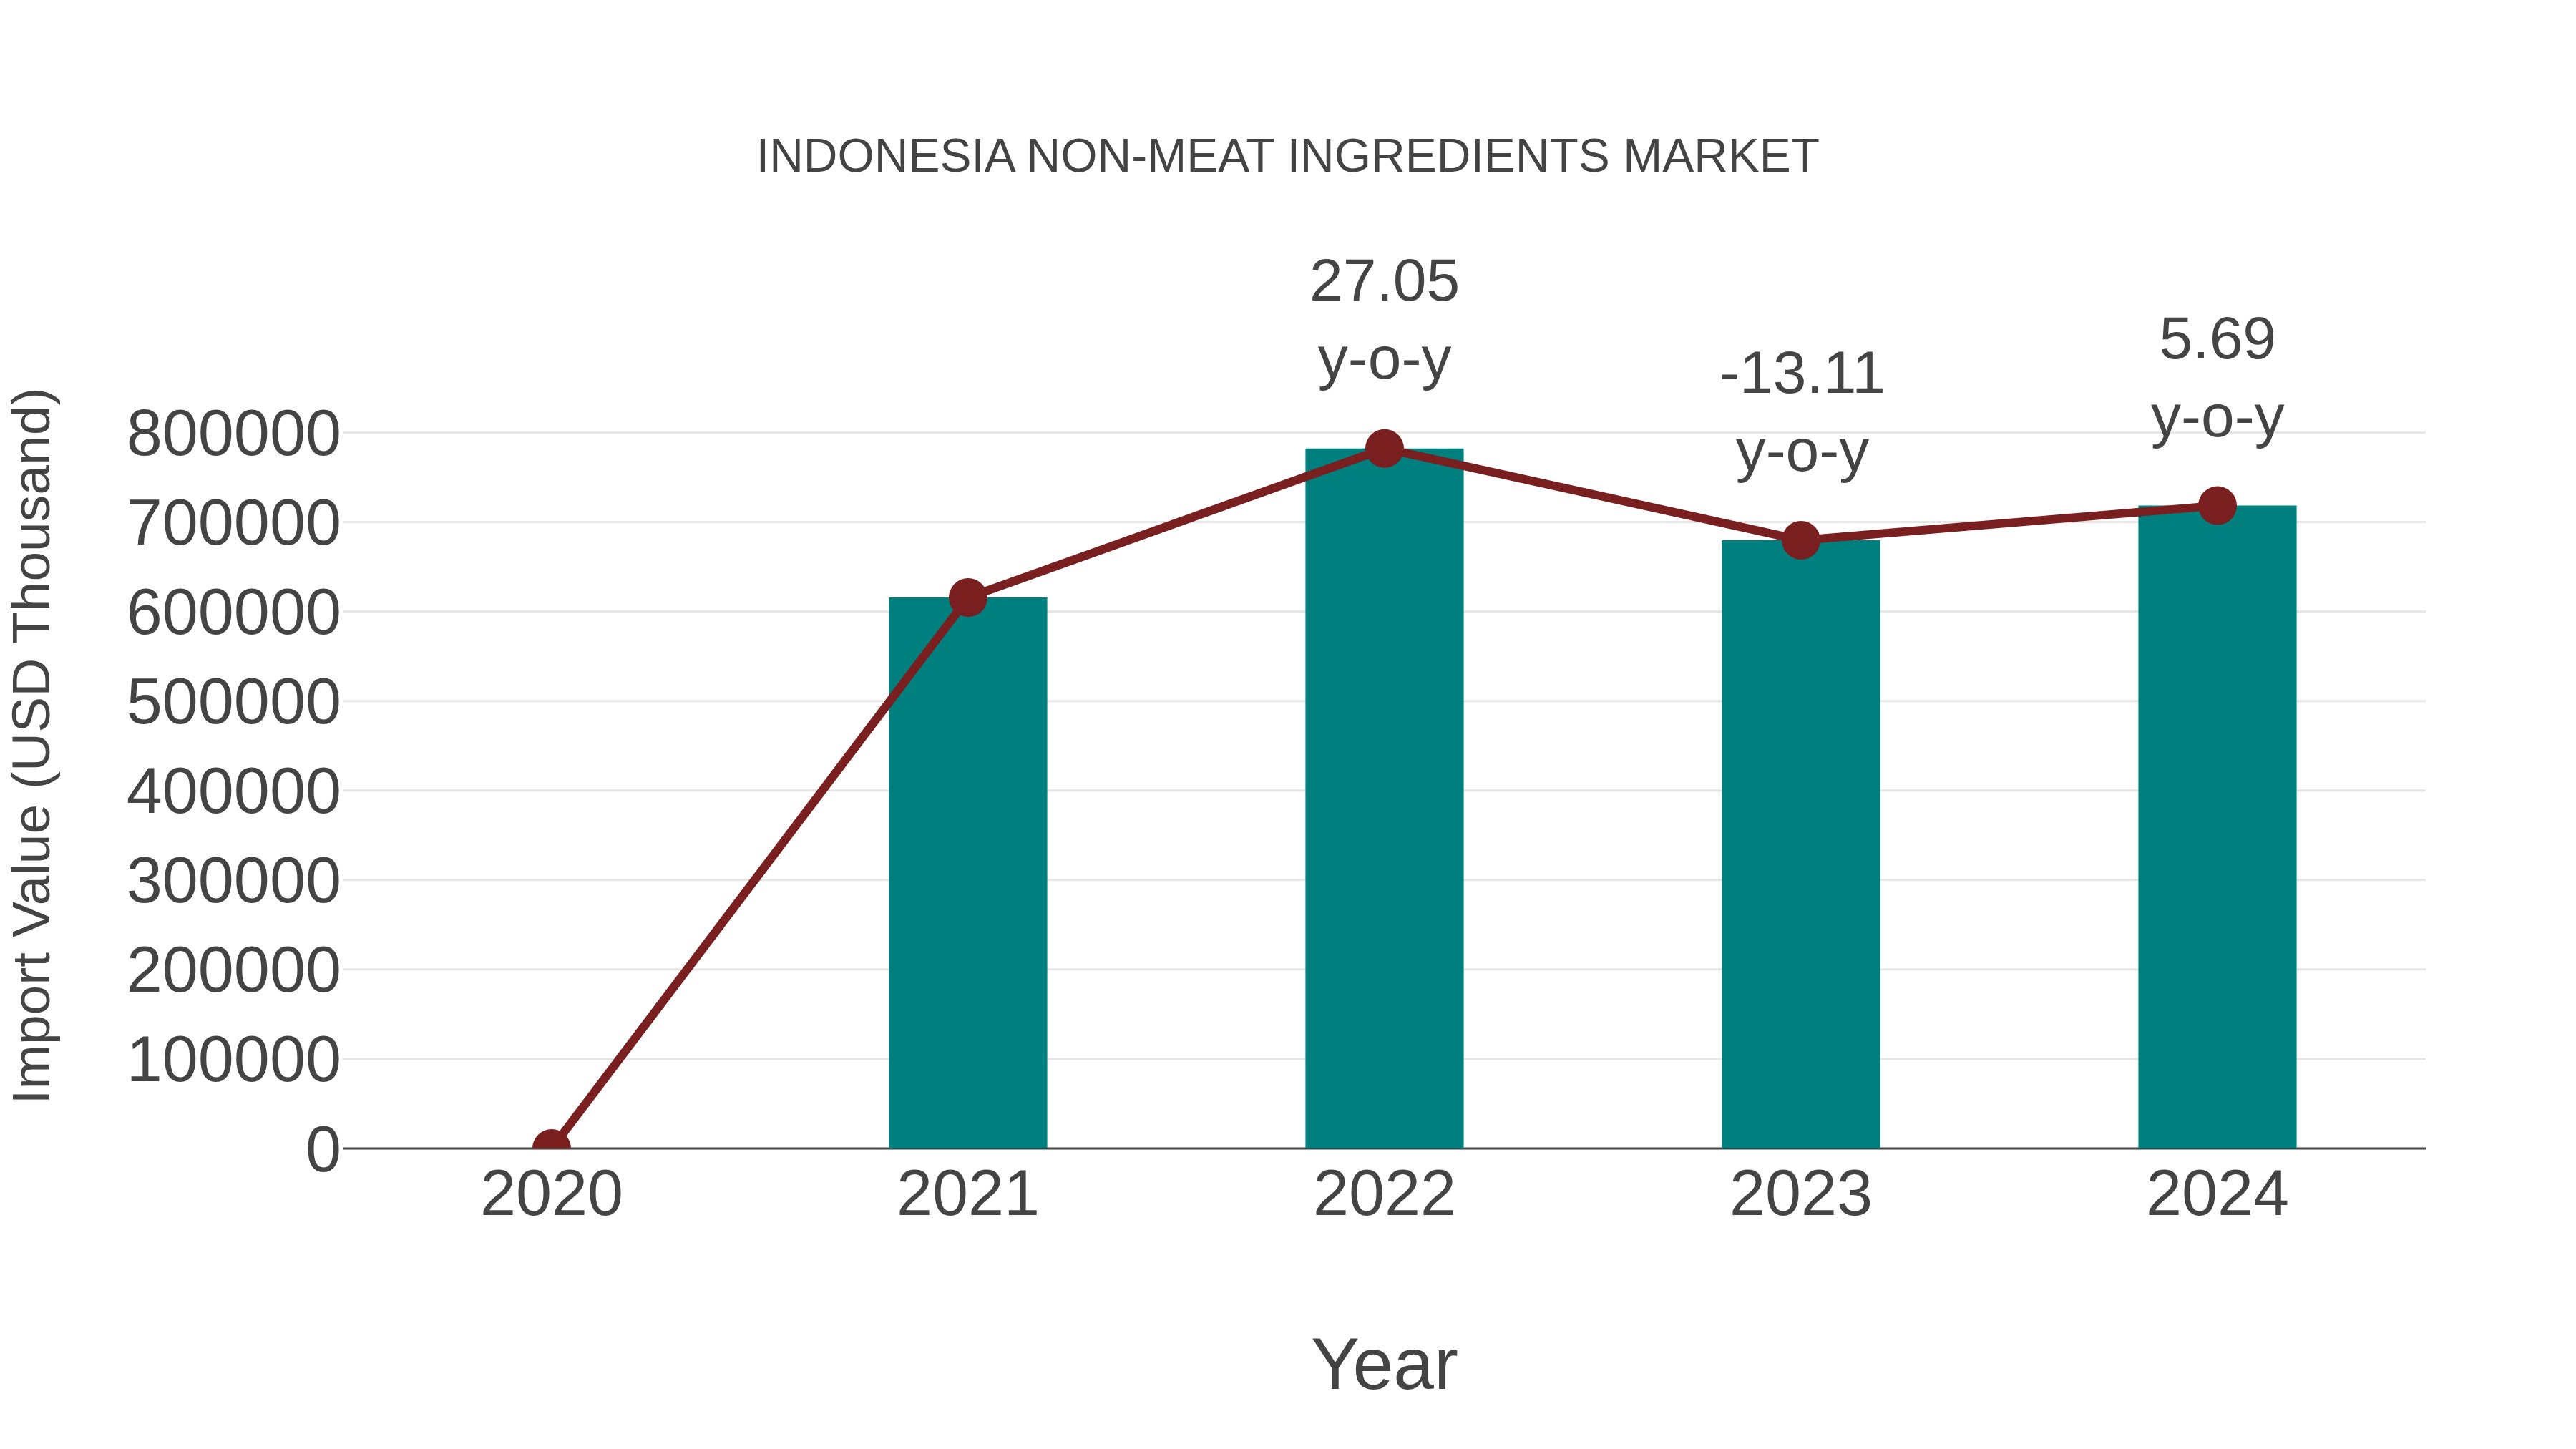
Indonesia Non-meat Ingredients Market: Import Trend Analysis
In the Indonesia non-meat ingredients market, the import trend exhibited a growth rate of 5.69% from 2023 to 2024, with a compound annual growth rate (CAGR) of 5.28% for the period 2020-2024. This momentum could be attributed to the increasing demand for diverse ingredients driven by evolving consumer preferences and a stable market environment.
Indonesia Non Meat Ingredients Market Overview
As the demand for meat alternatives increases, the non-meat ingredients market is thriving in Indonesia. This market caters to the growing trend of plant-based and vegetarian diets.
Drivers of the Market
A shift towards healthier dietary choices, driven by concerns about environmental sustainability and personal well-being, has propelled the non-meat ingredients market in Indonesia. Consumers are increasingly seeking plant-based protein alternatives for health benefits and to reduce their ecological footprint. The rise in flexitarian and vegetarian lifestyles has further accelerated the demand for non-meat ingredients in various food products.
Challenges of the Market
The Indonesian non-meat ingredients market confronts challenges such as limited consumer awareness about the benefits of non-meat alternatives and their environmental impact. Educating consumers about the advantages of these products is a pressing issue. Quality control and consistency in non-meat ingredients, such as plant-based protein sources, are essential to maintain consumer trust. Regulatory compliance and labeling requirements can be complex, especially when it comes to allergen information and ingredient sourcing. Competition with traditional meat products remains a hurdle in gaining market share.
COVID-19 Impacts on the Market
The non-meat ingredients market, particularly plant-based meat substitutes, gained momentum during the pandemic as people sought alternatives to traditional meat products.
Key Players of the Makret
Players like Kerry Group and Ingredion operate in the non-meat ingredients market, providing innovative solutions for meat alternatives and plant-based products.
Key Highlights of the Report:
- Indonesia Non-Meat Ingredients Market Outlook
- Market Size of Indonesia Non-Meat Ingredients Market, 2025
- Forecast of Indonesia Non-Meat Ingredients Market, 2032
- Historical Data and Forecast of Indonesia Non-Meat Ingredients Revenues & Volume for the Period 2022-2032F
- Indonesia Non-Meat Ingredients Market Trend Evolution
- Indonesia Non-Meat Ingredients Market Drivers and Challenges
- Indonesia Non-Meat Ingredients Price Trends
- Indonesia Non-Meat Ingredients Porter's Five Forces
- Indonesia Non-Meat Ingredients Industry Life Cycle
- Historical Data and Forecast of Indonesia Non-Meat Ingredients Market Revenues & Volume By Ingredient for the Period 2022-2032F
- Historical Data and Forecast of Indonesia Non-Meat Ingredients Market Revenues & Volume By Binders for the Period 2022-2032F
- Historical Data and Forecast of Indonesia Non-Meat Ingredients Market Revenues & Volume By Extenders for the Period 2022-2032F
- Historical Data and Forecast of Indonesia Non-Meat Ingredients Market Revenues & Volume By Fillers for the Period 2022-2032F
- Historical Data and Forecast of Indonesia Non-Meat Ingredients Market Revenues & Volume By Coloring & Flavoring Agents for the Period 2022-2032F
- Historical Data and Forecast of Indonesia Non-Meat Ingredients Market Revenues & Volume By Salts & Preservatives for the Period 2022-2032F
- Historical Data and Forecast of Indonesia Non-Meat Ingredients Market Revenues & Volume By Type for the Period 2022-2032F
- Historical Data and Forecast of Indonesia Non-Meat Ingredients Market Revenues & Volume By Beef for the Period 2022-2032F
- Historical Data and Forecast of Indonesia Non-Meat Ingredients Market Revenues & Volume By Pork for the Period 2022-2032F
- Historical Data and Forecast of Indonesia Non-Meat Ingredients Market Revenues & Volume By Mutton for the Period 2022-2032F
- Historical Data and Forecast of Indonesia Non-Meat Ingredients Market Revenues & Volume By Poultry for the Period 2022-2032F
- Historical Data and Forecast of Indonesia Non-Meat Ingredients Market Revenues & Volume By Source for the Period 2022-2032F
- Historical Data and Forecast of Indonesia Non-Meat Ingredients Market Revenues & Volume By Chemical substances for the Period 2022-2032F
- Historical Data and Forecast of Indonesia Non-Meat Ingredients Market Revenues & Volume By Plant origin for the Period 2022-2032F
- Historical Data and Forecast of Indonesia Non-Meat Ingredients Market Revenues & Volume By Animal origin for the Period 2022-2032F
- Historical Data and Forecast of Indonesia Non-Meat Ingredients Market Revenues & Volume By Product Type for the Period 2022-2032F
- Historical Data and Forecast of Indonesia Non-Meat Ingredients Market Revenues & Volume By Fresh Processed Meat for the Period 2022-2032F
- Historical Data and Forecast of Indonesia Non-Meat Ingredients Market Revenues & Volume By Raw-Cooked Meat for the Period 2022-2032F
- Historical Data and Forecast of Indonesia Non-Meat Ingredients Market Revenues & Volume By Pre-Cooked Meat for the Period 2022-2032F
- Historical Data and Forecast of Indonesia Non-Meat Ingredients Market Revenues & Volume By Raw Fermented Sausages for the Period 2022-2032F
- Historical Data and Forecast of Indonesia Non-Meat Ingredients Market Revenues & Volume By Cured Meat for the Period 2022-2032F
- Historical Data and Forecast of Indonesia Non-Meat Ingredients Market Revenues & Volume By Dried Meat for the Period 2022-2032F
- Indonesia Non-Meat Ingredients Import Export Trade Statistics
- Market Opportunity Assessment By Ingredient
- Market Opportunity Assessment By Type
- Market Opportunity Assessment By Source
- Market Opportunity Assessment By Product Type
- Indonesia Non-Meat Ingredients Top Companies Market Share
- Indonesia Non-Meat Ingredients Competitive Benchmarking By Technical and Operational Parameters
- Indonesia Non-Meat Ingredients Company Profiles
- Indonesia Non-Meat Ingredients Key Strategic Recommendations
Indonesia Non-Meat Ingredients Market (2026-2032): FAQs
6Wresearch actively monitors the Indonesia Non-Meat Ingredients Market and publishes its comprehensive annual report, highlighting emerging trends, growth drivers, revenue analysis, and forecast outlook. Our insights help businesses to make data-backed strategic decisions with ongoing market dynamics. Our analysts track relevent industries related to the Indonesia Non-Meat Ingredients Market, allowing our clients with actionable intelligence and reliable forecasts tailored to emerging regional needs.
Yes, we provide customisation as per your requirements. To learn more, feel free to contact us on sales@6wresearch.com
1 Executive Summary |
2 Introduction |
2.1 Key Highlights of the Report |
2.2 Report Description |
2.3 Market Scope & Segmentation |
2.4 Research Methodology |
2.5 Assumptions |
3 Indonesia Non-Meat Ingredients Market Overview |
3.1 Indonesia Country Macro Economic Indicators |
3.2 Indonesia Non-Meat Ingredients Market Revenues & Volume, 2022 & 2032F |
3.3 Indonesia Non-Meat Ingredients Market - Industry Life Cycle |
3.4 Indonesia Non-Meat Ingredients Market - Porter's Five Forces |
3.5 Indonesia Non-Meat Ingredients Market Revenues & Volume Share, By Ingredient, 2022 & 2032F |
3.6 Indonesia Non-Meat Ingredients Market Revenues & Volume Share, By Type, 2022 & 2032F |
3.7 Indonesia Non-Meat Ingredients Market Revenues & Volume Share, By Source, 2022 & 2032F |
3.8 Indonesia Non-Meat Ingredients Market Revenues & Volume Share, By Product Type, 2022 & 2032F |
4 Indonesia Non-Meat Ingredients Market Dynamics |
4.1 Impact Analysis |
4.2 Market Drivers |
4.2.1 Increasing health consciousness and dietary preferences towards plant-based diets |
4.2.2 Growing awareness about the environmental impact of meat consumption |
4.2.3 Rising demand for meat alternatives due to ethical concerns and animal welfare |
4.3 Market Restraints |
4.3.1 High competition from established meat-based products |
4.3.2 Limited consumer awareness about non-meat ingredients and their benefits |
5 Indonesia Non-Meat Ingredients Market Trends |
6 Indonesia Non-Meat Ingredients Market, By Types |
6.1 Indonesia Non-Meat Ingredients Market, By Ingredient |
6.1.1 Overview and Analysis |
6.1.2 Indonesia Non-Meat Ingredients Market Revenues & Volume, By Ingredient, 2022-2032F |
6.1.3 Indonesia Non-Meat Ingredients Market Revenues & Volume, By Binders, 2022-2032F |
6.1.4 Indonesia Non-Meat Ingredients Market Revenues & Volume, By Extenders, 2022-2032F |
6.1.5 Indonesia Non-Meat Ingredients Market Revenues & Volume, By Fillers, 2022-2032F |
6.1.6 Indonesia Non-Meat Ingredients Market Revenues & Volume, By Coloring & Flavoring Agents, 2022-2032F |
6.1.7 Indonesia Non-Meat Ingredients Market Revenues & Volume, By Salts & Preservatives, 2022-2032F |
6.2 Indonesia Non-Meat Ingredients Market, By Type |
6.2.1 Overview and Analysis |
6.2.2 Indonesia Non-Meat Ingredients Market Revenues & Volume, By Beef, 2022-2032F |
6.2.3 Indonesia Non-Meat Ingredients Market Revenues & Volume, By Pork, 2022-2032F |
6.2.4 Indonesia Non-Meat Ingredients Market Revenues & Volume, By Mutton, 2022-2032F |
6.2.5 Indonesia Non-Meat Ingredients Market Revenues & Volume, By Poultry, 2022-2032F |
6.3 Indonesia Non-Meat Ingredients Market, By Source |
6.3.1 Overview and Analysis |
6.3.2 Indonesia Non-Meat Ingredients Market Revenues & Volume, By Chemical substances, 2022-2032F |
6.3.3 Indonesia Non-Meat Ingredients Market Revenues & Volume, By Plant origin, 2022-2032F |
6.3.4 Indonesia Non-Meat Ingredients Market Revenues & Volume, By Animal origin, 2022-2032F |
6.4 Indonesia Non-Meat Ingredients Market, By Product Type |
6.4.1 Overview and Analysis |
6.4.2 Indonesia Non-Meat Ingredients Market Revenues & Volume, By Fresh Processed Meat, 2022-2032F |
6.4.3 Indonesia Non-Meat Ingredients Market Revenues & Volume, By Raw-Cooked Meat, 2022-2032F |
6.4.4 Indonesia Non-Meat Ingredients Market Revenues & Volume, By Pre-Cooked Meat, 2022-2032F |
6.4.5 Indonesia Non-Meat Ingredients Market Revenues & Volume, By Raw Fermented Sausages, 2022-2032F |
6.4.6 Indonesia Non-Meat Ingredients Market Revenues & Volume, By Cured Meat, 2022-2032F |
6.4.7 Indonesia Non-Meat Ingredients Market Revenues & Volume, By Dried Meat, 2022-2032F |
7 Indonesia Non-Meat Ingredients Market Import-Export Trade Statistics |
7.1 Indonesia Non-Meat Ingredients Market Export to Major Countries |
7.2 Indonesia Non-Meat Ingredients Market Imports from Major Countries |
8 Indonesia Non-Meat Ingredients Market Key Performance Indicators |
8.1 Number of new product launches in the non-meat ingredients segment |
8.2 Growth in the number of vegetarian and vegan restaurants in Indonesia |
8.3 Increase in the adoption of non-meat ingredients by foodservice providers |
8.4 Investment in research and development for innovative non-meat ingredient products |
8.5 Consumer surveys on willingness to try and purchase non-meat ingredient products |
9 Indonesia Non-Meat Ingredients Market - Opportunity Assessment |
9.1 Indonesia Non-Meat Ingredients Market Opportunity Assessment, By Ingredient, 2022 & 2032F |
9.2 Indonesia Non-Meat Ingredients Market Opportunity Assessment, By Type, 2022 & 2032F |
9.3 Indonesia Non-Meat Ingredients Market Opportunity Assessment, By Source, 2022 & 2032F |
9.4 Indonesia Non-Meat Ingredients Market Opportunity Assessment, By Product Type, 2022 & 2032F |
10 Indonesia Non-Meat Ingredients Market - Competitive Landscape |
10.1 Indonesia Non-Meat Ingredients Market Revenue Share, By Companies, 2025 |
10.2 Indonesia Non-Meat Ingredients Market Competitive Benchmarking, By Operating and Technical Parameters |
11 Company Profiles |
12 Recommendations |
13 Disclaimer |
Export potential assessment - trade Analytics for 2030
Export potential enables firms to identify high-growth global markets with greater confidence by combining advanced trade intelligence with a structured quantitative methodology. The framework analyzes emerging demand trends and country-level import patterns while integrating macroeconomic and trade datasets such as GDP and population forecasts, bilateral import–export flows, tariff structures, elasticity differentials between developed and developing economies, geographic distance, and import demand projections. Using weighted trade values from 2020–2024 as the base period to project country-to-country export potential for 2030, these inputs are operationalized through calculated drivers such as gravity model parameters, tariff impact factors, and projected GDP per-capita growth. Through an analysis of hidden potentials, demand hotspots, and market conditions that are most favorable to success, this method enables firms to focus on target countries, maximize returns, and global expansion with data, backed by accuracy.
By factoring in the projected importer demand gap that is currently unmet and could be potential opportunity, it identifies the potential for the Exporter (Country) among 190 countries, against the general trade analysis, which identifies the biggest importer or exporter.
To discover high-growth global markets and optimize your business strategy:
Click Here
Pricing
- Single User License$ 1,995
- Department License$ 2,400
- Site License$ 3,120
- Global License$ 3,795

Thought Leadership
Search
Thought Leadership and Analyst Meet


Our Clients
Latest Reports
- New Zealand Aseptic Manufacturing Market (2026-2032)
- Netherlands Aseptic Manufacturing Market (2026-2032)
- Nauru Aseptic Manufacturing Market (2026-2032)
- Namibia Aseptic Manufacturing Market (2026-2032)
- Mozambique Aseptic Manufacturing Market (2026-2032)
- Montenegro Aseptic Manufacturing Market (2026-2032)
- Mongolia Aseptic Manufacturing Market (2026-2032)
- Monaco Aseptic Manufacturing Market (2026-2032)
- Micronesia Aseptic Manufacturing Market (2026-2032)
- Mauritius Aseptic Manufacturing Market (2026-2032)
Industry Events and Analyst Meet

HIMTEX 2026

India Refining Summit 2026

India EV Show 2026

EV tech India Expo 2026

Auto Tech Asia 2026
Whitepaper
- Middle East & Africa Commercial Security Market Click here to view more.
- Middle East & Africa Fire Safety Systems & Equipment Market Click here to view more.
- GCC Drone Market Click here to view more.
- Middle East Lighting Fixture Market Click here to view more.
- GCC Physical & Perimeter Security Market Click here to view more.
6WResearch In News
- Doha a strategic location for EV manufacturing hub: IPA Qatar
- Demand for luxury TVs surging in the GCC, says Samsung
- Empowering Growth: The Thriving Journey of Bangladesh’s Cable Industry
- Demand for luxury TVs surging in the GCC, says Samsung
- Video call with a traditional healer? Once unthinkable, it’s now common in South Africa
- Intelligent Buildings To Smooth GCC’s Path To Net Zero