Indonesia Oil & Gas Processing Seals Market (2026-2032) Outlook | Revenue, Analysis, Trends, Forecast, Growth, Value, Companies, Industry, Size & Share
Market Forecast By Type (Single, Double), By Material (Metal, Elastomer, Face Material) And Competitive Landscape
| Product Code: ETC4494629 | Publication Date: Jul 2023 | Updated Date: Mar 2026 | Product Type: Report | |
| Publisher: 6Wresearch | Author: Ravi Bhandari | No. of Pages: 85 | No. of Figures: 45 | No. of Tables: 25 |
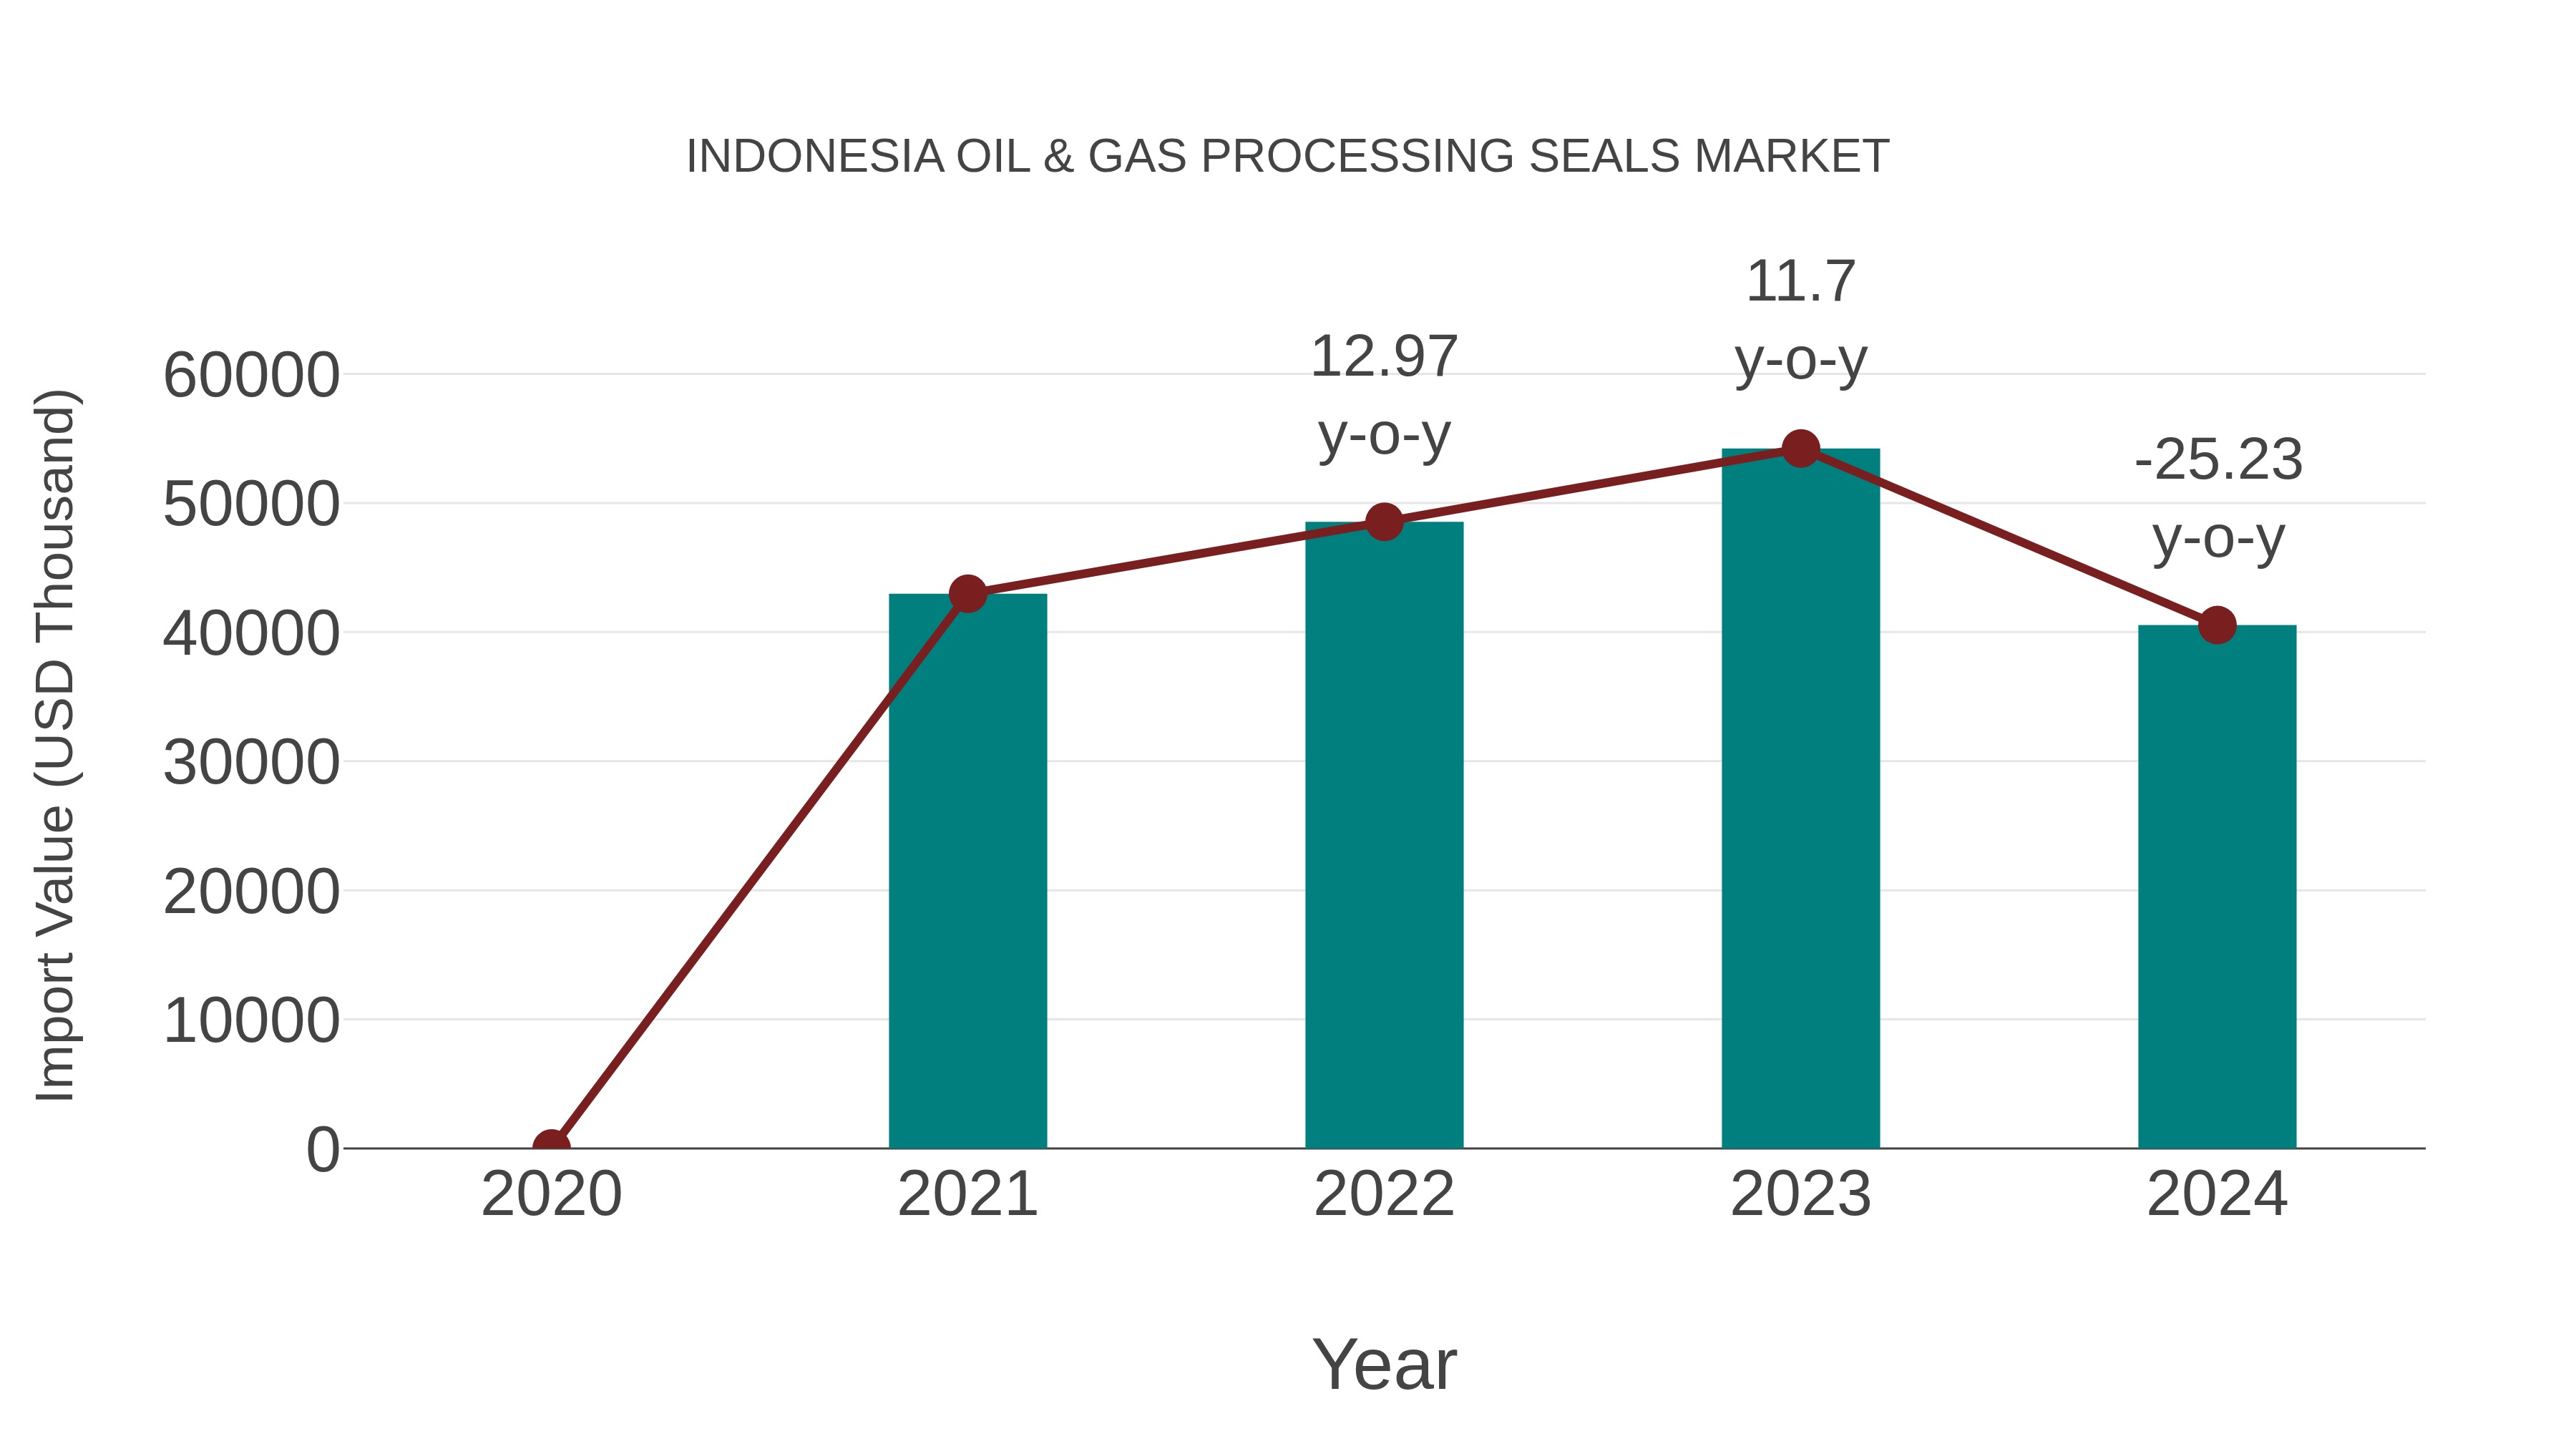
Indonesia Oil & Gas Processing Seals Market: Import Trend Analysis
In the Indonesia oil & gas processing seals market, the import trend showed a notable decline from 2023 to 2024, with a growth rate of -25.23%. The compound annual growth rate (CAGR) for the period 2020-2024 stood at -1.92%. This negative import momentum may be attributed to shifts in demand dynamics or market instability affecting the sector.
Indonesia Oil Gas Processing Seals Market Overview
The Indonesia Oil and Gas Processing Seals market is a pivotal segment in the country`s energy industry. As Indonesia continues to be a significant player in the oil and gas sector, the demand for reliable and efficient seals for processing equipment remains high. The market is closely tied to the nation`s energy security, and with growing energy demands, the sector is expected to see steady growth.
Drivers of the Market
The Indonesia oil and gas processing seals market is closely tied to the country`s energy industry. Seals play a vital role in preventing leaks and ensuring the safety and efficiency of oil and gas processing equipment. The market is driven by the continuous exploration and production activities in the oil and gas sector, as well as the need to maintain the integrity of processing facilities, pipelines, and transportation infrastructure.
Challenges of the Market
In the oil and gas industry, seals must withstand extreme conditions. Challenges include developing seals that can withstand high pressure, temperature, and corrosive environments. The market needs constant innovation to meet the industry`s evolving needs.
COVID-19 Impacts on the Market
The COVID-19 pandemic had a considerable impact on the Indonesia oil and gas processing seals market. The oil and gas industry faced challenges due to reduced demand, price volatility, and supply chain disruptions. Many oil and gas projects were postponed or scaled back, impacting the demand for sealing solutions. The market is now recovering as oil and gas prices stabilize and energy demand gradually rebounds. The industry is also placing a greater emphasis on cost-effective and reliable sealing solutions in the post-pandemic period.
Key Players of the Makret
In the Indonesia oil and gas processing seals market, companies like PT. Oilseal Indonesia and PT. SealNobel Oil & Gas provide high-performance seals and sealing solutions for the oil and gas industry. Their expertise in addressing the demanding requirements of this sector makes them key players in the market.
Key Highlights of the Report:
- Indonesia Oil & Gas Processing Seals Market Outlook
- Market Size of Indonesia Oil & Gas Processing Seals Market, 2025
- Forecast of Indonesia Oil & Gas Processing Seals Market, 2032
- Historical Data and Forecast of Indonesia Oil & Gas Processing Seals Revenues & Volume for the Period 2022-2032F
- Indonesia Oil & Gas Processing Seals Market Trend Evolution
- Indonesia Oil & Gas Processing Seals Market Drivers and Challenges
- Indonesia Oil & Gas Processing Seals Price Trends
- Indonesia Oil & Gas Processing Seals Porter's Five Forces
- Indonesia Oil & Gas Processing Seals Industry Life Cycle
- Historical Data and Forecast of Indonesia Oil & Gas Processing Seals Market Revenues & Volume By Type for the Period 2022-2032F
- Historical Data and Forecast of Indonesia Oil & Gas Processing Seals Market Revenues & Volume By Single for the Period 2022-2032F
- Historical Data and Forecast of Indonesia Oil & Gas Processing Seals Market Revenues & Volume By Double for the Period 2022-2032F
- Historical Data and Forecast of Indonesia Oil & Gas Processing Seals Market Revenues & Volume By Material for the Period 2022-2032F
- Historical Data and Forecast of Indonesia Oil & Gas Processing Seals Market Revenues & Volume By Metal for the Period 2022-2032F
- Historical Data and Forecast of Indonesia Oil & Gas Processing Seals Market Revenues & Volume By Elastomer for the Period 2022-2032F
- Historical Data and Forecast of Indonesia Oil & Gas Processing Seals Market Revenues & Volume By Face Material for the Period 2022-2032F
- Indonesia Oil & Gas Processing Seals Import Export Trade Statistics
- Market Opportunity Assessment By Type
- Market Opportunity Assessment By Material
- Indonesia Oil & Gas Processing Seals Top Companies Market Share
- Indonesia Oil & Gas Processing Seals Competitive Benchmarking By Technical and Operational Parameters
- Indonesia Oil & Gas Processing Seals Company Profiles
- Indonesia Oil & Gas Processing Seals Key Strategic Recommendations
Indonesia Oil & Gas Processing Seals Market (2026-2032): FAQs
6Wresearch actively monitors the Indonesia Oil & Gas Processing Seals Market and publishes its comprehensive annual report, highlighting emerging trends, growth drivers, revenue analysis, and forecast outlook. Our insights help businesses to make data-backed strategic decisions with ongoing market dynamics. Our analysts track relevent industries related to the Indonesia Oil & Gas Processing Seals Market, allowing our clients with actionable intelligence and reliable forecasts tailored to emerging regional needs.
Yes, we provide customisation as per your requirements. To learn more, feel free to contact us on sales@6wresearch.com
1 Executive Summary |
2 Introduction |
2.1 Key Highlights of the Report |
2.2 Report Description |
2.3 Market Scope & Segmentation |
2.4 Research Methodology |
2.5 Assumptions |
3 Indonesia Oil & Gas Processing Seals Market Overview |
3.1 Indonesia Country Macro Economic Indicators |
3.2 Indonesia Oil & Gas Processing Seals Market Revenues & Volume, 2022 & 2032F |
3.3 Indonesia Oil & Gas Processing Seals Market - Industry Life Cycle |
3.4 Indonesia Oil & Gas Processing Seals Market - Porter's Five Forces |
3.5 Indonesia Oil & Gas Processing Seals Market Revenues & Volume Share, By Type, 2022 & 2032F |
3.6 Indonesia Oil & Gas Processing Seals Market Revenues & Volume Share, By Material, 2022 & 2032F |
4 Indonesia Oil & Gas Processing Seals Market Dynamics |
4.1 Impact Analysis |
4.2 Market Drivers |
4.2.1 Increasing demand for oil and gas globally, driving the need for more processing activities |
4.2.2 Technological advancements in oil and gas processing seals, leading to higher efficiency and reliability |
4.2.3 Government initiatives and investments in the oil and gas sector in Indonesia |
4.3 Market Restraints |
4.3.1 Fluctuating oil prices affecting investment decisions and project viability |
4.3.2 Environmental concerns and regulations impacting the oil and gas industry |
4.3.3 Competition from alternative energy sources affecting the demand for traditional oil and gas processing |
5 Indonesia Oil & Gas Processing Seals Market Trends |
6 Indonesia Oil & Gas Processing Seals Market, By Types |
6.1 Indonesia Oil & Gas Processing Seals Market, By Type |
6.1.1 Overview and Analysis |
6.1.2 Indonesia Oil & Gas Processing Seals Market Revenues & Volume, By Type, 2022-2032F |
6.1.3 Indonesia Oil & Gas Processing Seals Market Revenues & Volume, By Single, 2022-2032F |
6.1.4 Indonesia Oil & Gas Processing Seals Market Revenues & Volume, By Double, 2022-2032F |
6.2 Indonesia Oil & Gas Processing Seals Market, By Material |
6.2.1 Overview and Analysis |
6.2.2 Indonesia Oil & Gas Processing Seals Market Revenues & Volume, By Metal, 2022-2032F |
6.2.3 Indonesia Oil & Gas Processing Seals Market Revenues & Volume, By Elastomer, 2022-2032F |
6.2.4 Indonesia Oil & Gas Processing Seals Market Revenues & Volume, By Face Material, 2022-2032F |
7 Indonesia Oil & Gas Processing Seals Market Import-Export Trade Statistics |
7.1 Indonesia Oil & Gas Processing Seals Market Export to Major Countries |
7.2 Indonesia Oil & Gas Processing Seals Market Imports from Major Countries |
8 Indonesia Oil & Gas Processing Seals Market Key Performance Indicators |
8.1 Number of new oil and gas processing projects in Indonesia |
8.2 Adoption rate of advanced sealing technologies in the oil and gas sector |
8.3 Maintenance and replacement frequency of seals in oil and gas processing facilities |
9 Indonesia Oil & Gas Processing Seals Market - Opportunity Assessment |
9.1 Indonesia Oil & Gas Processing Seals Market Opportunity Assessment, By Type, 2022 & 2032F |
9.2 Indonesia Oil & Gas Processing Seals Market Opportunity Assessment, By Material, 2022 & 2032F |
10 Indonesia Oil & Gas Processing Seals Market - Competitive Landscape |
10.1 Indonesia Oil & Gas Processing Seals Market Revenue Share, By Companies, 2025 |
10.2 Indonesia Oil & Gas Processing Seals Market Competitive Benchmarking, By Operating and Technical Parameters |
11 Company Profiles |
12 Recommendations |
13 Disclaimer |
Global Go To Market Strategy - 2030
Export potential enables firms to identify high-growth global markets with greater confidence by combining advanced trade intelligence with a structured quantitative methodology. The framework analyzes emerging demand trends and country-level import patterns while integrating macroeconomic and trade datasets such as GDP and population forecasts, bilateral import–export flows, tariff structures, elasticity differentials between developed and developing economies, geographic distance, and import demand projections. Using weighted trade values from 2020–2024 as the base period to project country-to-country export potential for 2030, these inputs are operationalized through calculated drivers such as gravity model parameters, tariff impact factors, and projected GDP per-capita growth. Through an analysis of hidden potentials, demand hotspots, and market conditions that are most favorable to success, this method enables firms to focus on target countries, maximize returns, and global expansion with data, backed by accuracy.
By factoring in the projected importer demand gap that is currently unmet and could be potential opportunity, it identifies the potential for the Exporter (Country) among 190 countries, against the general trade analysis, which identifies the biggest importer or exporter.
To discover high-growth global markets and optimize your business strategy:
Click Here
Pricing
- Single User License$ 1,995
- Department License$ 2,400
- Site License$ 3,120
- Global License$ 3,795

Leadership Perspectives from Industry Events
Search
Thought Leadership and Analyst Meet


Our Clients
6WResearch In News
- India Export Attractiveness Tracker 2026
- India Air Conditioner Market Set for Strong Rebound in 2026 After Weather-Led Correction and GST-Driven Recovery: 6Wresearch
- ADAS in India: How Automatic Emergency Braking, Blind Spot Detection & Driver Monitoring are Transforming Road Safety
- Doha a strategic location for EV manufacturing hub: IPA Qatar
- Demand for luxury TVs surging in the GCC, says Samsung
- Empowering Growth: The Thriving Journey of Bangladesh’s Cable Industry
Latest Reports
- Nicaragua RPG Gaming Market (2026-2032)
- New Zealand RPG Gaming Market (2026-2032)
- Netherlands RPG Gaming Market (2026-2032)
- Nauru RPG Gaming Market (2026-2032)
- Namibia RPG Gaming Market (2026-2032)
- Mozambique RPG Gaming Market (2026-2032)
- Montenegro RPG Gaming Market (2026-2032)
- Mongolia RPG Gaming Market (2026-2032)
- Monaco RPG Gaming Market (2026-2032)
- Micronesia RPG Gaming Market (2026-2032)
Industry Events and Analyst Meet

EV India Expo 2026

HIMTEX 2026

India Refining Summit 2026

India EV Show 2026

EV tech India Expo 2026
Whitepaper
- Middle East & Africa Commercial Security Market Click here to view more.
- Middle East & Africa Fire Safety Systems & Equipment Market Click here to view more.
- GCC Drone Market Click here to view more.
- Middle East Lighting Fixture Market Click here to view more.
- GCC Physical & Perimeter Security Market Click here to view more.