Indonesia Palm Mid-Fraction Market (2026-2032) Outlook | Industry, Analysis, Growth, Revenue, Forecast, Companies, Trends, Share, Size & Value
Market Forecast By Grade (Hard Palm Mid-fraction, Soft Palm Mid-fraction), By End Use (Food Industry, Confectionery, Bakery, Edible Oils & Fats, Surfactants & Detergents, Personal Care & Cosmetics, Others) And Competitive Landscape
| Product Code: ETC223348 | Publication Date: Aug 2023 | Updated Date: Jul 2026 | Product Type: Market Research Report | |
| Publisher: 6Wresearch | Author: Ravi Bhandari | No. of Pages: 75 | No. of Figures: 35 | No. of Tables: 20 |
Indonesia Palm Mid-Fraction Market Size, Share & Growth Rate
The Indonesia Palm Mid-Fraction Market was estimated at USD 187 Million in 2025 and is projected to reach USD 247 Million by 2032, growing at a CAGR of 4.1% from 2026 to 2032. This growth trajectory is primarily fueled by the increasing utilization of palm mid-fraction in food processing, as well as its adoption in cosmetics and industrial sectors. The rising consumer preference for natural and sustainable ingredients further accentuates the demand for this versatile palm oil derivative.
Indonesia Palm Mid-Fraction Market Year-wise Growth Rate and Key Drivers
This graph highlights how the Indonesia Palm Mid-Fraction Market has steadily grown over the years, supported by major growth factors.
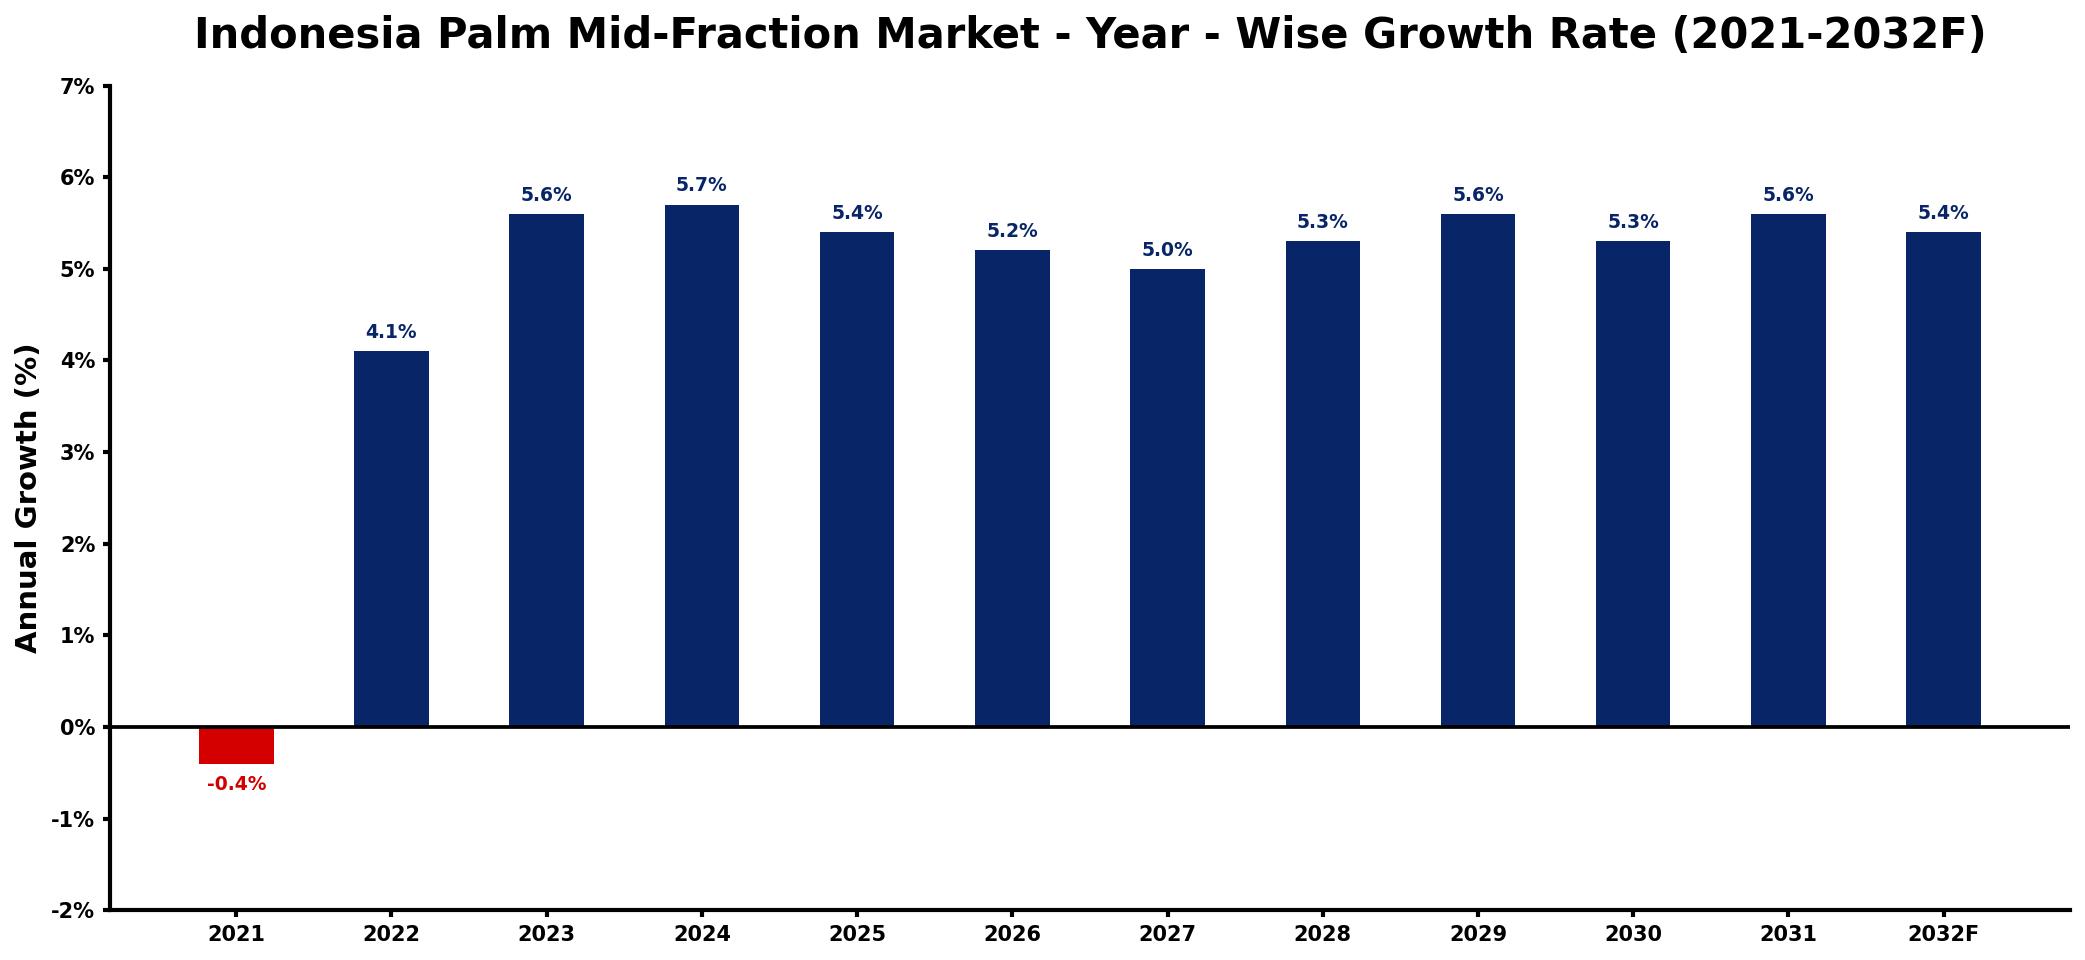
The table below presents the year‑wise growth rates along with the key drivers influencing the market
| Year | Growth Rate | Major Drivers |
| 2021 | -0.4% | decreased demand from food sector |
| 2022 | 4.1% | growing interest in sustainable sourcing |
| 2023 | 5.6% | rising applications in cosmetics industry |
| 2024 | 5.7% | increased investments in production facilities |
| 2025 | 5.4% | expansion of biofuel market opportunities |
| 2026 | 5.2% | surge in health product formulations |
| 2027 | 5.0% | growing usage in personal care |
| 2028 | 5.3% | increased exports to international markets |
| 2029 | 5.6% | enhancements in processing technologies |
| 2030 | 5.3% | growing awareness of health benefits |
| 2031 | 5.6% | rising demand from food manufacturers |
| 2032 | 5.4% | growing automotive sector requirements |
Note: Market size estimations and growth projections presented in this report are based on 6Wresearch's proprietary forecasting methodology, utilizing the latest available industry data, government publications, and primary research inputs.
Indonesia Palm Mid-Fraction Market Synopsis
The Indonesia Palm Mid-Fraction Market has shown a resilient performance amidst fluctuating market conditions. Recent trends indicate a burgeoning demand for palm mid-fraction, particularly in the food and cosmetic industries, where its unique properties cater to a wide range of applications.
Looking forward, the market is set to capitalize on evolving consumer preferences for clean-label products and sustainable sourcing practices. This strategic shift is not only likely to bolster market growth but also aligns with global sustainability initiatives that emphasize responsible palm oil production.
Indonesia Palm Mid-Fraction Market Key Takeaways
- The market is projected to achieve substantial growth, driven by diverse applications across various industries.
- Consumer demand for natural ingredients is significantly shaping product formulations, especially in cosmetics.
- Sustainable sourcing practices are becoming increasingly important for maintaining market credibility and growth.
- The post-pandemic recovery has revitalized the food and beauty sectors, essential for the palm mid-fraction market.
- Strategic government initiatives are likely to enhance production efficiency and sustainability in the palm oil sector.
Evaluation of Restraints in Indonesia Palm Mid-Fraction Market
Despite its growth prospects, the Indonesia Palm Mid-Fraction Market is constrained by various factors related to sustainability. The negative environmental impact associated with palm oil production, such as deforestation and habitat loss, has led to increased scrutiny from both consumers and regulatory bodies. These challenges necessitate a shift towards more sustainable cultivation and harvesting methods to ensure long-term viability and public acceptance of palm-based products.
Indonesia Palm Mid-Fraction Market Trends
Current trends within the Indonesia Palm Mid-Fraction Market illustrate a strong inclination towards clean label and naturally sourced ingredients. Companies are increasingly reformulating products to include palm mid-fraction as a healthier alternative to synthetic fats and oils. Moreover, the ongoing shift towards eco-friendly practices is prompting manufacturers to focus on obtaining certification for sustainable palm oil, thereby enhancing brand value and consumer trust.
Indonesia Palm Mid-Fraction Market Opportunities
The market presents numerous growth opportunities, particularly in the realms of product innovation and regional expansion. As health consciousness rises, there is a notable potential for developing palm mid-fraction-based products targeting health-conscious consumers. Additionally, the exploration of export markets in regions with growing demand for natural and organic ingredients offers a lucrative avenue for investment and expansion.
Government Initiatives in the Indonesia Palm Mid-Fraction Market
The Indonesian government has implemented various policies aimed at bolstering the palm oil sector while emphasizing sustainability. Initiatives include promoting sustainable agricultural practices, offering incentives for responsible cultivation, and fostering partnerships with international organizations to enhance certification standards. These measures are designed to improve the overall sustainability profile of the palm oil industry, including palm mid-fraction production.
Future Insights of the Indonesia Palm Mid-Fraction Market
Looking ahead to 2026-2032, the Indonesia Palm Mid-Fraction Market is positioned for continued growth, fueled by evolving consumer preferences and a heightened focus on sustainability. As industries increasingly adopt palm mid-fraction for its functional benefits and natural origins, the market will likely witness innovations that align with both consumer desires and regulatory expectations. The ongoing recovery from the pandemic, combined with robust initiatives, suggests a promising outlook for stakeholders in this sector.
Indonesia Palm Mid-Fraction Market Latest Developments (2025 - 2026)
Recent developments in the Indonesia Palm Mid-Fraction Market indicate a proactive response to the growing demand for sustainable products. Companies are increasingly investing in research and development to enhance the quality and functionality of palm mid-fraction, while also exploring new applications. Additionally, collaborative efforts among industry stakeholders to promote sustainable practices have gained momentum, further shaping the market landscape.
Indonesia Palm Mid-Fraction Market - Key Attractiveness of the Report
- 10 Years of Market Numbers
- Historical Data Starting from 2022 to 2025
- Base Year: 2025
- Forecast Data until 2032
- Key Performance Indicators Impacting the Market
- Major Upcoming Developments and Projects
Key Highlights of the Report:
- Indonesia Palm Mid-Fraction Market Outlook
- Market Size of Indonesia Palm Mid-Fraction Market, 2025
- Forecast of Indonesia Palm Mid-Fraction Market, 2032
- Historical Data and Forecast of Indonesia Palm Mid-Fraction Revenues & Volume for the Period 2022-2032F
- Indonesia Palm Mid-Fraction Market Trend Evolution
- Indonesia Palm Mid-Fraction Market Drivers and Challenges
- Indonesia Palm Mid-Fraction Price Trends
- Indonesia Palm Mid-Fraction Porter's Five Forces
- Indonesia Palm Mid-Fraction Industry Life Cycle
- Historical Data and Forecast of Indonesia Palm Mid-Fraction Market Revenues & Volume By Grade for the Period 2022-2032F
- Historical Data and Forecast of Indonesia Palm Mid-Fraction Market Revenues & Volume By Hard Palm Mid-fraction for the Period 2022-2032F
- Historical Data and Forecast of Indonesia Palm Mid-Fraction Market Revenues & Volume By Soft Palm Mid-fraction for the Period 2022-2032F
- Historical Data and Forecast of Indonesia Palm Mid-Fraction Market Revenues & Volume By End Use for the Period 2022-2032F
- Historical Data and Forecast of Indonesia Palm Mid-Fraction Market Revenues & Volume By Food Industry for the Period 2022-2032F
- Historical Data and Forecast of Indonesia Palm Mid-Fraction Market Revenues & Volume By Confectionery for the Period 2022-2032F
- Historical Data and Forecast of Indonesia Palm Mid-Fraction Market Revenues & Volume By Bakery for the Period 2022-2032F
- Historical Data and Forecast of Indonesia Palm Mid-Fraction Market Revenues & Volume By Edible Oils & Fats for the Period 2022-2032F
- Historical Data and Forecast of Indonesia Palm Mid-Fraction Market Revenues & Volume By Surfactants & Detergents for the Period 2022-2032F
- Historical Data and Forecast of Indonesia Palm Mid-Fraction Market Revenues & Volume By Personal Care & Cosmetics for the Period 2022-2032F
- Historical Data and Forecast of Indonesia Palm Mid-Fraction Market Revenues & Volume By Others for the Period 2022-2032F
- Indonesia Palm Mid-Fraction Import Export Trade Statistics
- Market Opportunity Assessment By Grade
- Market Opportunity Assessment By End Use
- Indonesia Palm Mid-Fraction Top Companies Market Share
- Indonesia Palm Mid-Fraction Competitive Benchmarking By Technical and Operational Parameters
- Indonesia Palm Mid-Fraction Company Profiles
- Indonesia Palm Mid-Fraction Key Strategic Recommendations
Frequently Asked Questions About the Market Study (FAQs):
Key growth drivers include the increasing application of palm mid-fraction in food processing and cosmetics, as well as rising consumer demand for natural ingredients.
The pandemic initially disrupted supply chains and reduced demand; however, as economic activity resumed, the market has shown signs of recovery.
The market is estimated at USD 187 Million in 2025, with projections of reaching USD 247 Million by 2032, reflecting a CAGR of 4.1% from 2026 to 2032.
Yes, there are significant governmental and industry initiatives aimed at promoting sustainable practices within the palm oil production sector.
Opportunities lie in product innovation targeting health-conscious consumers and expanding into international markets with growing demand for sustainable palm products.
Consumers are increasingly seeking clean-label products, prompting companies to reformulate offerings to include sustainable, naturally sourced palm mid-fraction.
6Wresearch actively monitors the Indonesia Palm Mid-Fraction Market and publishes its comprehensive annual report, highlighting emerging trends, growth drivers, revenue analysis, and forecast outlook. Our insights help businesses to make data-backed strategic decisions with ongoing market dynamics. Our analysts track relevent industries related to the Indonesia Palm Mid-Fraction Market, allowing our clients with actionable intelligence and reliable forecasts tailored to emerging regional needs.
Yes, we provide customisation as per your requirements. To learn more, feel free to contact us on sales@6wresearch.com
1 Executive Summary |
2 Introduction |
2.1 Key Highlights of the Report |
2.2 Report Description |
2.3 Market Scope & Segmentation |
2.4 Research Methodology |
2.5 Assumptions |
3 Indonesia Palm Mid-Fraction Market Overview |
3.1 Indonesia Country Macro Economic Indicators |
3.2 Indonesia Palm Mid-Fraction Market Revenues & Volume, 2022 & 2032F |
3.3 Indonesia Palm Mid-Fraction Market - Industry Life Cycle |
3.4 Indonesia Palm Mid-Fraction Market - Porter's Five Forces |
3.5 Indonesia Palm Mid-Fraction Market Revenues & Volume Share, By Grade, 2022 & 2032F |
3.6 Indonesia Palm Mid-Fraction Market Revenues & Volume Share, By End Use, 2022 & 2032F |
4 Indonesia Palm Mid-Fraction Market Dynamics |
4.1 Impact Analysis |
4.2 Market Drivers |
4.2.1 Growing demand for sustainable and eco-friendly products in the cosmetics and personal care industry |
4.2.2 Increasing awareness about the health benefits of palm mid-fraction in food and pharmaceutical applications |
4.2.3 Favorable government policies supporting the palm oil industry in Indonesia |
4.3 Market Restraints |
4.3.1 Fluctuating prices of palm oil affecting the overall profitability of palm mid-fraction products |
4.3.2 Environmental concerns related to deforestation and habitat destruction due to palm oil production in Indonesia |
5 Indonesia Palm Mid-Fraction Market Trends |
6 Indonesia Palm Mid-Fraction Market, By Types |
6.1 Indonesia Palm Mid-Fraction Market, By Grade |
6.1.1 Overview and Analysis |
6.1.2 Indonesia Palm Mid-Fraction Market Revenues & Volume, By Grade, 2022-2032F |
6.1.3 Indonesia Palm Mid-Fraction Market Revenues & Volume, By Hard Palm Mid-fraction, 2022-2032F |
6.1.4 Indonesia Palm Mid-Fraction Market Revenues & Volume, By Soft Palm Mid-fraction, 2022-2032F |
6.2 Indonesia Palm Mid-Fraction Market, By End Use |
6.2.1 Overview and Analysis |
6.2.2 Indonesia Palm Mid-Fraction Market Revenues & Volume, By Food Industry, 2022-2032F |
6.2.3 Indonesia Palm Mid-Fraction Market Revenues & Volume, By Confectionery, 2022-2032F |
6.2.4 Indonesia Palm Mid-Fraction Market Revenues & Volume, By Bakery, 2022-2032F |
6.2.5 Indonesia Palm Mid-Fraction Market Revenues & Volume, By Edible Oils & Fats, 2022-2032F |
6.2.6 Indonesia Palm Mid-Fraction Market Revenues & Volume, By Surfactants & Detergents, 2022-2032F |
6.2.7 Indonesia Palm Mid-Fraction Market Revenues & Volume, By Personal Care & Cosmetics, 2022-2032F |
7 Indonesia Palm Mid-Fraction Market Import-Export Trade Statistics |
7.1 Indonesia Palm Mid-Fraction Market Export to Major Countries |
7.2 Indonesia Palm Mid-Fraction Market Imports from Major Countries |
8 Indonesia Palm Mid-Fraction Market Key Performance Indicators |
8.1 Percentage of palm mid-fraction products certified as sustainable by recognized organizations |
8.2 Adoption rate of palm mid-fraction in new product developments across different industries |
8.3 Research and development investments in innovative technologies for palm mid-fraction extraction and processing |
9 Indonesia Palm Mid-Fraction Market - Opportunity Assessment |
9.1 Indonesia Palm Mid-Fraction Market Opportunity Assessment, By Grade, 2022 & 2032F |
9.2 Indonesia Palm Mid-Fraction Market Opportunity Assessment, By End Use, 2022 & 2032F |
10 Indonesia Palm Mid-Fraction Market - Competitive Landscape |
10.1 Indonesia Palm Mid-Fraction Market Revenue Share, By Companies, 2025 |
10.2 Indonesia Palm Mid-Fraction Market Competitive Benchmarking, By Operating and Technical Parameters |
11 Company Profiles |
12 Recommendations |
13 Disclaimer |
Global Go To Market Strategy - 2030
Export potential enables firms to identify high-growth global markets with greater confidence by combining advanced trade intelligence with a structured quantitative methodology. The framework analyzes emerging demand trends and country-level import patterns while integrating macroeconomic and trade datasets such as GDP and population forecasts, bilateral import–export flows, tariff structures, elasticity differentials between developed and developing economies, geographic distance, and import demand projections. Using weighted trade values from 2020–2024 as the base period to project country-to-country export potential for 2030, these inputs are operationalized through calculated drivers such as gravity model parameters, tariff impact factors, and projected GDP per-capita growth. Through an analysis of hidden potentials, demand hotspots, and market conditions that are most favorable to success, this method enables firms to focus on target countries, maximize returns, and global expansion with data, backed by accuracy.
By factoring in the projected importer demand gap that is currently unmet and could be potential opportunity, it identifies the potential for the Exporter (Country) among 190 countries, against the general trade analysis, which identifies the biggest importer or exporter.
To discover high-growth global markets and optimize your business strategy:
Click Here
Pricing
- Single User License$ 1,995
- Department License$ 2,400
- Site License$ 3,120
- Global License$ 3,795

Leadership Perspectives from Industry Events
Search
Thought Leadership and Analyst Meet


Our Clients
6WResearch In News
- India Air Conditioner Market Set for Strong Rebound in 2026 After Weather-Led Correction and GST-Driven Recovery: 6Wresearch
- ADAS in India: How Automatic Emergency Braking, Blind Spot Detection & Driver Monitoring are Transforming Road Safety
- Doha a strategic location for EV manufacturing hub: IPA Qatar
- Demand for luxury TVs surging in the GCC, says Samsung
- Empowering Growth: The Thriving Journey of Bangladesh’s Cable Industry
- Demand for luxury TVs surging in the GCC, says Samsung
Latest Reports
- Nicaragua RPG Gaming Market (2026-2032)
- New Zealand RPG Gaming Market (2026-2032)
- Netherlands RPG Gaming Market (2026-2032)
- Nauru RPG Gaming Market (2026-2032)
- Namibia RPG Gaming Market (2026-2032)
- Mozambique RPG Gaming Market (2026-2032)
- Montenegro RPG Gaming Market (2026-2032)
- Mongolia RPG Gaming Market (2026-2032)
- Monaco RPG Gaming Market (2026-2032)
- Micronesia RPG Gaming Market (2026-2032)
Industry Events and Analyst Meet

EV India Expo 2026

HIMTEX 2026

India Refining Summit 2026

India EV Show 2026

EV tech India Expo 2026
Whitepaper
- Middle East & Africa Commercial Security Market Click here to view more.
- Middle East & Africa Fire Safety Systems & Equipment Market Click here to view more.
- GCC Drone Market Click here to view more.
- Middle East Lighting Fixture Market Click here to view more.
- GCC Physical & Perimeter Security Market Click here to view more.