Indonesia Pantothenic Acid Market (2026-2032) Outlook | Value, Companies, Growth, Share, Industry, Size, Trends, Analysis, Forecast & Revenue
Market Forecast By Form (Powder, Tablets), By End Use (Pharmaceuticals, Nutritional &dietary Supplements, Animal Health & Nutrition, Infant Food & Supplements, Food & Beverages), By Source (Plants, Animals, Dairy Products), By Nature (Organic And , Inorganic) And Competitive Landscape
| Product Code: ETC337108 | Publication Date: Aug 2022 | Updated Date: Jul 2026 | Product Type: Market Research Report | |
| Publisher: 6Wresearch | Author: Ravi Bhandari | No. of Pages: 75 | No. of Figures: 35 | No. of Tables: 20 |
Indonesia Pantothenic Acid Market Size, Share & Growth Rate
The Indonesia Pantothenic Acid Market was estimated at USD 201 Million in 2025 and is projected to reach USD 267 Million by 2032, growing at a CAGR of 4.1% from 2026 to 2032. This robust growth is primarily fueled by increasing health consciousness among consumers, which drives demand for dietary supplements and fortified foods. Additionally, the rise of e-commerce platforms has transformed the way consumers access these products, further contributing to market expansion.
Indonesia Pantothenic Acid Market Year-wise Growth Rate and Key Drivers
This graph highlights how the Indonesia Pantothenic Acid Market has steadily grown over the years, supported by major growth factors.
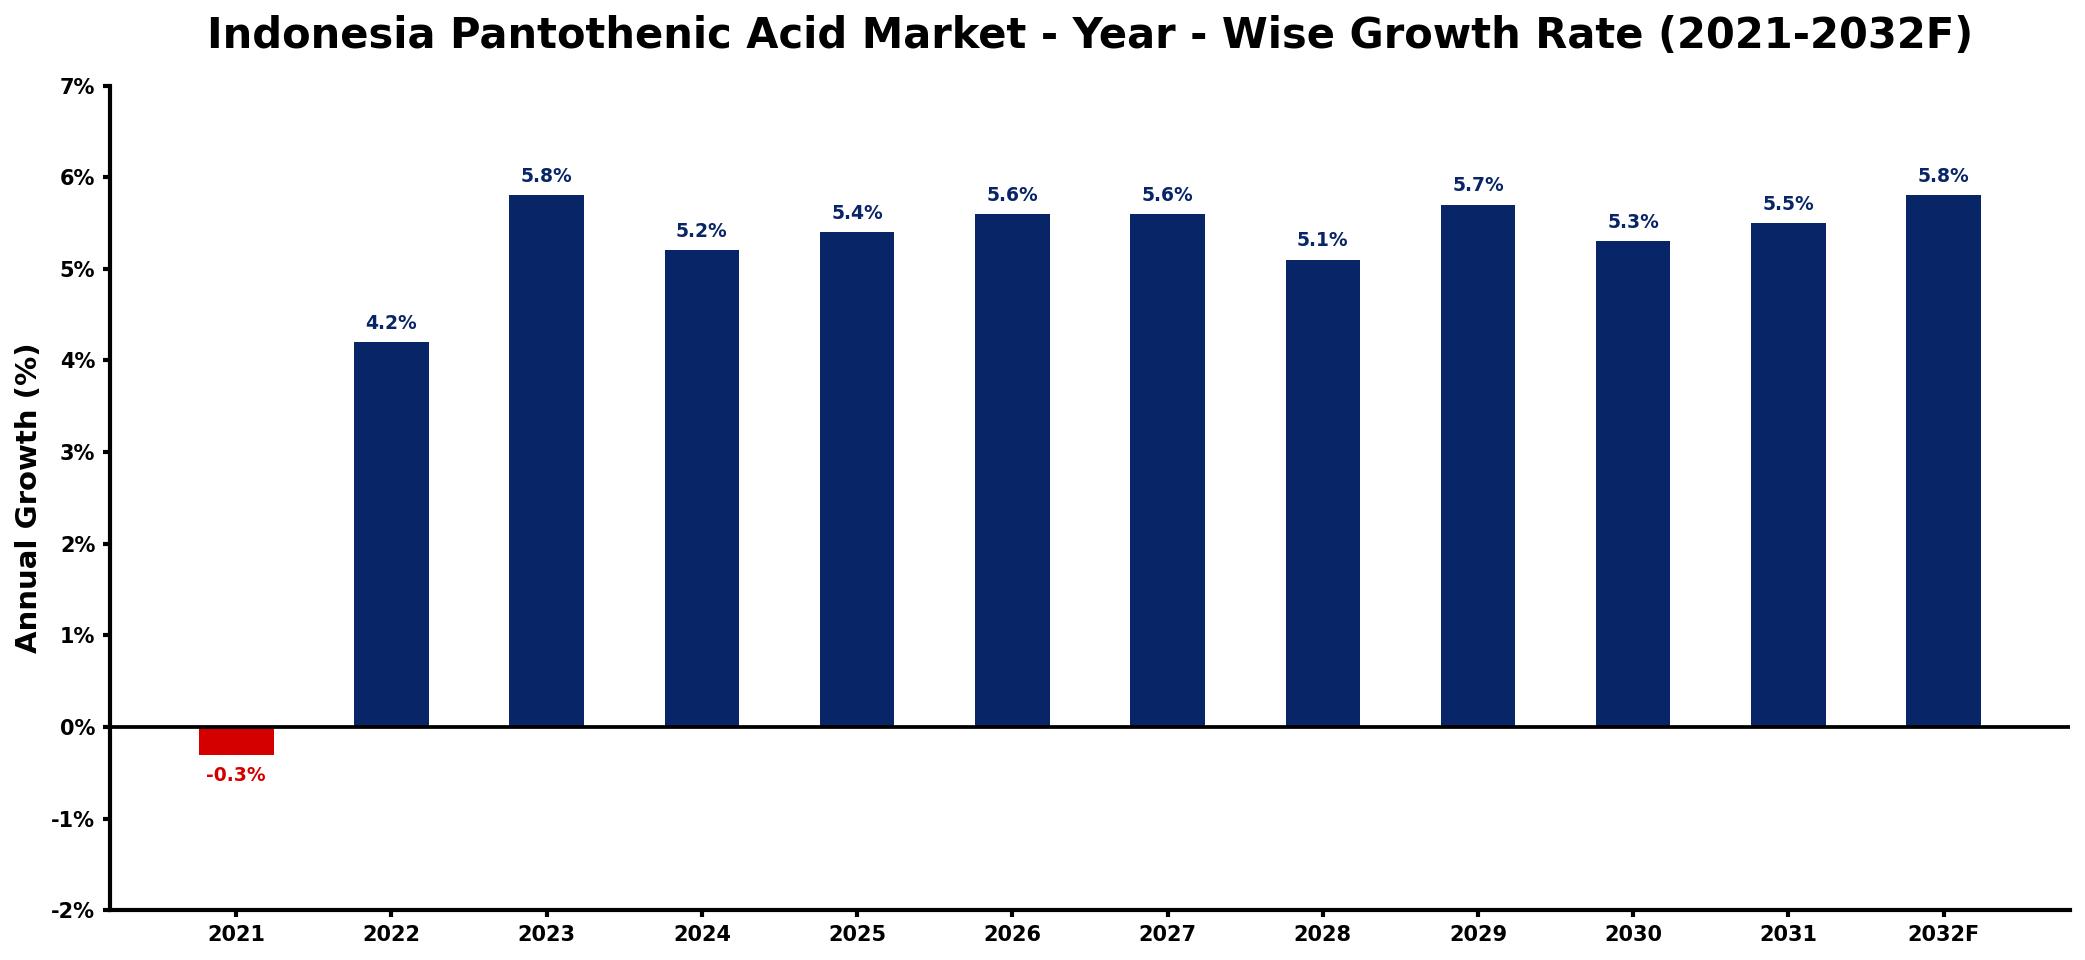
The table below presents the year‑wise growth rates along with the key drivers influencing the market
| Year | Growth Rate | Major Drivers |
| 2021 | -0.3% | decreased consumer health awareness |
| 2022 | 4.2% | rising dietary supplement consumption |
| 2023 | 5.8% | growing wellness industry demand |
| 2024 | 5.2% | increased investment in nutrition |
| 2025 | 5.4% | expansion of health food market |
| 2026 | 5.6% | emerging trends in functional foods |
| 2027 | 5.6% | enhanced focus on preventive health |
| 2028 | 5.1% | growing popularity of natural products |
| 2029 | 5.7% | increased research in health benefits |
| 2030 | 5.3% | increased capital investment inflows |
| 2031 | 5.5% | rising demand for organic supplements |
| 2032 | 5.8% | growing awareness of nutritional deficiencies |
Note: Market size estimations and growth projections presented in this report are based on 6Wresearch's proprietary forecasting methodology, utilizing the latest available industry data, government publications, and primary research inputs.
Indonesia Pantothenic Acid Market Synopsis
In Indonesia, the pantothenic acid market is witnessing a significant shift as consumers become more health-focused. This essential vitamin, known for its pivotal role in energy metabolism and synthesis of coenzyme A, is increasingly incorporated into dietary supplements and cosmetic products. The growing interest in preventive healthcare is pushing manufacturers to enhance their offerings, leading to a dynamic market landscape.
The versatile applications of pantothenic acid across various industries—including food fortification, pharmaceuticals, and personal care—add to its market attractiveness. As consumers increasingly prioritize wellness and personal care, the demand for high-quality products containing this vitamin is expected to soar in the coming years.
Indonesia Pantothenic Acid Market Key Takeaways
- The market is poised for robust growth, driven by rising consumer health awareness and dietary supplement trends.
- E-commerce is reshaping the market, enabling better access to pantothenic acid products across Indonesia.
- Diverse applications in food, pharmaceuticals, and cosmetics broaden the market's potential.
- Key players are focusing on quality and differentiation to maintain competitive advantages.
- The ongoing emphasis on health and wellness will continue to shape consumer preferences.
Evaluation of Restraints in Indonesia Pantothenic Acid Market
Despite its promising growth, the Indonesia pantothenic acid market faces certain restraints. Market competition is intensifying, with numerous players vying for a share. This saturation complicates product differentiation and may lead to price wars that threaten profit margins. Additionally, consumers are becoming more discerning regarding product quality and sourcing, pushing manufacturers to invest in transparent practices and high-quality formulations to retain customer trust.
Indonesia Pantothenic Acid Market Trends
Current trends indicate a surge in demand for clean-label products, with consumers increasingly seeking transparency in ingredient sourcing. This trend is especially pertinent in the dietary supplement sector, where the incorporation of pantothenic acid is growing. Additionally, the rise of wellness culture in Indonesia is fostering innovative product formulations that cater to beauty and holistic health, further solidifying the vitamin's presence in cosmetics.
Indonesia Pantothenic Acid Market Opportunities
As the demand for pantothenic acid rises, there are numerous opportunities for investment in product development and innovation. The skincare and haircare segments are particularly ripe for growth, given the increasing consumer focus on personal care. Furthermore, collaboration with e-commerce platforms to enhance distribution channels can significantly expand market reach, especially among health-conscious consumers seeking convenient access to supplements.
Government Initiatives in the Indonesia Pantothenic Acid Market
The Indonesian government is actively promoting health and wellness initiatives, which bodes well for the pantothenic acid market. Policies encouraging food fortification and dietary supplementation are being implemented, alongside public health campaigns aimed at improving overall nutritional intake. These initiatives not only support market growth but also emphasize the importance of vitamins in everyday diets, creating a favorable regulatory environment for manufacturers.
Future Insights of the Indonesia Pantothenic Acid Market
Looking ahead to 2026-2032, the Indonesia pantothenic acid market is set to flourish, driven by an unwavering focus on health and wellness. The expansion of both domestic and international players in the region will likely enhance product offerings and quality. As consumer preferences continue to evolve, particularly towards natural and organic options, manufacturers will need to adapt their strategies to align with these trends, ensuring sustained growth and competitive positioning.
Indonesia Pantothenic Acid Market Latest Developments (2025 - 2026)
In recent months, the pantothenic acid market has seen a flurry of activity as companies accelerate product launches that emphasize natural sourcing and innovative formulations. Many manufacturers are also engaging in partnerships with wellness influencers to enhance brand visibility and credibility among health-conscious consumers. As e-commerce channels become increasingly integral to sales strategies, companies are investing in online marketing campaigns that effectively communicate the benefits of pantothenic acid.
Indonesia Pantothenic Acid Market - Key Attractiveness of the Report
- 10 Years of Market Numbers
- Historical Data Starting from 2022 to 2025
- Base Year: 2025
- Forecast Data until 2032
- Key Performance Indicators Impacting the Market
- Major Upcoming Developments and Projects
Key Highlights of the Report:
- Indonesia Pantothenic Acid Market Outlook
- Market Size of Indonesia Pantothenic Acid Market, 2025
- Forecast of Indonesia Pantothenic Acid Market, 2032
- Historical Data and Forecast of Indonesia Pantothenic Acid Revenues & Volume for the Period 2022-2032F
- Indonesia Pantothenic Acid Market Trend Evolution
- Indonesia Pantothenic Acid Market Drivers and Challenges
- Indonesia Pantothenic Acid Price Trends
- Indonesia Pantothenic Acid Porter's Five Forces
- Indonesia Pantothenic Acid Industry Life Cycle
- Historical Data and Forecast of Indonesia Pantothenic Acid Market Revenues & Volume By Form for the Period 2022-2032F
- Historical Data and Forecast of Indonesia Pantothenic Acid Market Revenues & Volume By Powder for the Period 2022-2032F
- Historical Data and Forecast of Indonesia Pantothenic Acid Market Revenues & Volume By Tablets for the Period 2022-2032F
- Historical Data and Forecast of Indonesia Pantothenic Acid Market Revenues & Volume By End Use for the Period 2022-2032F
- Historical Data and Forecast of Indonesia Pantothenic Acid Market Revenues & Volume By Pharmaceuticals for the Period 2022-2032F
- Historical Data and Forecast of Indonesia Pantothenic Acid Market Revenues & Volume By Nutritional &dietary Supplements for the Period 2022-2032F
- Historical Data and Forecast of Indonesia Pantothenic Acid Market Revenues & Volume By Animal Health & Nutrition for the Period 2022-2032F
- Historical Data and Forecast of Indonesia Pantothenic Acid Market Revenues & Volume By Infant Food & Supplements for the Period 2022-2032F
- Historical Data and Forecast of Indonesia Pantothenic Acid Market Revenues & Volume By Food & Beverages for the Period 2022-2032F
- Historical Data and Forecast of Indonesia Pantothenic Acid Market Revenues & Volume By Source for the Period 2022-2032F
- Historical Data and Forecast of Indonesia Pantothenic Acid Market Revenues & Volume By Plants for the Period 2022-2032F
- Historical Data and Forecast of Indonesia Pantothenic Acid Market Revenues & Volume By Animals for the Period 2022-2032F
- Historical Data and Forecast of Indonesia Pantothenic Acid Market Revenues & Volume By Dairy Products for the Period 2022-2032F
- Historical Data and Forecast of Indonesia Pantothenic Acid Market Revenues & Volume By Nature for the Period 2022-2032F
- Historical Data and Forecast of Indonesia Pantothenic Acid Market Revenues & Volume By Organic And for the Period 2022-2032F
- Historical Data and Forecast of Indonesia Pantothenic Acid Market Revenues & Volume By Inorganic for the Period 2022-2032F
- Indonesia Pantothenic Acid Import Export Trade Statistics
- Market Opportunity Assessment By Form
- Market Opportunity Assessment By End Use
- Market Opportunity Assessment By Source
- Market Opportunity Assessment By Nature
- Indonesia Pantothenic Acid Top Companies Market Share
- Indonesia Pantothenic Acid Competitive Benchmarking By Technical and Operational Parameters
- Indonesia Pantothenic Acid Company Profiles
- Indonesia Pantothenic Acid Key Strategic Recommendations
Frequently Asked Questions About the Market Study (FAQs):
The market is estimated to be valued at USD 201 Million in 2025, with projections suggesting it will reach USD 267 Million by 2032, growing at a CAGR of 4.1% during the period from 2026 to 2032.
Growing health awareness among consumers is significantly driving demand for pantothenic acid, particularly in dietary supplements and fortified foods, as people prioritize their wellbeing and preventive health measures.
E-commerce platforms are revolutionizing the market by providing convenient access to pantothenic acid products, allowing manufacturers to reach a broader audience and engage with health-conscious consumers directly.
Pantothenic acid is widely utilized in sectors such as pharmaceuticals, dietary supplements, and cosmetics, reflecting its versatility and relevance across various industries.
Current trends include a rise in clean-label products, increased demand for natural ingredients in personal care, and a growing focus on preventive health, all contributing to the evolving landscape of the pantothenic acid market in Indonesia.
6Wresearch actively monitors the Indonesia Pantothenic Acid Market and publishes its comprehensive annual report, highlighting emerging trends, growth drivers, revenue analysis, and forecast outlook. Our insights help businesses to make data-backed strategic decisions with ongoing market dynamics. Our analysts track relevent industries related to the Indonesia Pantothenic Acid Market, allowing our clients with actionable intelligence and reliable forecasts tailored to emerging regional needs.
Yes, we provide customisation as per your requirements. To learn more, feel free to contact us on sales@6wresearch.com
1 Executive Summary |
2 Introduction |
2.1 Key Highlights of the Report |
2.2 Report Description |
2.3 Market Scope & Segmentation |
2.4 Research Methodology |
2.5 Assumptions |
3 Indonesia Pantothenic Acid Market Overview |
3.1 Indonesia Country Macro Economic Indicators |
3.2 Indonesia Pantothenic Acid Market Revenues & Volume, 2022 & 2032F |
3.3 Indonesia Pantothenic Acid Market - Industry Life Cycle |
3.4 Indonesia Pantothenic Acid Market - Porter's Five Forces |
3.5 Indonesia Pantothenic Acid Market Revenues & Volume Share, By Form, 2022 & 2032F |
3.6 Indonesia Pantothenic Acid Market Revenues & Volume Share, By End Use, 2022 & 2032F |
3.7 Indonesia Pantothenic Acid Market Revenues & Volume Share, By Source , 2022 & 2032F |
3.8 Indonesia Pantothenic Acid Market Revenues & Volume Share, By Nature, 2022 & 2032F |
4 Indonesia Pantothenic Acid Market Dynamics |
4.1 Impact Analysis |
4.2 Market Drivers |
4.2.1 Growing awareness about health benefits of pantothenic acid |
4.2.2 Increasing demand for dietary supplements and fortified food products |
4.2.3 Rise in disposable income leading to higher spending on health and wellness products |
4.3 Market Restraints |
4.3.1 Price volatility of raw materials used in pantothenic acid production |
4.3.2 Stringent regulations and compliance requirements in the health supplements industry |
4.3.3 Competition from alternative ingredients or supplements with similar health benefits |
5 Indonesia Pantothenic Acid Market Trends |
6 Indonesia Pantothenic Acid Market, By Types |
6.1 Indonesia Pantothenic Acid Market, By Form |
6.1.1 Overview and Analysis |
6.1.2 Indonesia Pantothenic Acid Market Revenues & Volume, By Form, 2022-2032F |
6.1.3 Indonesia Pantothenic Acid Market Revenues & Volume, By Powder, 2022-2032F |
6.1.4 Indonesia Pantothenic Acid Market Revenues & Volume, By Tablets, 2022-2032F |
6.2 Indonesia Pantothenic Acid Market, By End Use |
6.2.1 Overview and Analysis |
6.2.2 Indonesia Pantothenic Acid Market Revenues & Volume, By Pharmaceuticals, 2022-2032F |
6.2.3 Indonesia Pantothenic Acid Market Revenues & Volume, By Nutritional &dietary Supplements, 2022-2032F |
6.2.4 Indonesia Pantothenic Acid Market Revenues & Volume, By Animal Health & Nutrition, 2022-2032F |
6.2.5 Indonesia Pantothenic Acid Market Revenues & Volume, By Infant Food & Supplements, 2022-2032F |
6.2.6 Indonesia Pantothenic Acid Market Revenues & Volume, By Food & Beverages, 2022-2032F |
6.3 Indonesia Pantothenic Acid Market, By Source |
6.3.1 Overview and Analysis |
6.3.2 Indonesia Pantothenic Acid Market Revenues & Volume, By Plants, 2022-2032F |
6.3.3 Indonesia Pantothenic Acid Market Revenues & Volume, By Animals, 2022-2032F |
6.3.4 Indonesia Pantothenic Acid Market Revenues & Volume, By Dairy Products, 2022-2032F |
6.4 Indonesia Pantothenic Acid Market, By Nature |
6.4.1 Overview and Analysis |
6.4.2 Indonesia Pantothenic Acid Market Revenues & Volume, By Organic And , 2022-2032F |
6.4.3 Indonesia Pantothenic Acid Market Revenues & Volume, By Inorganic, 2022-2032F |
7 Indonesia Pantothenic Acid Market Import-Export Trade Statistics |
7.1 Indonesia Pantothenic Acid Market Export to Major Countries |
7.2 Indonesia Pantothenic Acid Market Imports from Major Countries |
8 Indonesia Pantothenic Acid Market Key Performance Indicators |
8.1 Number of new product launches containing pantothenic acid |
8.2 Consumer surveys indicating awareness and perceived benefits of pantothenic acid |
8.3 Investment in research and development for innovative pantothenic acid formulations |
9 Indonesia Pantothenic Acid Market - Opportunity Assessment |
9.1 Indonesia Pantothenic Acid Market Opportunity Assessment, By Form, 2022 & 2032F |
9.2 Indonesia Pantothenic Acid Market Opportunity Assessment, By End Use, 2022 & 2032F |
9.3 Indonesia Pantothenic Acid Market Opportunity Assessment, By Source , 2022 & 2032F |
9.4 Indonesia Pantothenic Acid Market Opportunity Assessment, By Nature, 2022 & 2032F |
10 Indonesia Pantothenic Acid Market - Competitive Landscape |
10.1 Indonesia Pantothenic Acid Market Revenue Share, By Companies, 2025 |
10.2 Indonesia Pantothenic Acid Market Competitive Benchmarking, By Operating and Technical Parameters |
11 Company Profiles |
12 Recommendations |
13 Disclaimer |
Global Go To Market Strategy - 2030
Export potential enables firms to identify high-growth global markets with greater confidence by combining advanced trade intelligence with a structured quantitative methodology. The framework analyzes emerging demand trends and country-level import patterns while integrating macroeconomic and trade datasets such as GDP and population forecasts, bilateral import–export flows, tariff structures, elasticity differentials between developed and developing economies, geographic distance, and import demand projections. Using weighted trade values from 2020–2024 as the base period to project country-to-country export potential for 2030, these inputs are operationalized through calculated drivers such as gravity model parameters, tariff impact factors, and projected GDP per-capita growth. Through an analysis of hidden potentials, demand hotspots, and market conditions that are most favorable to success, this method enables firms to focus on target countries, maximize returns, and global expansion with data, backed by accuracy.
By factoring in the projected importer demand gap that is currently unmet and could be potential opportunity, it identifies the potential for the Exporter (Country) among 190 countries, against the general trade analysis, which identifies the biggest importer or exporter.
To discover high-growth global markets and optimize your business strategy:
Click Here
Pricing
- Single User License$ 1,995
- Department License$ 2,400
- Site License$ 3,120
- Global License$ 3,795

Leadership Perspectives from Industry Events
Search
Thought Leadership and Analyst Meet


Our Clients
6WResearch In News
- India Air Conditioner Market Set for Strong Rebound in 2026 After Weather-Led Correction and GST-Driven Recovery: 6Wresearch
- ADAS in India: How Automatic Emergency Braking, Blind Spot Detection & Driver Monitoring are Transforming Road Safety
- Doha a strategic location for EV manufacturing hub: IPA Qatar
- Demand for luxury TVs surging in the GCC, says Samsung
- Empowering Growth: The Thriving Journey of Bangladesh’s Cable Industry
- Demand for luxury TVs surging in the GCC, says Samsung
Latest Reports
- Nicaragua RPG Gaming Market (2026-2032)
- New Zealand RPG Gaming Market (2026-2032)
- Netherlands RPG Gaming Market (2026-2032)
- Nauru RPG Gaming Market (2026-2032)
- Namibia RPG Gaming Market (2026-2032)
- Mozambique RPG Gaming Market (2026-2032)
- Montenegro RPG Gaming Market (2026-2032)
- Mongolia RPG Gaming Market (2026-2032)
- Monaco RPG Gaming Market (2026-2032)
- Micronesia RPG Gaming Market (2026-2032)
Industry Events and Analyst Meet

EV India Expo 2026

HIMTEX 2026

India Refining Summit 2026

India EV Show 2026

EV tech India Expo 2026
Whitepaper
- Middle East & Africa Commercial Security Market Click here to view more.
- Middle East & Africa Fire Safety Systems & Equipment Market Click here to view more.
- GCC Drone Market Click here to view more.
- Middle East Lighting Fixture Market Click here to view more.
- GCC Physical & Perimeter Security Market Click here to view more.