Indonesia Paper Products Market (2026-2032) | Companies, Analysis, Revenue, Outlook, Share, Forecast, Trends, Growth, Value, Size & Industry
Market Forecast By Type (Converted Paper Products, Unfinished Paper, Pulp Mills), By Applications (Writing Paper, Magazine Paper, Packaging Paper, Sanitary Paper, Other) And Competitive Landscape
| Product Code: ETC038589 | Publication Date: Jul 2023 | Updated Date: Jun 2026 | Product Type: Report | |
| Publisher: 6Wresearch | Author: Ravi Bhandari | No. of Pages: 70 | No. of Figures: 35 | No. of Tables: 5 |
Indonesia Paper Products Market Summary
The indonesia paper products market was estimated at USD 441 Million in 2025 and is projected to reach USD 586 Million by 2032, growing at a CAGR of 5.6% from 2026 to 2032.
Indonesia Paper Products Market Year-wise Growth Rate and Key Drivers
This graph highlights how the Indonesia Paper Products Market has steadily grown over the years, supported by major growth factors.
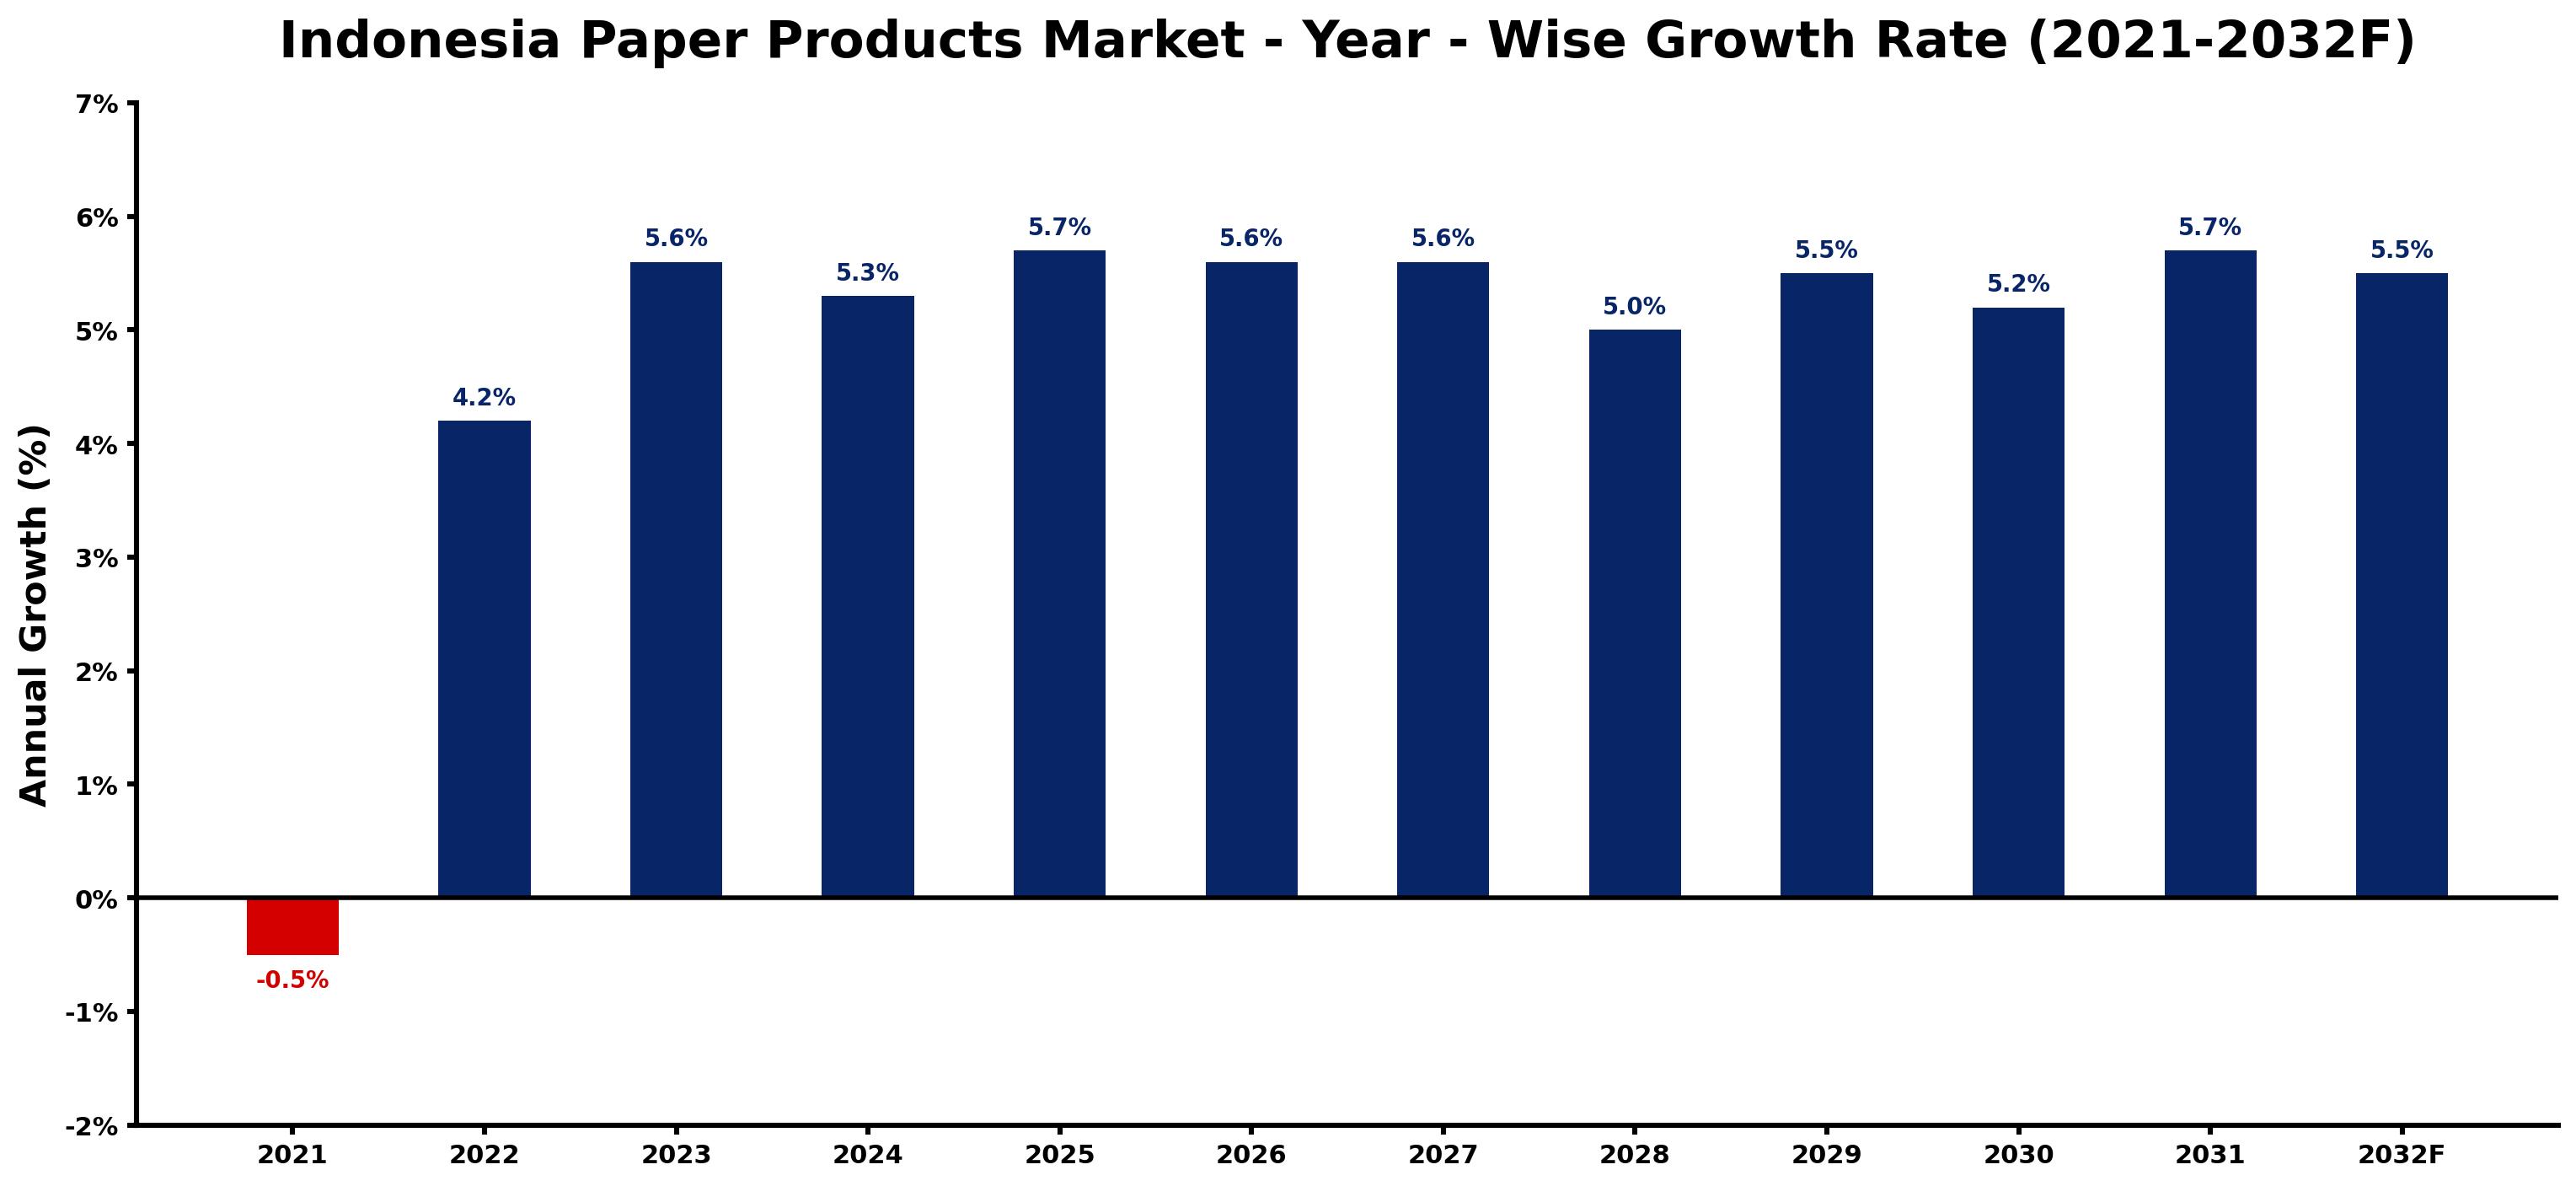
The table below presents the year wise growth rates along with the key drivers influencing the market
| Year | Growth Rate | Major Drivers |
| 2021 | -0.5% | Supply chain disruptions stemming from pandemicrelated restrictions hindered production capacity and delivery efficiency in the paper products sector. |
| 2022 | 4.2% | Sustainability trends pushed manufacturers to adopt eco-friendly paper alternatives. |
| 2023 | 5.6% | Urbanization led to higher consumption of paper products in metropolitan areas. |
| 2024 | 5.3% | Digitalization opened new avenues for innovative product development in printing. |
| 2025 | 5.7% | Investment in local industries enhanced production capacity and supply chain stability. |
| 2026 | 5.6% | Rising consumer awareness about environmental impact influenced purchasing decisions significantly. |
| 2027 | 5.6% | Export opportunities expanded as global markets sought affordable Indonesian paper products. |
| 2028 | 5.0% | Technological advancements streamlined production processes, reducing costs and increasing output. |
| 2029 | 5.5% | Corporate responsibility initiatives encouraged businesses to switch to sustainable materials. |
| 2030 | 5.2% | Education sector growth created demand for various educational paper supplies and materials. |
| 2031 | 5.7% | Government incentives for recycling programs improved waste management and resource efficiency. |
| 2032 | 5.5% | Cultural shifts towards minimalism further decreased reliance on single-use paper products. |
Note - Market size estimations and growth projections presented in this report are based on 6Wresearch's advanced forecasting approach, validated with industry datasets as of June 2026.
Indonesia Paper Products Market Synopsis
The Indonesia Paper Products Market is projected to reach 5.6% and witness significant growth during the forecast period (2026-2032). This growth is primarily driven by the escalating demand for hygiene and home care products, along with rising disposable incomes and an enhancement in living standards among the Indonesian population. Coupled with a burgeoning population and increasing digitalization, these factors are expected to further bolster the demand for paper products such as tissue papers, wipes, and diapers, thus propelling market expansion throughout this period.
Indonesia Paper Products Market Growth Drivers
Several critical drivers are influencing the growth trajectory of the Indonesia Paper Products Market. Chief among these are:
- The rapid growth in population is generating a higher demand for essential paper products, particularly in urban areas where consumer needs are rapidly evolving.
- Urbanization trends have led to shifting consumer behaviors, resulting in increased spending on hygiene-related paper products, which are now considered necessities in household purchasing decisions.
- Rising disposable incomes have empowered consumers to opt for premium paper product offerings, which cater to enhanced lifestyle choices and preferences.
- Advancements in e-commerce have revolutionized the distribution channels for paper products, allowing manufacturers to reach a broader audience without geographical limitations.
- Innovative packaging solutions have emerged, significantly impacting consumer demand by offering more sustainable and attractive options, thereby enhancing brand loyalty.
Indonesia Paper Products Market Trends and Opportunities
The Indonesia Paper Products Market is currently experiencing several notable trends that present unique opportunities for growth:
- There is a marked increase in consumer awareness regarding hygiene, prompting a shift towards products that emphasize cleanliness and sanitation.
- Technological innovation in biodegradable packaging is gaining traction, providing an eco-friendly alternative that aligns with global sustainability efforts.
- The integration of digital marketing strategies by manufacturers has enhanced product visibility and accessibility, further driving consumer engagement.
- Collaboration between various sectors, such as healthcare and retail, is transforming product offerings, allowing for tailored solutions that meet specific consumer needs.
- Rural market penetration is becoming a focus for manufacturers, as increased distribution networks enhance access to paper products in less urbanized areas.
Indonesia Paper Products Market Challenges and Restraints
Despite the optimistic outlook, the Indonesia Paper Products Market faces several challenges that may impede growth:
- Resource scarcity poses a significant challenge, as local suppliers struggle to meet the demand for raw materials, leading to increased reliance on imports.
- Environmental regulations aimed at curbing deforestation can hinder production capacities, impacting the availability of sustainable resources for paper products.
- The high costs associated with importing raw materials can affect pricing structures, potentially limiting profit margins for manufacturers.
- Market volatility is exacerbated by the limited number of key players within the industry, leading to unpredictable pricing dynamics based on supply and demand fluctuations.
- Inadequate waste management systems contribute to environmental concerns, where illegal dumping practices by unorganized players can adversely affect brand reputations.
Indonesia Paper Products Market Government Investment and Initiatives
The Indonesian government has recognized the potential of the paper products sector as a critical contributor to the national economy and is implementing various initiatives to support its growth. Key government investments include:
- Increased funding and incentives for sustainable forestry practices to ensure a steady supply of raw materials while preserving the environment.
- Initiatives aimed at enhancing waste management systems nationwide are expected to improve recycling rates and reduce the environmental impact of paper waste.
- Public spending on infrastructure improvements, which will facilitate better transportation and distribution networks for paper products.
- Regulatory frameworks that encourage investments in technological advancements related to biodegradable and sustainable packaging solutions.
- Support for local manufacturers through tax incentives and subsidies aimed at enhancing production capacity and competitiveness in the global market.
Indonesia Paper Products Market Latest Developments (May 2025 - June 2026)
Recent developments within the Indonesia Paper Products Market reflect the dynamic nature of the industry. Ongoing trends indicate an emphasis on sustainability and innovation, as manufacturers are exploring new biodegradable materials for packaging. Additionally, collaborations between manufacturers and technology firms are paving the way for enhanced production processes and improved product offerings. The increasing influence of e-commerce is driving a shift in the market, encouraging companies to adopt more robust online sales strategies. Furthermore, consumer preferences are evolving, with a notable shift towards premium and environmentally friendly paper products, influencing manufacturers to adapt their portfolios accordingly.
Indonesia Paper Products Market - Key Attractiveness of the Report
- 10 Years of Market Numbers
- Historical Data Starting from 2022 to 2025
- Base Year: 2025
- Forecast Data until 2032
- Key Performance Indicators Impacting the Market
- Major Upcoming Developments and Projects
Key Highlights of the Report:
- Indonesia Paper Products Market Outlook
- Market Size of Indonesia Paper Products Market, 2025
- Forecast of Indonesia Paper Products Market, 2032F
- Historical Data and Forecast of Indonesia Paper Products Revenues & Volume for the Period 2022-2032F
- Indonesia Paper Products Market Trend Evolution
- Indonesia Paper Products Market Drivers and Challenges
- Indonesia Paper Products Price Trends
- Indonesia Paper Products Porter's Five Forces
- Indonesia Paper Products Industry Life Cycle
- Historical Data and Forecast of Indonesia Paper Products Market Revenues & Volume By Type for the Period 2022-2032F
- Historical Data and Forecast of Indonesia Paper Products Market Revenues & Volume By Converted Paper Products for the Period 2022-2032F
- Historical Data and Forecast of Indonesia Paper Products Market Revenues & Volume By Unfinished Paper for the Period 2022-2032F
- Historical Data and Forecast of Indonesia Paper Products Market Revenues & Volume By Pulp Mills for the Period 2022-2032F
- Historical Data and Forecast of Indonesia Paper Products Market Revenues & Volume By Applications for the Period 2022-2032F
- Historical Data and Forecast of Indonesia Paper Products Market Revenues & Volume By Writing Paper for the Period 2022-2032F
- Historical Data and Forecast of Indonesia Paper Products Market Revenues & Volume By Magazine Paper for the Period 2022-2032F
- Historical Data and Forecast of Indonesia Paper Products Market Revenues & Volume By Packaging Paper for the Period 2022-2032F
- Historical Data and Forecast of Indonesia Paper Products Market Revenues & Volume By Sanitary Paper for the Period 2022-2032F
- Historical Data and Forecast of Indonesia Paper Products Market Revenues & Volume By Other for the Period 2022-2032F
- Indonesia Paper Products Import Export Trade Statistics
- Market Opportunity Assessment By Type
- Market Opportunity Assessment By Applications
- Indonesia Paper Products Top Companies Market Share
- Indonesia Paper Products Competitive Benchmarking By Technical and Operational Parameters
- Indonesia Paper Products Company Profiles
- Indonesia Paper Products Key Strategic Recommendations
Frequently Asked Questions About the Market Study (FAQs):
The growth is driven by factors such as rising disposable incomes, increasing hygiene awareness, urbanization, and the expansion of e-commerce platforms.
Challenges include resource scarcity, high import costs, environmental regulations, and inadequate waste management systems.
The government is supporting the market through investments in sustainable practices, infrastructure development, and initiatives aimed at improving waste management.
Current trends include a shift towards sustainability, increased digital marketing, collaboration across industries, and a focus on premium paper product offerings.
6Wresearch actively monitors the Indonesia Paper Products Market and publishes its comprehensive annual report, highlighting emerging trends, growth drivers, revenue analysis, and forecast outlook. Our insights help businesses to make data-backed strategic decisions with ongoing market dynamics. Our analysts track relevent industries related to the Indonesia Paper Products Market, allowing our clients with actionable intelligence and reliable forecasts tailored to emerging regional needs.
Yes, we provide customisation as per your requirements. To learn more, feel free to contact us on sales@6wresearch.com
1 Executive Summary |
2 Introduction |
2.1 Key Highlights of the Report |
2.2 Report Description |
2.3 Market Scope & Segmentation |
2.4 Research Methodology |
2.5 Assumptions |
3 Indonesia Paper Products Market Overview |
3.1 Indonesia Country Macro Economic Indicators |
3.2 Indonesia Paper Products Market Revenues & Volume, 2022 & 2032F |
3.3 Indonesia Paper Products Market - Industry Life Cycle |
3.4 Indonesia Paper Products Market - Porter's Five Forces |
3.5 Indonesia Paper Products Market Revenues & Volume Share, By Type, 2022 & 2032F |
3.6 Indonesia Paper Products Market Revenues & Volume Share, By Applications, 2022 & 2032F |
4 Indonesia Paper Products Market Dynamics |
4.1 Impact Analysis |
4.2 Market Drivers |
4.3 Market Restraints |
5 Indonesia Paper Products Market Trends |
6 Indonesia Paper Products Market, By Types |
6.1 Indonesia Paper Products Market, By Type |
6.1.1 Overview and Analysis |
6.1.2 Indonesia Paper Products Market Revenues & Volume, By Type, 2022-2032F |
6.1.3 Indonesia Paper Products Market Revenues & Volume, By Converted Paper Products, 2022-2032F |
6.1.4 Indonesia Paper Products Market Revenues & Volume, By Unfinished Paper, 2022-2032F |
6.1.5 Indonesia Paper Products Market Revenues & Volume, By Pulp Mills, 2022-2032F |
6.2 Indonesia Paper Products Market, By Applications |
6.2.1 Overview and Analysis |
6.2.2 Indonesia Paper Products Market Revenues & Volume, By Writing Paper, 2022-2032F |
6.2.3 Indonesia Paper Products Market Revenues & Volume, By Magazine Paper, 2022-2032F |
6.2.4 Indonesia Paper Products Market Revenues & Volume, By Packaging Paper, 2022-2032F |
6.2.5 Indonesia Paper Products Market Revenues & Volume, By Sanitary Paper, 2022-2032F |
6.2.6 Indonesia Paper Products Market Revenues & Volume, By Other, 2022-2032F |
7 Indonesia Paper Products Market Import-Export Trade Statistics |
7.1 Indonesia Paper Products Market Export to Major Countries |
7.2 Indonesia Paper Products Market Imports from Major Countries |
8 Indonesia Paper Products Market Key Performance Indicators |
9 Indonesia Paper Products Market - Opportunity Assessment |
9.1 Indonesia Paper Products Market Opportunity Assessment, By Type, 2022 & 2032F |
9.2 Indonesia Paper Products Market Opportunity Assessment, By Applications, 2022 & 2032F |
10 Indonesia Paper Products Market - Competitive Landscape |
10.1 Indonesia Paper Products Market Revenue Share, By Companies, 2025 |
10.2 Indonesia Paper Products Market Competitive Benchmarking, By Operating and Technical Parameters |
11 Company Profiles |
12 Recommendations |
13 Disclaimer |
Global Go To Market Strategy - 2030
Export potential enables firms to identify high-growth global markets with greater confidence by combining advanced trade intelligence with a structured quantitative methodology. The framework analyzes emerging demand trends and country-level import patterns while integrating macroeconomic and trade datasets such as GDP and population forecasts, bilateral import–export flows, tariff structures, elasticity differentials between developed and developing economies, geographic distance, and import demand projections. Using weighted trade values from 2020–2024 as the base period to project country-to-country export potential for 2030, these inputs are operationalized through calculated drivers such as gravity model parameters, tariff impact factors, and projected GDP per-capita growth. Through an analysis of hidden potentials, demand hotspots, and market conditions that are most favorable to success, this method enables firms to focus on target countries, maximize returns, and global expansion with data, backed by accuracy.
By factoring in the projected importer demand gap that is currently unmet and could be potential opportunity, it identifies the potential for the Exporter (Country) among 190 countries, against the general trade analysis, which identifies the biggest importer or exporter.
To discover high-growth global markets and optimize your business strategy:
Click Here
Pricing
- Single User License$ 1,995
- Department License$ 2,400
- Site License$ 3,120
- Global License$ 3,795

Leadership Perspectives from Industry Events
Search
Thought Leadership and Analyst Meet


Our Clients
6WResearch In News
- India Air Conditioner Market Set for Strong Rebound in 2026 After Weather-Led Correction and GST-Driven Recovery: 6Wresearch
- ADAS in India: How Automatic Emergency Braking, Blind Spot Detection & Driver Monitoring are Transforming Road Safety
- Doha a strategic location for EV manufacturing hub: IPA Qatar
- Demand for luxury TVs surging in the GCC, says Samsung
- Empowering Growth: The Thriving Journey of Bangladesh’s Cable Industry
- Demand for luxury TVs surging in the GCC, says Samsung
Latest Reports
- Nicaragua RPG Gaming Market (2026-2032)
- New Zealand RPG Gaming Market (2026-2032)
- Netherlands RPG Gaming Market (2026-2032)
- Nauru RPG Gaming Market (2026-2032)
- Namibia RPG Gaming Market (2026-2032)
- Mozambique RPG Gaming Market (2026-2032)
- Montenegro RPG Gaming Market (2026-2032)
- Mongolia RPG Gaming Market (2026-2032)
- Monaco RPG Gaming Market (2026-2032)
- Micronesia RPG Gaming Market (2026-2032)
Industry Events and Analyst Meet

EV India Expo 2026

HIMTEX 2026

India Refining Summit 2026

India EV Show 2026

EV tech India Expo 2026
Whitepaper
- Middle East & Africa Commercial Security Market Click here to view more.
- Middle East & Africa Fire Safety Systems & Equipment Market Click here to view more.
- GCC Drone Market Click here to view more.
- Middle East Lighting Fixture Market Click here to view more.
- GCC Physical & Perimeter Security Market Click here to view more.