Indonesia Particle Board Market (2024-2030) | Share, Revenue, Analysis, Size, Companies, Trends, Outlook, Growth, Forecast, Industry & Value
Market Forecast By Type (Standard Chipboard, Melamine Veneered Chipboard, Flooring Grade Chipboard, Wood Veneered Chipboard, Plastic Veneered Chipboard, Other), By Application (Construction, Furniture, Infrastructure, Other) And Competitive Landscape
| Product Code: ETC031728 | Publication Date: Jul 2023 | Updated Date: Feb 2026 | Product Type: Report | |
| Publisher: 6Wresearch | Author: Ravi Bhandari | No. of Pages: 70 | No. of Figures: 35 | No. of Tables: 5 |
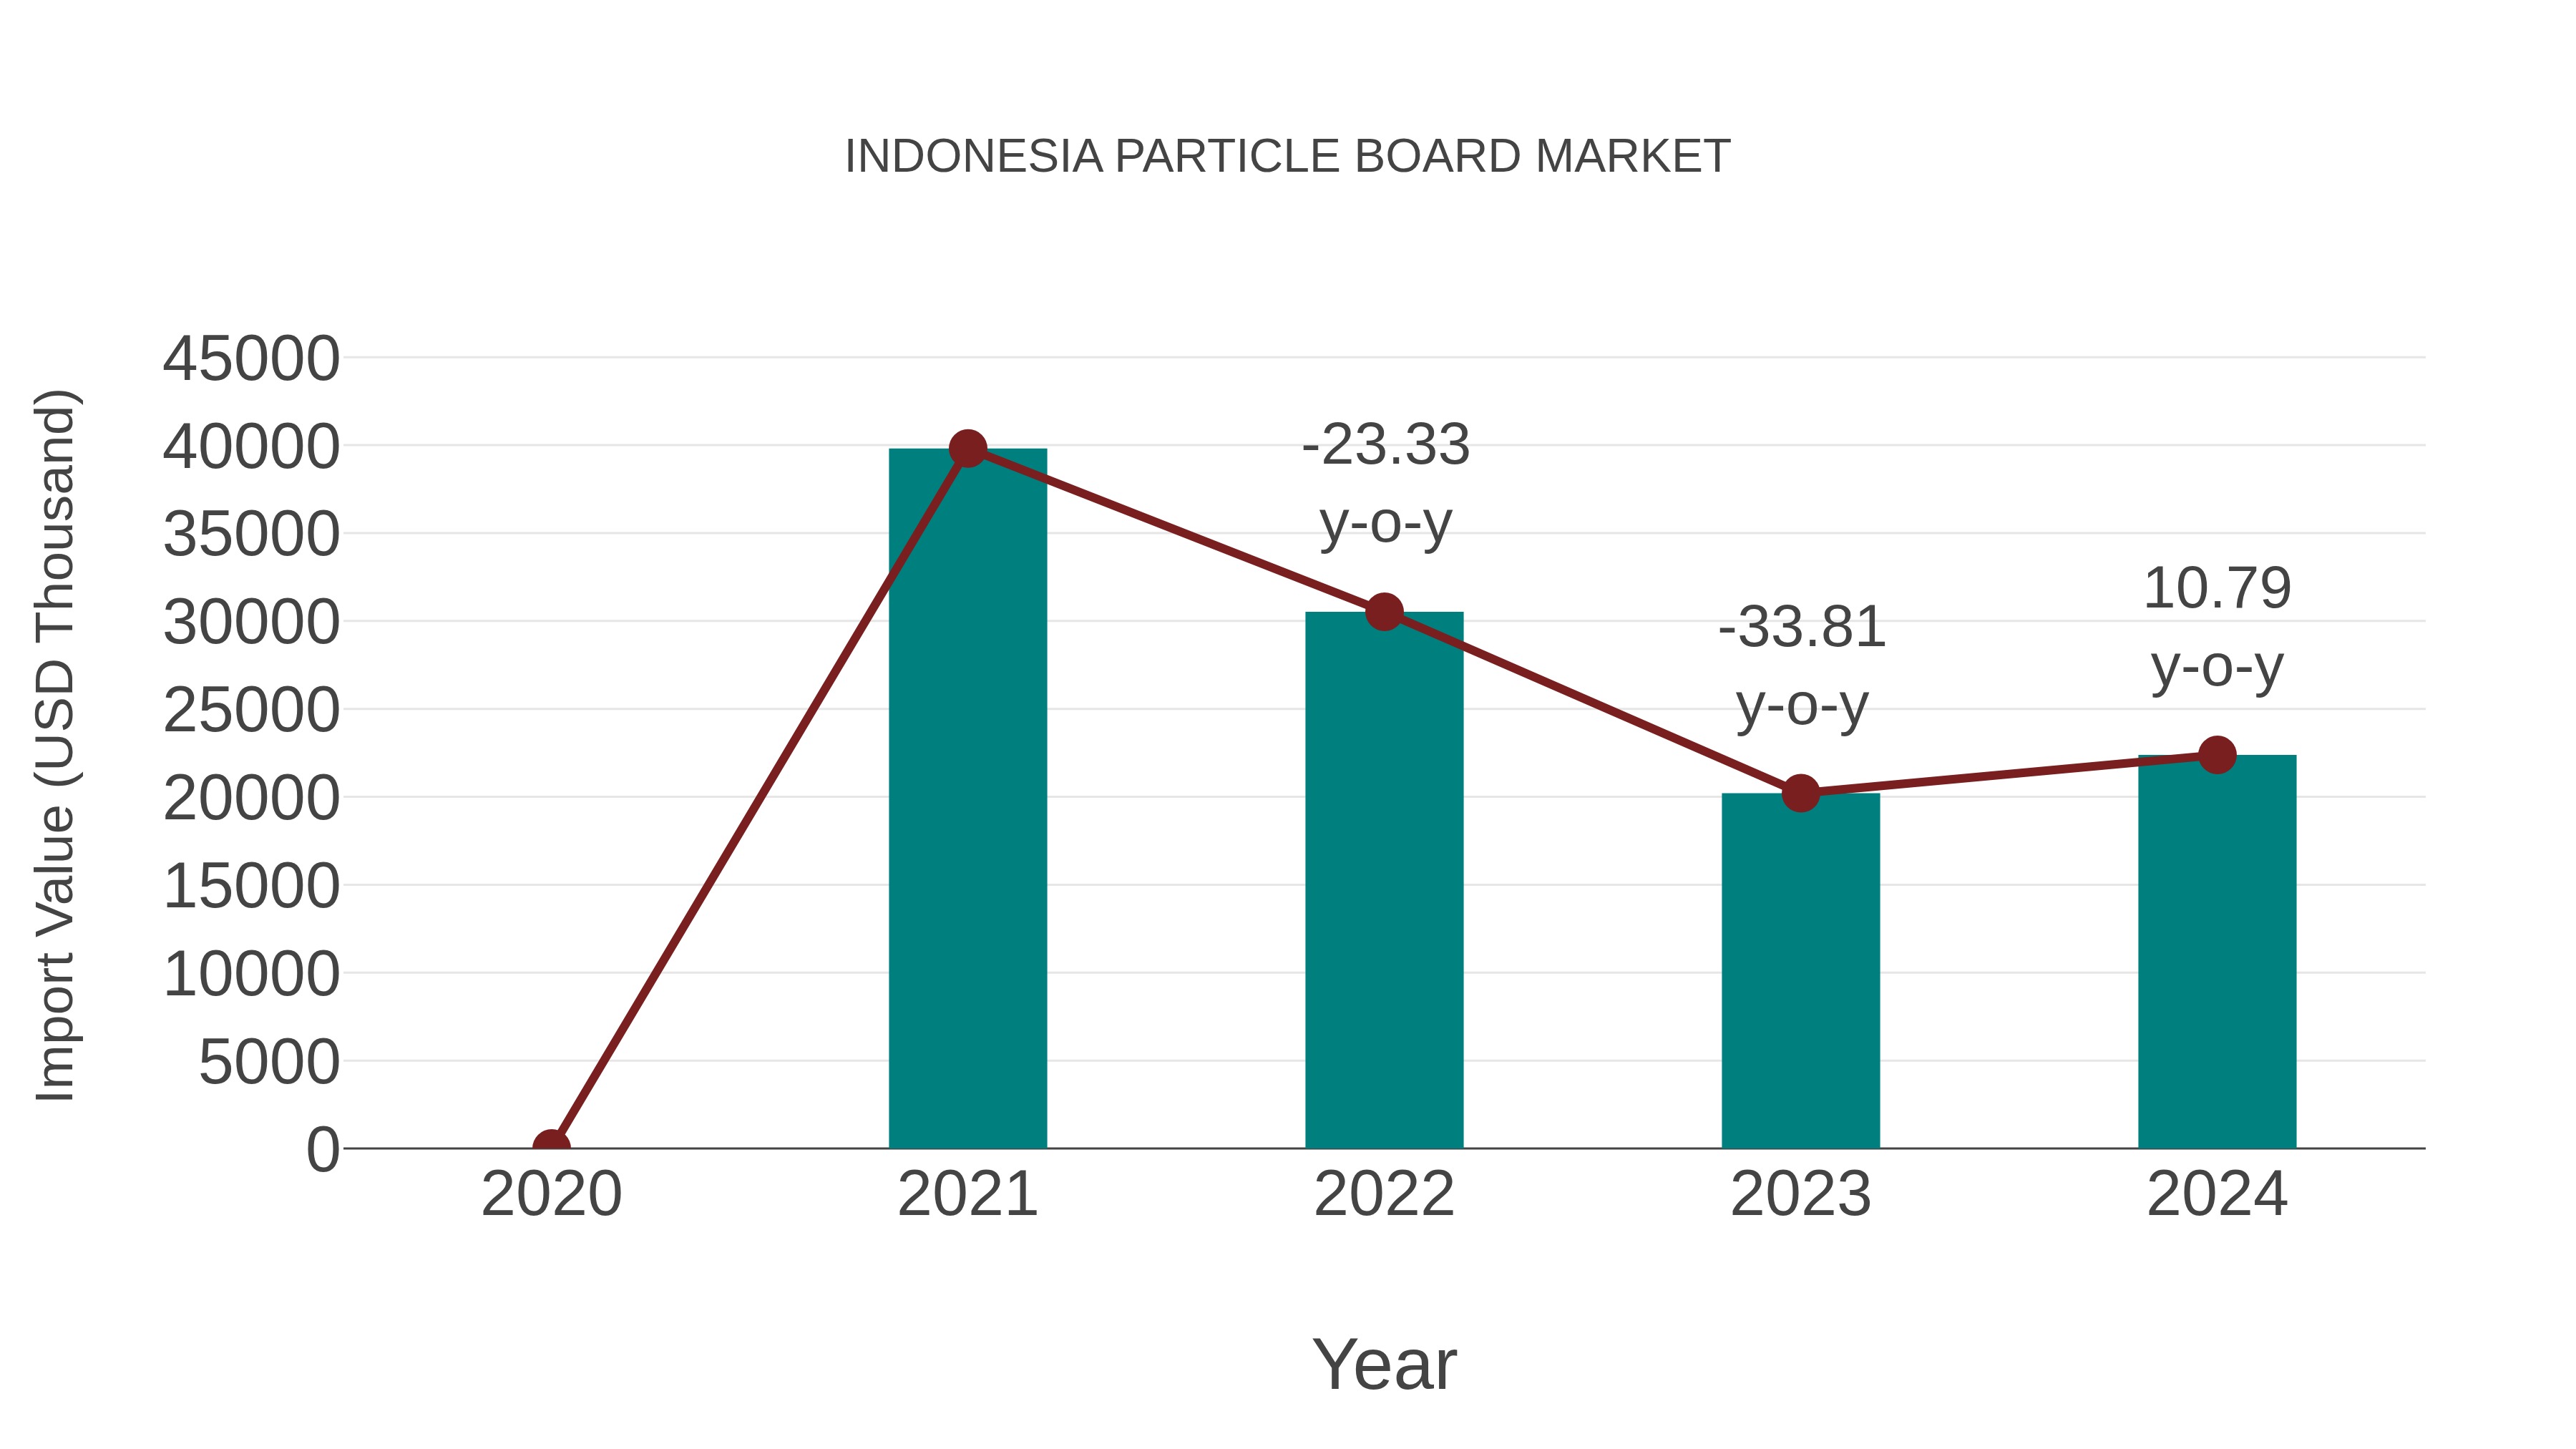
Indonesia Particle Board Market: Import Trend Analysis
In the Indonesia particle board market, the import trend showed a growth rate of 10.79% from 2023 to 2024, while the compound annual growth rate (CAGR) for 2020-2024 was -17.46%. This decline in the CAGR could be attributed to shifts in demand patterns or changes in trade policies impacting market stability.
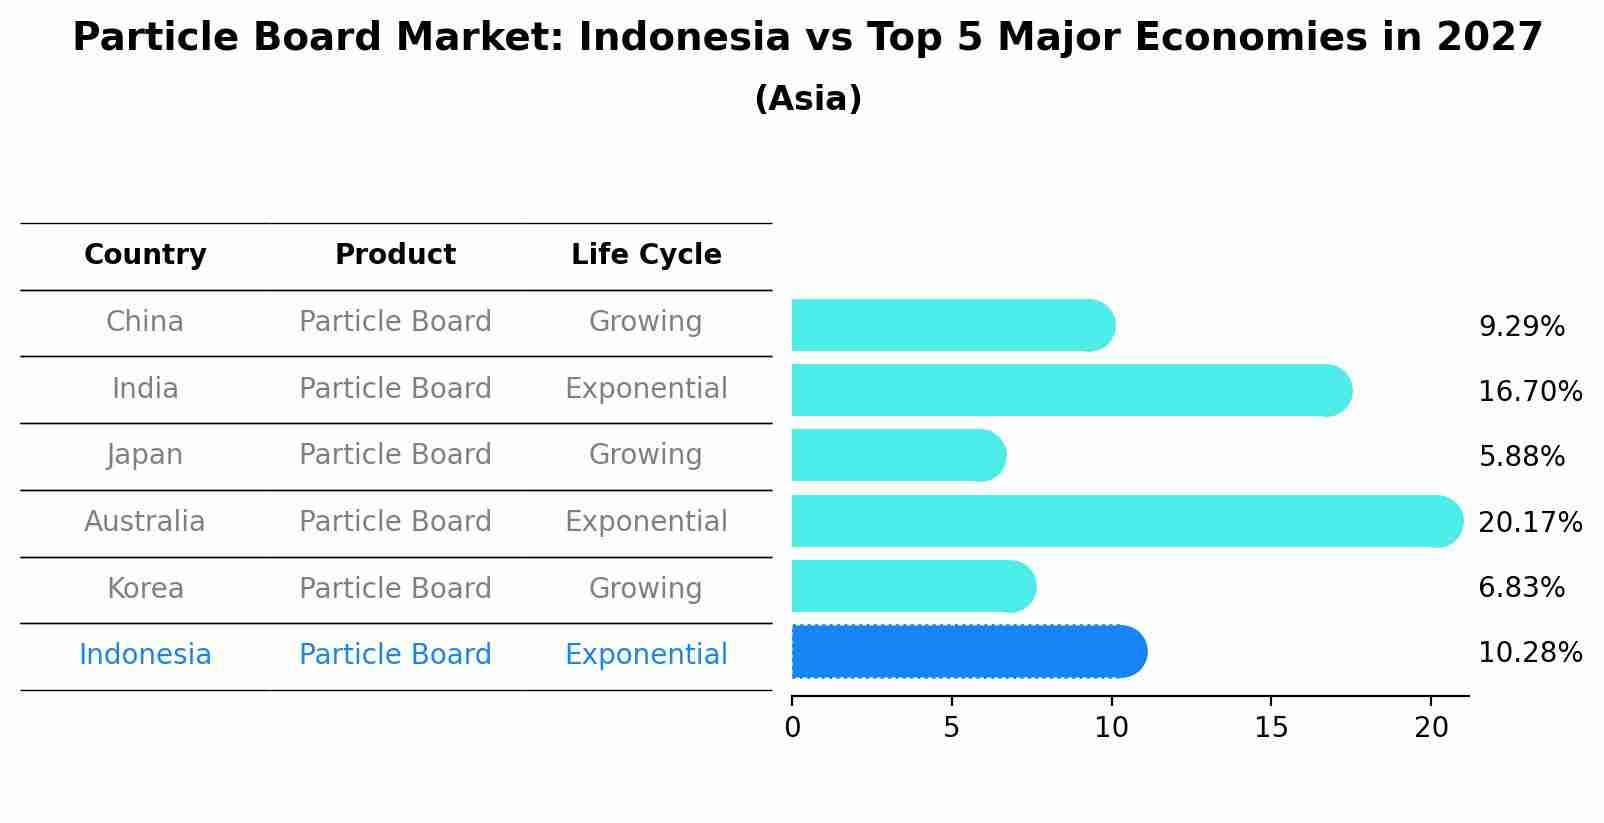
Particle Board Market: Indonesia vs Top 5 Major Economies in 2027 (Asia)
In the Asia region, the Particle Board market in Indonesia is projected to expand at a high growth rate of 10.28% by 2027. The largest economy is China, followed by India, Japan, Australia and South Korea.
Indonesia Particle Board Market Synopsis
The Indonesia particle board market is expected to witness a CAGR of around 7% during theperiod (2020-2026). Particleboard also known as chipboard is a type of composite wood product composed of fragments or chips of wood bonded together with an adhesive binder and formed into a sheet. It is used in furniture production for both indoor and outdoor applications due to its low cost and easy availability. The increasing demand from residential construction activities along with the growing popularity of engineered wood products are driving theof the particle board market in Indonesia.
Key Factors Driving the Market
The key factor drivingin the Indonesia particle board market is rapid urbanization coupled with rising disposable income levels that have resulted in increased demand for modern furniture products. Additionally environmental concerns about deforestation has led to greater preference for engineered wood products such as particle boards which are considered more sustainable than natural timber. Furthermore technological developments such as improved adhesives and resins used in manufacturing processes have enabled producers to manufacture better quality boards at lower prices thus creating further opportunities within the Indonesia particleboard sector.
Challenges Facing the Market
However certain challenges faced by players operating in thisinclude high raw material costs associated with producing MDF PBs due to volatile prices on global markets; fluctuations caused by seasonal supply demand issues higher transportation costs associated with importing resources from other countries including Malaysia or Thailand. Moreover strict regulations imposed by government bodies related to emission control can be seen hindering marketover short term period since they often increase production costs significantly making it difficult for manufacturers stay competitive while maintaining profitability margins intact.
Key Highlights of the Report:
- Indonesia Particle Board Market Outlook
- Market Size of Indonesia Particle Board Market, 2023
- Forecast of Indonesia Particle Board Market, 2030
- Historical Data and Forecast of Indonesia Particle Board Revenues & Volume for the Period 2020-2030
- Indonesia Particle Board Market Trend Evolution
- Indonesia Particle Board Market Drivers and Challenges
- Indonesia Particle Board Price Trends
- Indonesia Particle Board Porter's Five Forces
- Indonesia Particle Board Industry Life Cycle
- Historical Data and Forecast of Indonesia Particle Board Market Revenues & Volume By Type for the Period 2020-2030
- Historical Data and Forecast of Indonesia Particle Board Market Revenues & Volume By Standard Chipboard for the Period 2020-2030
- Historical Data and Forecast of Indonesia Particle Board Market Revenues & Volume By Melamine Veneered Chipboard for the Period 2020-2030
- Historical Data and Forecast of Indonesia Particle Board Market Revenues & Volume By Flooring Grade Chipboard for the Period 2020-2030
- Historical Data and Forecast of Indonesia Particle Board Market Revenues & Volume By Wood Veneered Chipboard for the Period 2020-2030
- Historical Data and Forecast of Indonesia Particle Board Market Revenues & Volume By Plastic Veneered Chipboard for the Period 2020-2030
- Historical Data and Forecast of Indonesia Particle Board Market Revenues & Volume By Other for the Period 2020-2030
- Historical Data and Forecast of Indonesia Particle Board Market Revenues & Volume By Application for the Period 2020-2030
- Historical Data and Forecast of Indonesia Particle Board Market Revenues & Volume By Construction for the Period 2020-2030
- Historical Data and Forecast of Indonesia Particle Board Market Revenues & Volume By Furniture for the Period 2020-2030
- Historical Data and Forecast of Indonesia Particle Board Market Revenues & Volume By Infrastructure for the Period 2020-2030
- Historical Data and Forecast of Indonesia Particle Board Market Revenues & Volume By Other for the Period 2020-2030
- Indonesia Particle Board Import Export Trade Statistics
- Market Opportunity Assessment By Type
- Market Opportunity Assessment By Application
- Indonesia Particle Board Top Companies Market Share
- Indonesia Particle Board Competitive Benchmarking By Technical and Operational Parameters
- Indonesia Particle Board Company Profiles
- Indonesia Particle Board Key Strategic Recommendations
Frequently Asked Questions About the Market Study (FAQs):
6Wresearch actively monitors the Indonesia Particle Board Market and publishes its comprehensive annual report, highlighting emerging trends, growth drivers, revenue analysis, and forecast outlook. Our insights help businesses to make data-backed strategic decisions with ongoing market dynamics. Our analysts track relevent industries related to the Indonesia Particle Board Market, allowing our clients with actionable intelligence and reliable forecasts tailored to emerging regional needs.
Yes, we provide customisation as per your requirements. To learn more, feel free to contact us on sales@6wresearch.com
1 Executive Summary |
2 Introduction |
2.1 Key Highlights of the Report |
2.2 Report Description |
2.3 Market Scope & Segmentation |
2.4 Research Methodology |
2.5 Assumptions |
3 Indonesia Particle Board Market Overview |
3.1 Indonesia Country Macro Economic Indicators |
3.2 Indonesia Particle Board Market Revenues & Volume, 2020 & 2030F |
3.3 Indonesia Particle Board Market - Industry Life Cycle |
3.4 Indonesia Particle Board Market - Porter's Five Forces |
3.5 Indonesia Particle Board Market Revenues & Volume Share, By Type, 2020 & 2030F |
3.6 Indonesia Particle Board Market Revenues & Volume Share, By Application, 2020 & 2030F |
4 Indonesia Particle Board Market Dynamics |
4.1 Impact Analysis |
4.2 Market Drivers |
4.2.1 Increasing demand for affordable and sustainable construction materials in Indonesia |
4.2.2 Growth in the furniture industry, which is a key end-user of particle boards |
4.2.3 Government initiatives promoting the use of eco-friendly materials in construction projects |
4.3 Market Restraints |
4.3.1 Fluctuations in raw material prices, such as wood chips and resin, impacting production costs |
4.3.2 Competition from alternative materials like plywood and MDF |
4.3.3 Economic volatility affecting consumer spending and construction activities |
5 Indonesia Particle Board Market Trends |
6 Indonesia Particle Board Market, By Types |
6.1 Indonesia Particle Board Market, By Type |
6.1.1 Overview and Analysis |
6.1.2 Indonesia Particle Board Market Revenues & Volume, By Type, 2020-2030F |
6.1.3 Indonesia Particle Board Market Revenues & Volume, By Standard Chipboard, 2020-2030F |
6.1.4 Indonesia Particle Board Market Revenues & Volume, By Melamine Veneered Chipboard, 2020-2030F |
6.1.5 Indonesia Particle Board Market Revenues & Volume, By Flooring Grade Chipboard, 2020-2030F |
6.1.6 Indonesia Particle Board Market Revenues & Volume, By Wood Veneered Chipboard, 2020-2030F |
6.1.7 Indonesia Particle Board Market Revenues & Volume, By Plastic Veneered Chipboard, 2020-2030F |
6.1.8 Indonesia Particle Board Market Revenues & Volume, By Other, 2020-2030F |
6.2 Indonesia Particle Board Market, By Application |
6.2.1 Overview and Analysis |
6.2.2 Indonesia Particle Board Market Revenues & Volume, By Construction, 2020-2030F |
6.2.3 Indonesia Particle Board Market Revenues & Volume, By Furniture, 2020-2030F |
6.2.4 Indonesia Particle Board Market Revenues & Volume, By Infrastructure, 2020-2030F |
6.2.5 Indonesia Particle Board Market Revenues & Volume, By Other, 2020-2030F |
7 Indonesia Particle Board Market Import-Export Trade Statistics |
7.1 Indonesia Particle Board Market Export to Major Countries |
7.2 Indonesia Particle Board Market Imports from Major Countries |
8 Indonesia Particle Board Market Key Performance Indicators |
8.1 Sustainability certifications obtained by particle board manufacturers |
8.2 Adoption rate of particle boards in new construction projects |
8.3 Average lead time for particle board production and delivery to customers |
9 Indonesia Particle Board Market - Opportunity Assessment |
9.1 Indonesia Particle Board Market Opportunity Assessment, By Type, 2020 & 2030F |
9.2 Indonesia Particle Board Market Opportunity Assessment, By Application, 2020 & 2030F |
10 Indonesia Particle Board Market - Competitive Landscape |
10.1 Indonesia Particle Board Market Revenue Share, By Companies, 2023 |
10.2 Indonesia Particle Board Market Competitive Benchmarking, By Operating and Technical Parameters |
11 Company Profiles |
12 Recommendations |
13 Disclaimer |
Global Go To Market Strategy - 2030
Export potential enables firms to identify high-growth global markets with greater confidence by combining advanced trade intelligence with a structured quantitative methodology. The framework analyzes emerging demand trends and country-level import patterns while integrating macroeconomic and trade datasets such as GDP and population forecasts, bilateral import–export flows, tariff structures, elasticity differentials between developed and developing economies, geographic distance, and import demand projections. Using weighted trade values from 2020–2024 as the base period to project country-to-country export potential for 2030, these inputs are operationalized through calculated drivers such as gravity model parameters, tariff impact factors, and projected GDP per-capita growth. Through an analysis of hidden potentials, demand hotspots, and market conditions that are most favorable to success, this method enables firms to focus on target countries, maximize returns, and global expansion with data, backed by accuracy.
By factoring in the projected importer demand gap that is currently unmet and could be potential opportunity, it identifies the potential for the Exporter (Country) among 190 countries, against the general trade analysis, which identifies the biggest importer or exporter.
To discover high-growth global markets and optimize your business strategy:
Click Here
Pricing
- Single User License$ 1,995
- Department License$ 2,400
- Site License$ 3,120
- Global License$ 3,795

Leadership Perspectives from Industry Events
Search
Thought Leadership and Analyst Meet


Our Clients
6WResearch In News
- Smartphones Lead India's Exports potential at $94 Billion by 2031 — But $30.1 Billion in Untapped Markets Is the Real Story
- India Air Conditioner Market Set for Strong Rebound in 2026 After Weather-Led Correction and GST-Driven Recovery: 6Wresearch
- ADAS in India: How Automatic Emergency Braking, Blind Spot Detection & Driver Monitoring are Transforming Road Safety
- Doha a strategic location for EV manufacturing hub: IPA Qatar
- Demand for luxury TVs surging in the GCC, says Samsung
- Empowering Growth: The Thriving Journey of Bangladesh’s Cable Industry
Latest Reports
- Gabon Citrullinemia Type-1 Market (2026-2032)
- Finland Citrullinemia Type-1 Market (2026-2032)
- Fiji Citrullinemia Type-1 Market (2026-2032)
- Ethiopia Citrullinemia Type-1 Market (2026-2032)
- Estonia Citrullinemia Type-1 Market (2026-2032)
- Eritrea Citrullinemia Type-1 Market (2026-2032)
- Equatorial Guinea Citrullinemia Type-1 Market (2026-2032)
- El Salvador Citrullinemia Type-1 Market (2026-2032)
- Ecuador Citrullinemia Type-1 Market (2026-2032)
- Dominica Citrullinemia Type-1 Market (2026-2032)
Industry Events and Analyst Meet

EV India Expo 2026

HIMTEX 2026

India Refining Summit 2026

India EV Show 2026

EV tech India Expo 2026
Whitepaper
- Middle East & Africa Commercial Security Market Click here to view more.
- Middle East & Africa Fire Safety Systems & Equipment Market Click here to view more.
- GCC Drone Market Click here to view more.
- Middle East Lighting Fixture Market Click here to view more.
- GCC Physical & Perimeter Security Market Click here to view more.