Indonesia Precipitated Silica Market (2026-2032) Outlook | Growth, Size, Analysis, Companies, Value, Revenue, Industry, Trends, Share & Forecast
Market Forecast By End Use Industry (Automobiles, Cosmetics, Electronics, Agriculture), By Application (Rubber, Personal Care, Food, Battery Separator, Coating & Inks, Adhesives & Sealants) And Competitive Landscape
| Product Code: ETC4482269 | Publication Date: Jul 2023 | Updated Date: Mar 2026 | Product Type: Report | |
| Publisher: 6Wresearch | Author: Ravi Bhandari | No. of Pages: 85 | No. of Figures: 45 | No. of Tables: 25 |
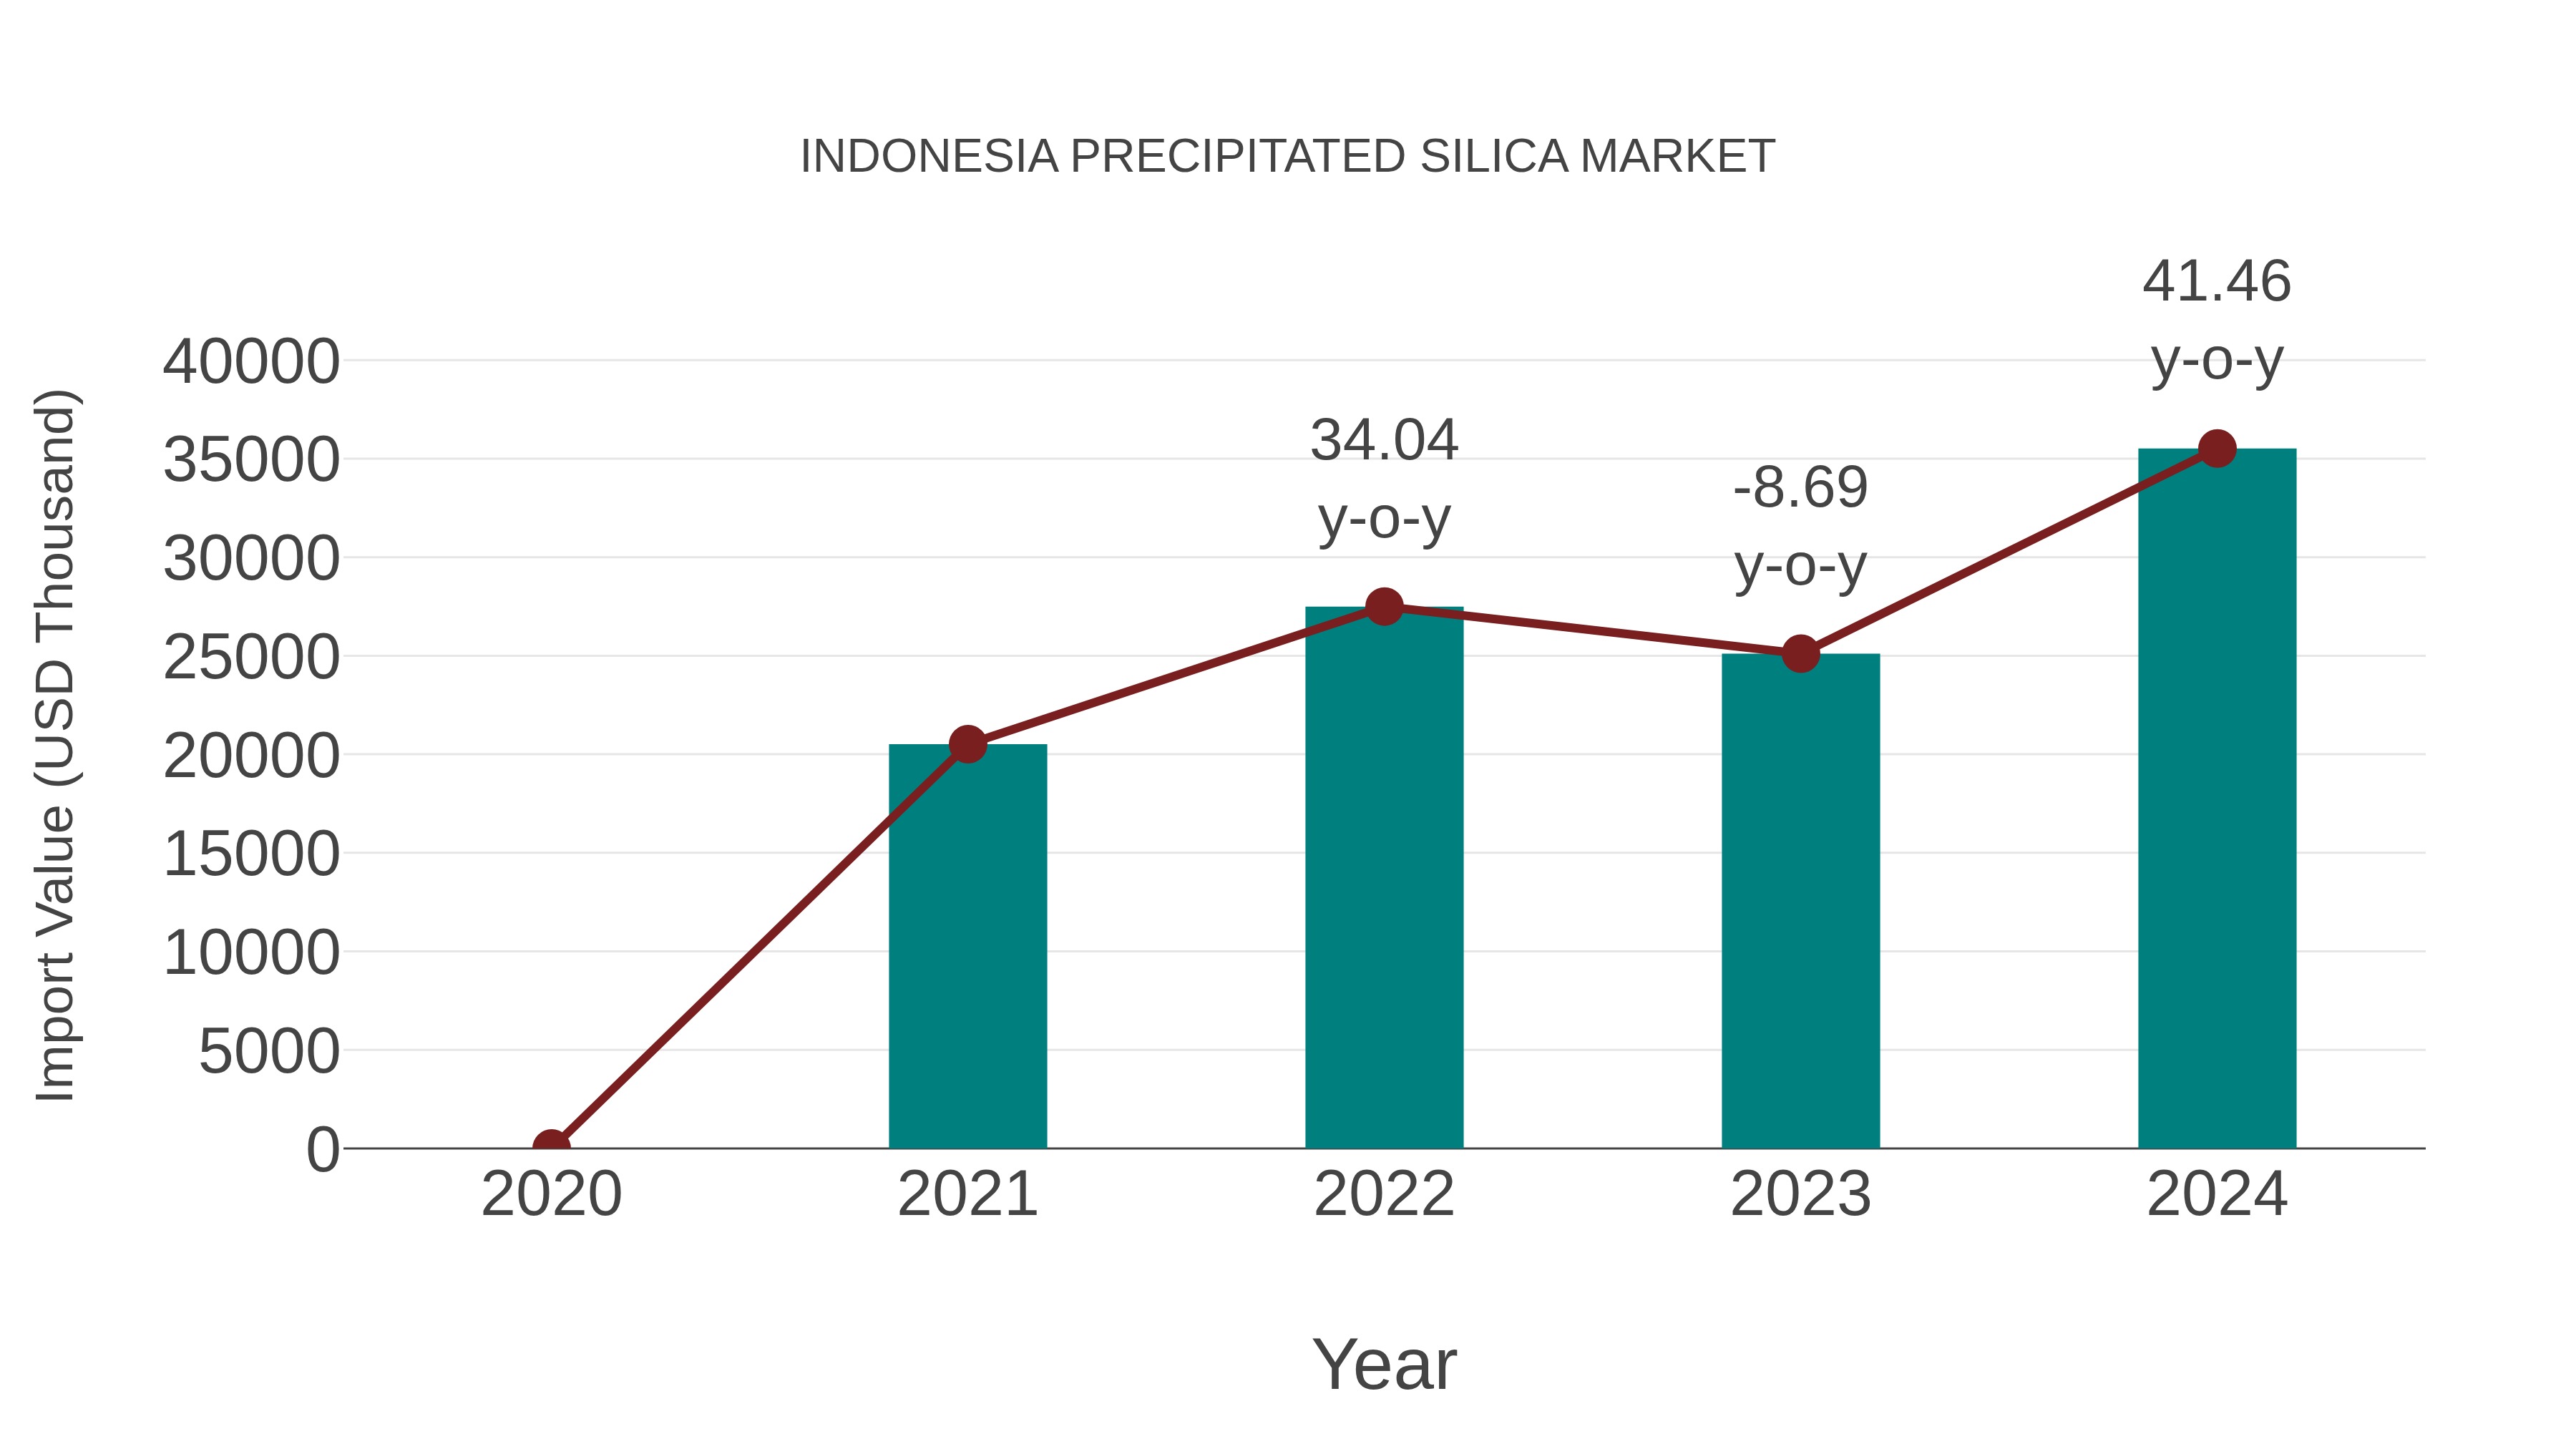
Indonesia Precipitated Silica Market: Import Trend Analysis
In the Indonesia precipitated silica market, the import trend showed significant growth from 2023 to 2024, with a growth rate of 41.46%. The compound annual growth rate (CAGR) for imports from 2020 to 2024 was 20.08%. This surge in imports can be attributed to increased demand for specialized silica products in various industries, indicating a positive import momentum driven by evolving market dynamics.
Indonesia Precipitated Silica Market Overview
The Precipitated Silica market in Indonesia is experiencing robust growth owing to its wide-ranging applications in industries like rubber, pharmaceuticals, and personal care products. This specialized chemical is known for its reinforcing properties, making it indispensable in various manufacturing processes. The market is driven by the increasing demand for high-quality rubber products.
Drivers of the Market
The precipitated silica market in Indonesia is growing as a result of its multiple applications, including as a reinforcing filler in rubber and as a thickening and anti-caking agent in food and pharmaceuticals. The expansion of the automotive and construction sectors has amplified the need for high-performance rubber products, further fueling the demand for precipitated silica.
Challenges of the Market
Challenges in the precipitated silica market involve energy efficiency and waste management. The production of precipitated silica can be energy-intensive, and companies need to find ways to reduce energy consumption and improve waste disposal practices to meet sustainability goals.
COVID-19 Impacts on the Market
Nonylphenol ethoxylates are used in various industries, including textiles and agrochemicals. The market faced disruptions in supply chains due to the pandemic, and the textile industry`s slowdown affected demand. However, recovery in these sectors is expected to drive market growth.
Key Players of the Makret
Leading companies in the Indonesian precipitated silica market consist of PT. Silica Tech Indonesia, PT. Indo Silika Sejahtera, and PT. Silmaco Silica Industry.
Key Highlights of the Report:
- Indonesia Precipitated Silica Market Outlook
- Market Size of Indonesia Precipitated Silica Market, 2025
- Forecast of Indonesia Precipitated Silica Market, 2032
- Historical Data and Forecast of Indonesia Precipitated Silica Revenues & Volume for the Period 2022-2032F
- Indonesia Precipitated Silica Market Trend Evolution
- Indonesia Precipitated Silica Market Drivers and Challenges
- Indonesia Precipitated Silica Price Trends
- Indonesia Precipitated Silica Porter's Five Forces
- Indonesia Precipitated Silica Industry Life Cycle
- Historical Data and Forecast of Indonesia Precipitated Silica Market Revenues & Volume By End Use Industry for the Period 2022-2032F
- Historical Data and Forecast of Indonesia Precipitated Silica Market Revenues & Volume By Automobiles for the Period 2022-2032F
- Historical Data and Forecast of Indonesia Precipitated Silica Market Revenues & Volume By Cosmetics for the Period 2022-2032F
- Historical Data and Forecast of Indonesia Precipitated Silica Market Revenues & Volume By Electronics for the Period 2022-2032F
- Historical Data and Forecast of Indonesia Precipitated Silica Market Revenues & Volume By Agriculture for the Period 2022-2032F
- Historical Data and Forecast of Indonesia Precipitated Silica Market Revenues & Volume By Application for the Period 2022-2032F
- Historical Data and Forecast of Indonesia Precipitated Silica Market Revenues & Volume By Rubber for the Period 2022-2032F
- Historical Data and Forecast of Indonesia Precipitated Silica Market Revenues & Volume By Personal Care for the Period 2022-2032F
- Historical Data and Forecast of Indonesia Precipitated Silica Market Revenues & Volume By Food for the Period 2022-2032F
- Historical Data and Forecast of Indonesia Precipitated Silica Market Revenues & Volume By Battery Separator for the Period 2022-2032F
- Historical Data and Forecast of Indonesia Precipitated Silica Market Revenues & Volume By Coating & Inks for the Period 2022-2032F
- Historical Data and Forecast of Indonesia Precipitated Silica Market Revenues & Volume By Adhesives & Sealants for the Period 2022-2032F
- Indonesia Precipitated Silica Import Export Trade Statistics
- Market Opportunity Assessment By End Use Industry
- Market Opportunity Assessment By Application
- Indonesia Precipitated Silica Top Companies Market Share
- Indonesia Precipitated Silica Competitive Benchmarking By Technical and Operational Parameters
- Indonesia Precipitated Silica Company Profiles
- Indonesia Precipitated Silica Key Strategic Recommendations
Indonesia Precipitated Silica Market (2026-2032): FAQs
6Wresearch actively monitors the Indonesia Precipitated Silica Market and publishes its comprehensive annual report, highlighting emerging trends, growth drivers, revenue analysis, and forecast outlook. Our insights help businesses to make data-backed strategic decisions with ongoing market dynamics. Our analysts track relevent industries related to the Indonesia Precipitated Silica Market, allowing our clients with actionable intelligence and reliable forecasts tailored to emerging regional needs.
Yes, we provide customisation as per your requirements. To learn more, feel free to contact us on sales@6wresearch.com
1 Executive Summary |
2 Introduction |
2.1 Key Highlights of the Report |
2.2 Report Description |
2.3 Market Scope & Segmentation |
2.4 Research Methodology |
2.5 Assumptions |
3 Indonesia Precipitated Silica Market Overview |
3.1 Indonesia Country Macro Economic Indicators |
3.2 Indonesia Precipitated Silica Market Revenues & Volume, 2022 & 2032F |
3.3 Indonesia Precipitated Silica Market - Industry Life Cycle |
3.4 Indonesia Precipitated Silica Market - Porter's Five Forces |
3.5 Indonesia Precipitated Silica Market Revenues & Volume Share, By End Use Industry, 2022 & 2032F |
3.6 Indonesia Precipitated Silica Market Revenues & Volume Share, By Application, 2022 & 2032F |
4 Indonesia Precipitated Silica Market Dynamics |
4.1 Impact Analysis |
4.2 Market Drivers |
4.2.1 Increasing demand for eco-friendly products in various industries |
4.2.2 Growing applications in sectors like rubber, personal care, and food beverage |
4.2.3 Rising investments in infrastructure and construction projects in Indonesia |
4.3 Market Restraints |
4.3.1 Volatility in raw material prices |
4.3.2 Stringent regulations related to environmental concerns |
4.3.3 Intense competition from substitutes like fumed silica |
5 Indonesia Precipitated Silica Market Trends |
6 Indonesia Precipitated Silica Market, By Types |
6.1 Indonesia Precipitated Silica Market, By End Use Industry |
6.1.1 Overview and Analysis |
6.1.2 Indonesia Precipitated Silica Market Revenues & Volume, By End Use Industry, 2022-2032F |
6.1.3 Indonesia Precipitated Silica Market Revenues & Volume, By Automobiles, 2022-2032F |
6.1.4 Indonesia Precipitated Silica Market Revenues & Volume, By Cosmetics, 2022-2032F |
6.1.5 Indonesia Precipitated Silica Market Revenues & Volume, By Electronics, 2022-2032F |
6.1.6 Indonesia Precipitated Silica Market Revenues & Volume, By Agriculture, 2022-2032F |
6.2 Indonesia Precipitated Silica Market, By Application |
6.2.1 Overview and Analysis |
6.2.2 Indonesia Precipitated Silica Market Revenues & Volume, By Rubber, 2022-2032F |
6.2.3 Indonesia Precipitated Silica Market Revenues & Volume, By Personal Care, 2022-2032F |
6.2.4 Indonesia Precipitated Silica Market Revenues & Volume, By Food, 2022-2032F |
6.2.5 Indonesia Precipitated Silica Market Revenues & Volume, By Battery Separator, 2022-2032F |
6.2.6 Indonesia Precipitated Silica Market Revenues & Volume, By Coating & Inks, 2022-2032F |
6.2.7 Indonesia Precipitated Silica Market Revenues & Volume, By Adhesives & Sealants, 2022-2032F |
7 Indonesia Precipitated Silica Market Import-Export Trade Statistics |
7.1 Indonesia Precipitated Silica Market Export to Major Countries |
7.2 Indonesia Precipitated Silica Market Imports from Major Countries |
8 Indonesia Precipitated Silica Market Key Performance Indicators |
8.1 Level of investment in research and development for product innovation |
8.2 Adoption rate of precipitated silica in new applications or industries |
8.3 Sustainability initiatives and certifications obtained by precipitated silica manufacturers |
9 Indonesia Precipitated Silica Market - Opportunity Assessment |
9.1 Indonesia Precipitated Silica Market Opportunity Assessment, By End Use Industry, 2022 & 2032F |
9.2 Indonesia Precipitated Silica Market Opportunity Assessment, By Application, 2022 & 2032F |
10 Indonesia Precipitated Silica Market - Competitive Landscape |
10.1 Indonesia Precipitated Silica Market Revenue Share, By Companies, 2025 |
10.2 Indonesia Precipitated Silica Market Competitive Benchmarking, By Operating and Technical Parameters |
11 Company Profiles |
12 Recommendations |
13 Disclaimer |
Global Go To Market Strategy - 2030
Export potential enables firms to identify high-growth global markets with greater confidence by combining advanced trade intelligence with a structured quantitative methodology. The framework analyzes emerging demand trends and country-level import patterns while integrating macroeconomic and trade datasets such as GDP and population forecasts, bilateral import–export flows, tariff structures, elasticity differentials between developed and developing economies, geographic distance, and import demand projections. Using weighted trade values from 2020–2024 as the base period to project country-to-country export potential for 2030, these inputs are operationalized through calculated drivers such as gravity model parameters, tariff impact factors, and projected GDP per-capita growth. Through an analysis of hidden potentials, demand hotspots, and market conditions that are most favorable to success, this method enables firms to focus on target countries, maximize returns, and global expansion with data, backed by accuracy.
By factoring in the projected importer demand gap that is currently unmet and could be potential opportunity, it identifies the potential for the Exporter (Country) among 190 countries, against the general trade analysis, which identifies the biggest importer or exporter.
To discover high-growth global markets and optimize your business strategy:
Click Here
Pricing
- Single User License$ 1,995
- Department License$ 2,400
- Site License$ 3,120
- Global License$ 3,795

Leadership Perspectives from Industry Events
Search
Thought Leadership and Analyst Meet


Our Clients
6WResearch In News
- India Air Conditioner Market Set for Strong Rebound in 2026 After Weather-Led Correction and GST-Driven Recovery: 6Wresearch
- ADAS in India: How Automatic Emergency Braking, Blind Spot Detection & Driver Monitoring are Transforming Road Safety
- Doha a strategic location for EV manufacturing hub: IPA Qatar
- Demand for luxury TVs surging in the GCC, says Samsung
- Empowering Growth: The Thriving Journey of Bangladesh’s Cable Industry
- Demand for luxury TVs surging in the GCC, says Samsung
Latest Reports
- Nicaragua RPG Gaming Market (2026-2032)
- New Zealand RPG Gaming Market (2026-2032)
- Netherlands RPG Gaming Market (2026-2032)
- Nauru RPG Gaming Market (2026-2032)
- Namibia RPG Gaming Market (2026-2032)
- Mozambique RPG Gaming Market (2026-2032)
- Montenegro RPG Gaming Market (2026-2032)
- Mongolia RPG Gaming Market (2026-2032)
- Monaco RPG Gaming Market (2026-2032)
- Micronesia RPG Gaming Market (2026-2032)
Industry Events and Analyst Meet

EV India Expo 2026

HIMTEX 2026

India Refining Summit 2026

India EV Show 2026

EV tech India Expo 2026
Whitepaper
- Middle East & Africa Commercial Security Market Click here to view more.
- Middle East & Africa Fire Safety Systems & Equipment Market Click here to view more.
- GCC Drone Market Click here to view more.
- Middle East Lighting Fixture Market Click here to view more.
- GCC Physical & Perimeter Security Market Click here to view more.