Indonesia Pulleys Market (2026-2032) | Size, Trends, Analysis, Companies, Outlook, Revenue, Value, Growth, Industry, Forecast, Share
Market Forecast By Type (Steel, Cast Iron, Glass Filled Polymer), By Applications (OEM, Aftermarket) And Competitive Landscape
| Product Code: ETC045248 | Publication Date: Jul 2023 | Updated Date: Jun 2026 | Product Type: Report | |
| Publisher: 6Wresearch | Author: Ravi Bhandari | No. of Pages: 70 | No. of Figures: 35 | No. of Tables: 5 |
Indonesia Pulleys Market Summary
The indonesia pulleys market was estimated at USD 202 Million in 2025 and is projected to reach USD 268 Million by 2032, growing at a CAGR of 5.1% from 2026 to 2032.
Indonesia Pulleys Market Growth Rate Analysis (2021-2032)
The Indonesia pulleys market has exhibited notable fluctuations in growth over the past few years. Following a slight decline of 0.5% in 2021, the sector rebounded with a robust 4.4% growth in 2022, driven by an uptick in industrial activities and investments in infrastructure projects. This momentum continued into 2023, with an impressive 5.5% increase, fueled by rising consumer demand across various industries. Projections for 2024 and beyond suggest sustained growth, with rates hovering around 5% to 5.8% as companies increasingly adopt advanced manufacturing technologies and focus on energy transition initiatives. This trend highlights a significant shift toward modernization and efficiency, which is critical for meeting the demands of a thriving economy.
Indonesia Pulleys Market Year-wise Growth Rate and Key Drivers
This graph highlights how the Indonesia Pulleys Market has steadily grown over the years, supported by major growth factors.
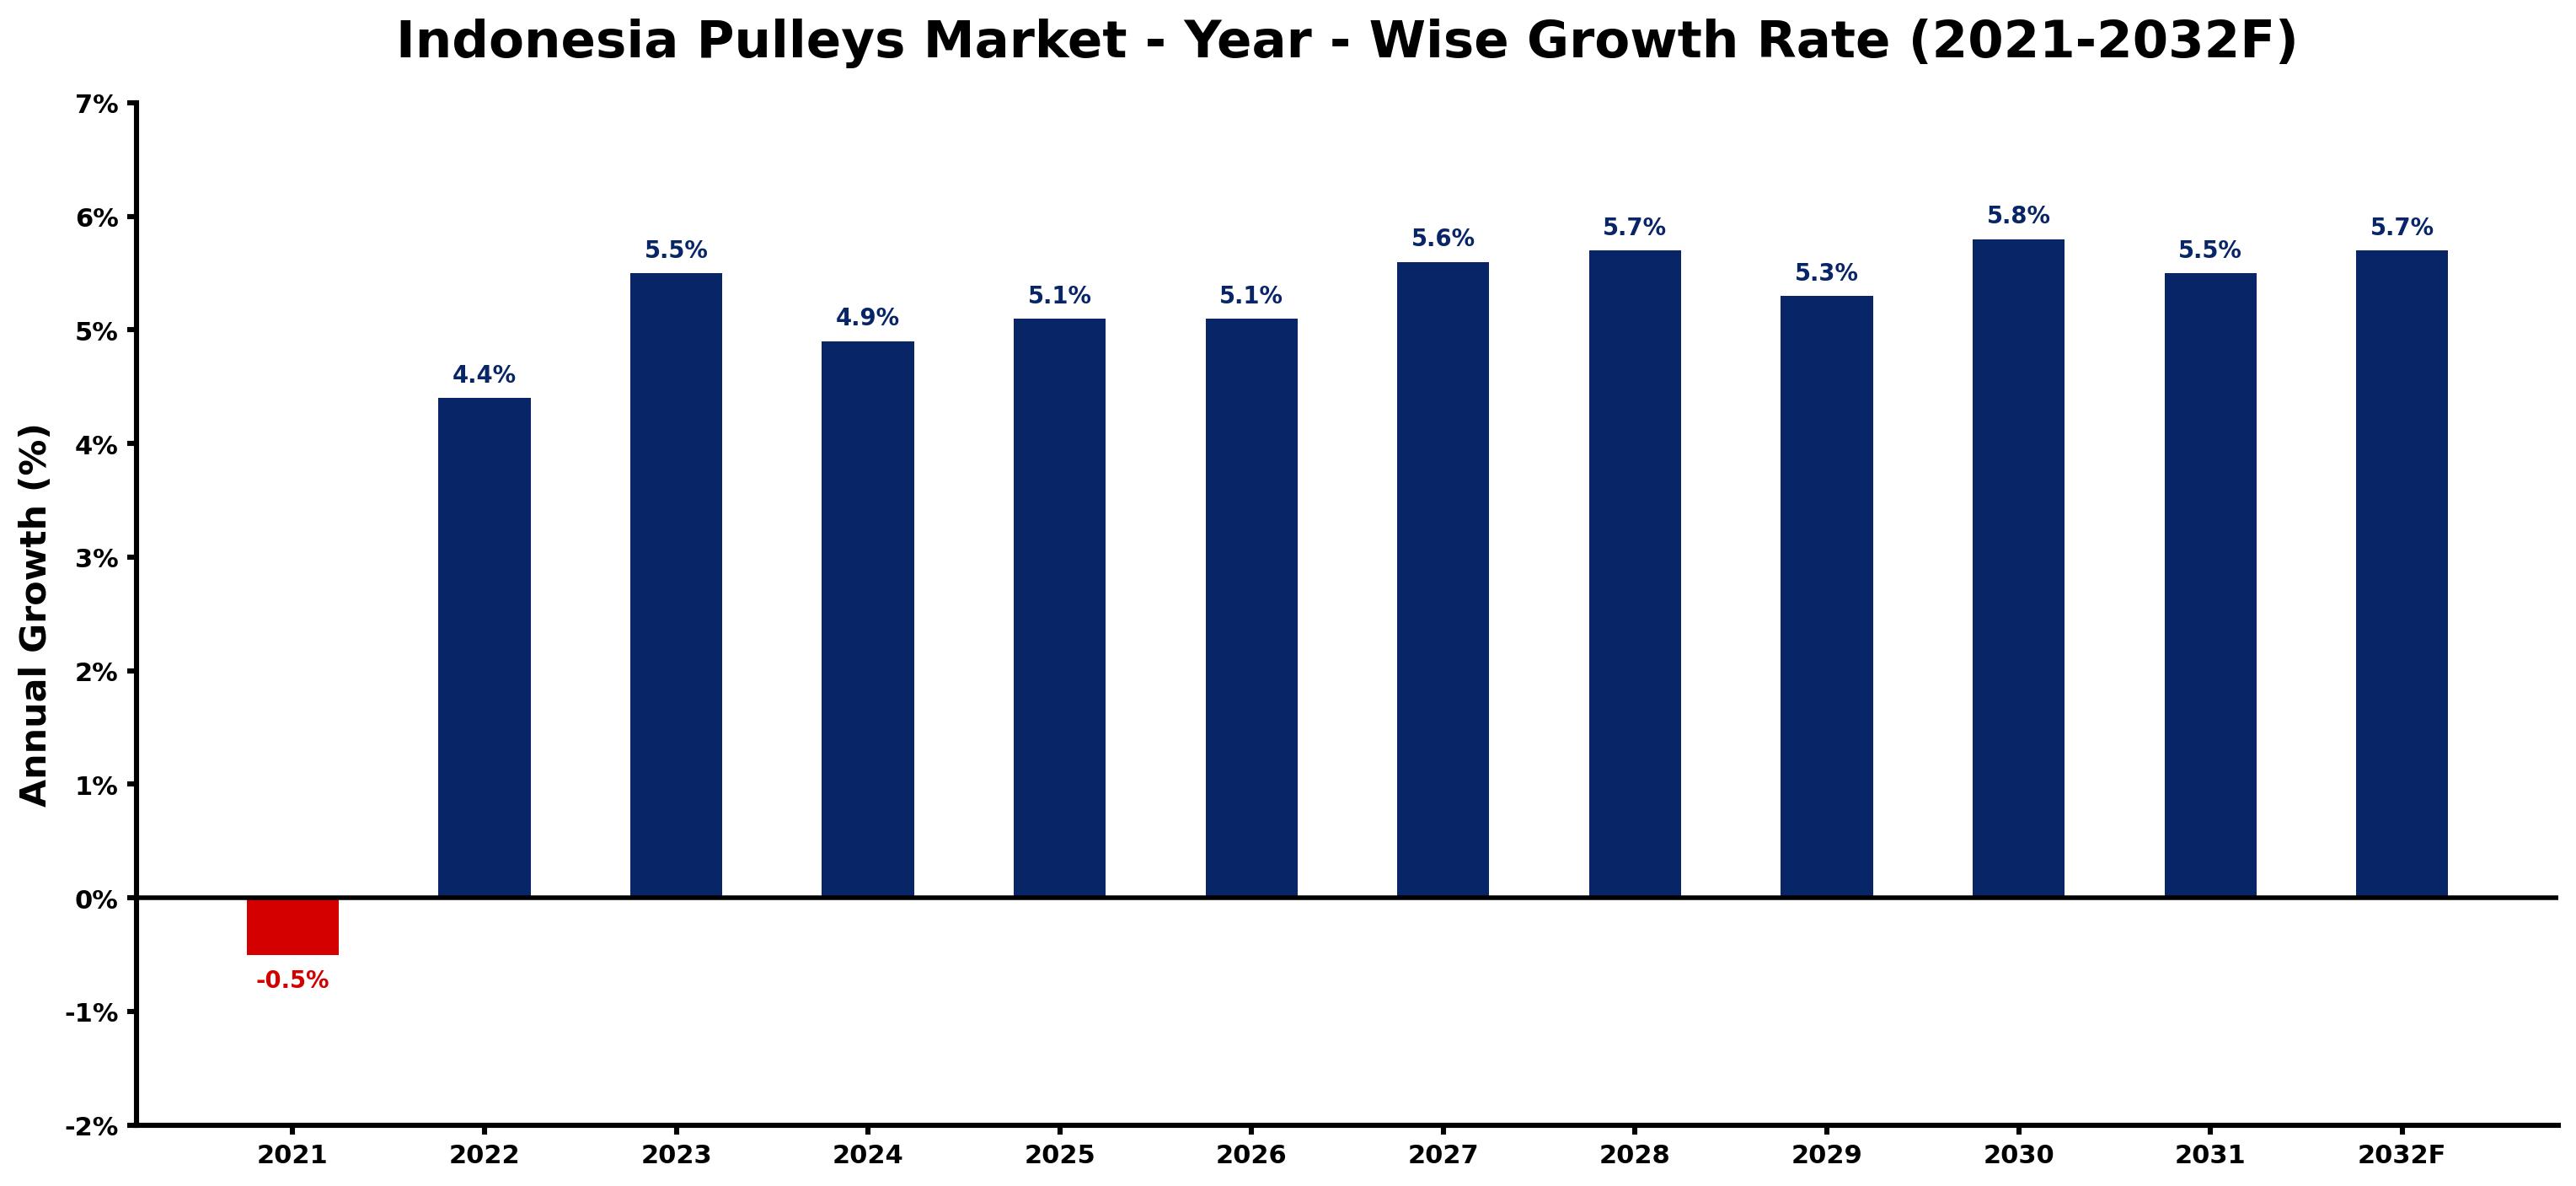
The table below presents the year wise growth rates along with the key drivers influencing the market
| Year | Growth Rate | Major Drivers |
| 2021 | -0.5% | Significant supply chain disruptions hampered production capabilities, leading to inadequate stock levels and reduced sales. |
| 2022 | 4.4% | Emerging infrastructure projects led to heightened demand for efficient pulley systems. |
| 2023 | 5.5% | Localized manufacturing initiatives fostered increased production of custom pulley solutions. |
| 2024 | 4.9% | Rising interest in renewable energy prompted pulley applications in wind and solar sectors. |
| 2025 | 5.1% | Modernization of transport systems necessitated advanced pulley technology for improved efficiency. |
| 2026 | 5.1% | Growing urbanization resulted in expanding construction projects requiring robust lifting equipment. |
| 2027 | 5.6% | Technological innovation in materials enhanced pulley durability and performance across industries. |
| 2028 | 5.7% | Increased focus on automation and robotics expanded pulley applications in manufacturing sectors. |
| 2029 | 5.3% | Enhanced logistics networks required optimized pulley systems for efficient material handling. |
| 2030 | 5.8% | Investment in smart cities promoted the integration of advanced pulley technology in urban design. |
| 2031 | 5.5% | Rising industrial standards demanded compliance, boosting the need for high-quality pulley products. |
| 2032 | 5.7% | Evolving customer expectations drove customization trends in pulley designs and functionalities. |
Note - Market size estimations and growth projections presented in this report are based on 6Wresearch's advanced forecasting approach, validated with industry datasets as of June 2026.
Indonesia Pulleys Market Synopsis
The Indonesia Pulleys Market is projected to reach 5.1% and witness significant growth during the forecast period (2026-2032). This expansion is fueled by several interrelated factors, including the rising demand for industrial machinery and a host of government initiatives aimed at bolstering the manufacturing sector. The influx of foreign investment into various industries, notably food and beverages as well as automotive, has further intensified the demand for pulleys from domestic manufacturers. Additionally, increasing consumer spending on durable goods has amplified the sales of pulleys utilized in diverse applications such as automotive and home appliances, thereby enhancing market dynamics.
Indonesia Pulleys Market Growth Drivers
Key factors driving the Indonesia Pulleys Market include:
- Rising disposable income levels among individuals have led to increased consumer spending, particularly on durable goods, which is a significant catalyst for the pulleys market.
- Improving living standards and a growing usage rate of household appliances contribute to the rising demand for pulleys in various applications.
- The favorable government policies focused on encouraging investment across manufacturing sectors create a conducive environment for market growth.
- Technological advancements within the manufacturing processes lead to enhanced product quality, thereby increasing the attractiveness of different pulley types.
- A surge in industrial automation activities throughout various sectors necessitates a greater number of machines installed in manufacturing plants, further driving the pulleys market.
Indonesia Pulleys Market Challenges and Restraints
Despite the robust growth potential, the Indonesia Pulleys Market faces several challenges:
- A lack of infrastructure facilities hampers transport operations, often causing delays in raw material delivery times that can disrupt production cycles.
- Fluctuations in raw material prices due to volatile currency exchange rates complicate cost estimations for manufacturers, posing a risk to profitability.
- The presence of low-cost competitors offering substitute products may threaten the market share and profitability of established manufacturers.
- Inconsistencies in product quality, particularly from low-cost alternatives, can undermine customer confidence and preference for established brands.
- The competitive landscape is evolving, making it crucial for companies to adopt innovative strategies to maintain their market positions.
Indonesia Pulleys Market Government Investment and Initiatives
The Indonesian government has implemented various investment initiatives and policies that significantly affect the pulleys market. Comprehensive development plans seek to enhance the manufacturing sector's capabilities, providing tax incentives and subsidies aimed at attracting foreign investments. Public spending on infrastructure projects is on the rise, designed to improve transportation networks that are crucial for the timely delivery of raw materials and finished products. Additionally, the government is promoting technological advancements and better workforce training, ensuring that the local talent pool can meet the evolving demands of the industry. This environment fosters collaboration between governmental bodies and the private sector, creating a robust foundation for sustained market growth.
Indonesia Pulleys Market Latest Developments (May 2025 - June 2026)
Recent developments in the Indonesia Pulleys Market indicate a shift towards enhanced automation and efficiency across various sectors. Manufacturers are increasingly investing in advanced machinery and production methods, particularly in response to rising consumer expectations for quality and reliability. Partnerships between local firms and international entities are becoming more prominent, facilitating knowledge transfer and leading to innovative pulley designs tailored to specific industrial needs. Moreover, sustainability concerns are shaping product development strategies, with companies exploring eco-friendly materials and processes. These changes reflect a broader trend in which the market is adapting to new technological and environmental imperatives.
Indonesia Pulleys Market - Key Attractiveness of the Report
- 10 Years of Market Numbers
- Historical Data Starting from 2022 to 2025
- Base Year: 2025
- Forecast Data until 2032
- Key Performance Indicators Impacting the Market
- Major Upcoming Developments and Projects
Key Highlights of the Report:
- Indonesia Pulleys Market Outlook
- Market Size of Indonesia Pulleys Market, 2025
- Forecast of Indonesia Pulleys Market, 2032F
- Historical Data and Forecast of Indonesia Pulleys Revenues & Volume for the Period 2022-2032F
- Indonesia Pulleys Market Trend Evolution
- Indonesia Pulleys Market Drivers and Challenges
- Indonesia Pulleys Price Trends
- Indonesia Pulleys Porter's Five Forces
- Indonesia Pulleys Industry Life Cycle
- Historical Data and Forecast of Indonesia Pulleys Market Revenues & Volume By Type for the Period 2022-2032F
- Historical Data and Forecast of Indonesia Pulleys Market Revenues & Volume By Steel for the Period 2022-2032F
- Historical Data and Forecast of Indonesia Pulleys Market Revenues & Volume By Cast Iron for the Period 2022-2032F
- Historical Data and Forecast of Indonesia Pulleys Market Revenues & Volume By Glass Filled Polymer for the Period 2022-2032F
- Historical Data and Forecast of Indonesia Pulleys Market Revenues & Volume By Applications for the Period 2022-2032F
- Historical Data and Forecast of Indonesia Pulleys Market Revenues & Volume By OEM for the Period 2022-2032F
- Historical Data and Forecast of Indonesia Pulleys Market Revenues & Volume By Aftermarket for the Period 2022-2032F
- Indonesia Pulleys Import Export Trade Statistics
- Market Opportunity Assessment By Type
- Market Opportunity Assessment By Applications
- Indonesia Pulleys Top Companies Market Share
- Indonesia Pulleys Competitive Benchmarking By Technical and Operational Parameters
- Indonesia Pulleys Company Profiles
- Indonesia Pulleys Key Strategic Recommendations
Frequently Asked Questions About the Market Study (FAQs):
The growth is primarily driven by increased disposable income, rising consumer spending on durable goods, improving living standards, and positive government initiatives.
Key challenges include infrastructure deficits, raw material price volatility, and the threat of low-cost competitors providing substitutes.
The government is promoting investment through tax incentives, focusing on infrastructure improvements, and fostering technological advancement and workforce development.
Recent trends include an increased focus on automation, partnerships for innovation, and a shift towards sustainability in manufacturing practices.
6Wresearch actively monitors the Indonesia Pulleys Market and publishes its comprehensive annual report, highlighting emerging trends, growth drivers, revenue analysis, and forecast outlook. Our insights help businesses to make data-backed strategic decisions with ongoing market dynamics. Our analysts track relevent industries related to the Indonesia Pulleys Market, allowing our clients with actionable intelligence and reliable forecasts tailored to emerging regional needs.
Yes, we provide customisation as per your requirements. To learn more, feel free to contact us on sales@6wresearch.com
1 Executive Summary |
2 Introduction |
2.1 Key Highlights of the Report |
2.2 Report Description |
2.3 Market Scope & Segmentation |
2.4 Research Methodology |
2.5 Assumptions |
3 Indonesia Pulleys Market Overview |
3.1 Indonesia Country Macro Economic Indicators |
3.2 Indonesia Pulleys Market Revenues & Volume, 2022 & 2032F |
3.3 Indonesia Pulleys Market - Industry Life Cycle |
3.4 Indonesia Pulleys Market - Porter's Five Forces |
3.5 Indonesia Pulleys Market Revenues & Volume Share, By Type, 2022 & 2032F |
3.6 Indonesia Pulleys Market Revenues & Volume Share, By Applications, 2022 & 2032F |
4 Indonesia Pulleys Market Dynamics |
4.1 Impact Analysis |
4.2 Market Drivers |
4.3 Market Restraints |
5 Indonesia Pulleys Market Trends |
6 Indonesia Pulleys Market, By Types |
6.1 Indonesia Pulleys Market, By Type |
6.1.1 Overview and Analysis |
6.1.2 Indonesia Pulleys Market Revenues & Volume, By Type, 2022-2032F |
6.1.3 Indonesia Pulleys Market Revenues & Volume, By Steel, 2022-2032F |
6.1.4 Indonesia Pulleys Market Revenues & Volume, By Cast Iron, 2022-2032F |
6.1.5 Indonesia Pulleys Market Revenues & Volume, By Glass Filled Polymer, 2022-2032F |
6.2 Indonesia Pulleys Market, By Applications |
6.2.1 Overview and Analysis |
6.2.2 Indonesia Pulleys Market Revenues & Volume, By OEM, 2022-2032F |
6.2.3 Indonesia Pulleys Market Revenues & Volume, By Aftermarket, 2022-2032F |
7 Indonesia Pulleys Market Import-Export Trade Statistics |
7.1 Indonesia Pulleys Market Export to Major Countries |
7.2 Indonesia Pulleys Market Imports from Major Countries |
8 Indonesia Pulleys Market Key Performance Indicators |
9 Indonesia Pulleys Market - Opportunity Assessment |
9.1 Indonesia Pulleys Market Opportunity Assessment, By Type, 2022 & 2032F |
9.2 Indonesia Pulleys Market Opportunity Assessment, By Applications, 2022 & 2032F |
10 Indonesia Pulleys Market - Competitive Landscape |
10.1 Indonesia Pulleys Market Revenue Share, By Companies, 2025 |
10.2 Indonesia Pulleys Market Competitive Benchmarking, By Operating and Technical Parameters |
11 Company Profiles |
12 Recommendations |
13 Disclaimer |
Global Go To Market Strategy - 2030
Export potential enables firms to identify high-growth global markets with greater confidence by combining advanced trade intelligence with a structured quantitative methodology. The framework analyzes emerging demand trends and country-level import patterns while integrating macroeconomic and trade datasets such as GDP and population forecasts, bilateral import–export flows, tariff structures, elasticity differentials between developed and developing economies, geographic distance, and import demand projections. Using weighted trade values from 2020–2024 as the base period to project country-to-country export potential for 2030, these inputs are operationalized through calculated drivers such as gravity model parameters, tariff impact factors, and projected GDP per-capita growth. Through an analysis of hidden potentials, demand hotspots, and market conditions that are most favorable to success, this method enables firms to focus on target countries, maximize returns, and global expansion with data, backed by accuracy.
By factoring in the projected importer demand gap that is currently unmet and could be potential opportunity, it identifies the potential for the Exporter (Country) among 190 countries, against the general trade analysis, which identifies the biggest importer or exporter.
To discover high-growth global markets and optimize your business strategy:
Click Here
Pricing
- Single User License$ 1,995
- Department License$ 2,400
- Site License$ 3,120
- Global License$ 3,795

Leadership Perspectives from Industry Events
Search
Thought Leadership and Analyst Meet


Our Clients
6WResearch In News
- India Air Conditioner Market Set for Strong Rebound in 2026 After Weather-Led Correction and GST-Driven Recovery: 6Wresearch
- ADAS in India: How Automatic Emergency Braking, Blind Spot Detection & Driver Monitoring are Transforming Road Safety
- Doha a strategic location for EV manufacturing hub: IPA Qatar
- Demand for luxury TVs surging in the GCC, says Samsung
- Empowering Growth: The Thriving Journey of Bangladesh’s Cable Industry
- Demand for luxury TVs surging in the GCC, says Samsung
Latest Reports
- Nicaragua RPG Gaming Market (2026-2032)
- New Zealand RPG Gaming Market (2026-2032)
- Netherlands RPG Gaming Market (2026-2032)
- Nauru RPG Gaming Market (2026-2032)
- Namibia RPG Gaming Market (2026-2032)
- Mozambique RPG Gaming Market (2026-2032)
- Montenegro RPG Gaming Market (2026-2032)
- Mongolia RPG Gaming Market (2026-2032)
- Monaco RPG Gaming Market (2026-2032)
- Micronesia RPG Gaming Market (2026-2032)
Industry Events and Analyst Meet

HIMTEX 2026

India Refining Summit 2026

India EV Show 2026

EV tech India Expo 2026

Auto Tech Asia 2026
Whitepaper
- Middle East & Africa Commercial Security Market Click here to view more.
- Middle East & Africa Fire Safety Systems & Equipment Market Click here to view more.
- GCC Drone Market Click here to view more.
- Middle East Lighting Fixture Market Click here to view more.
- GCC Physical & Perimeter Security Market Click here to view more.