Indonesia Rare Earth & Products Market (2026-2032) | Companies, Value, Share, Forecast, Revenue, Trends, Outlook, Analysis, Industry, Size & Growth
Market Forecast By Product Types (Cerium, Dysprosium, Erbium, Europium, Gadolinium, Holmium, Lanthanum, Others), By Applications (Magnets, Catalysts, Metallurgy, Polishing, Glass, Phosphors, Ceramics, Others) And Competitive Landscape
| Product Code: ETC008748 | Publication Date: Jul 2023 | Updated Date: Jun 2026 | Product Type: Report | |
| Publisher: 6Wresearch | Author: Ravi Bhandari | No. of Pages: 70 | No. of Figures: 35 | No. of Tables: 5 |
Indonesia Rare Earth & Products Market Summary
The indonesia rare earth & products market was estimated at USD 440 Million in 2025 and is projected to reach USD 578 Million by 2032, growing at a CAGR of 5.2% from 2026 to 2032.
Indonesia Rare Earth & Products Market Year-wise Growth Rate and Key Drivers
This graph highlights how the Indonesia Rare Earth & Products Market has steadily grown over the years, supported by major growth factors.
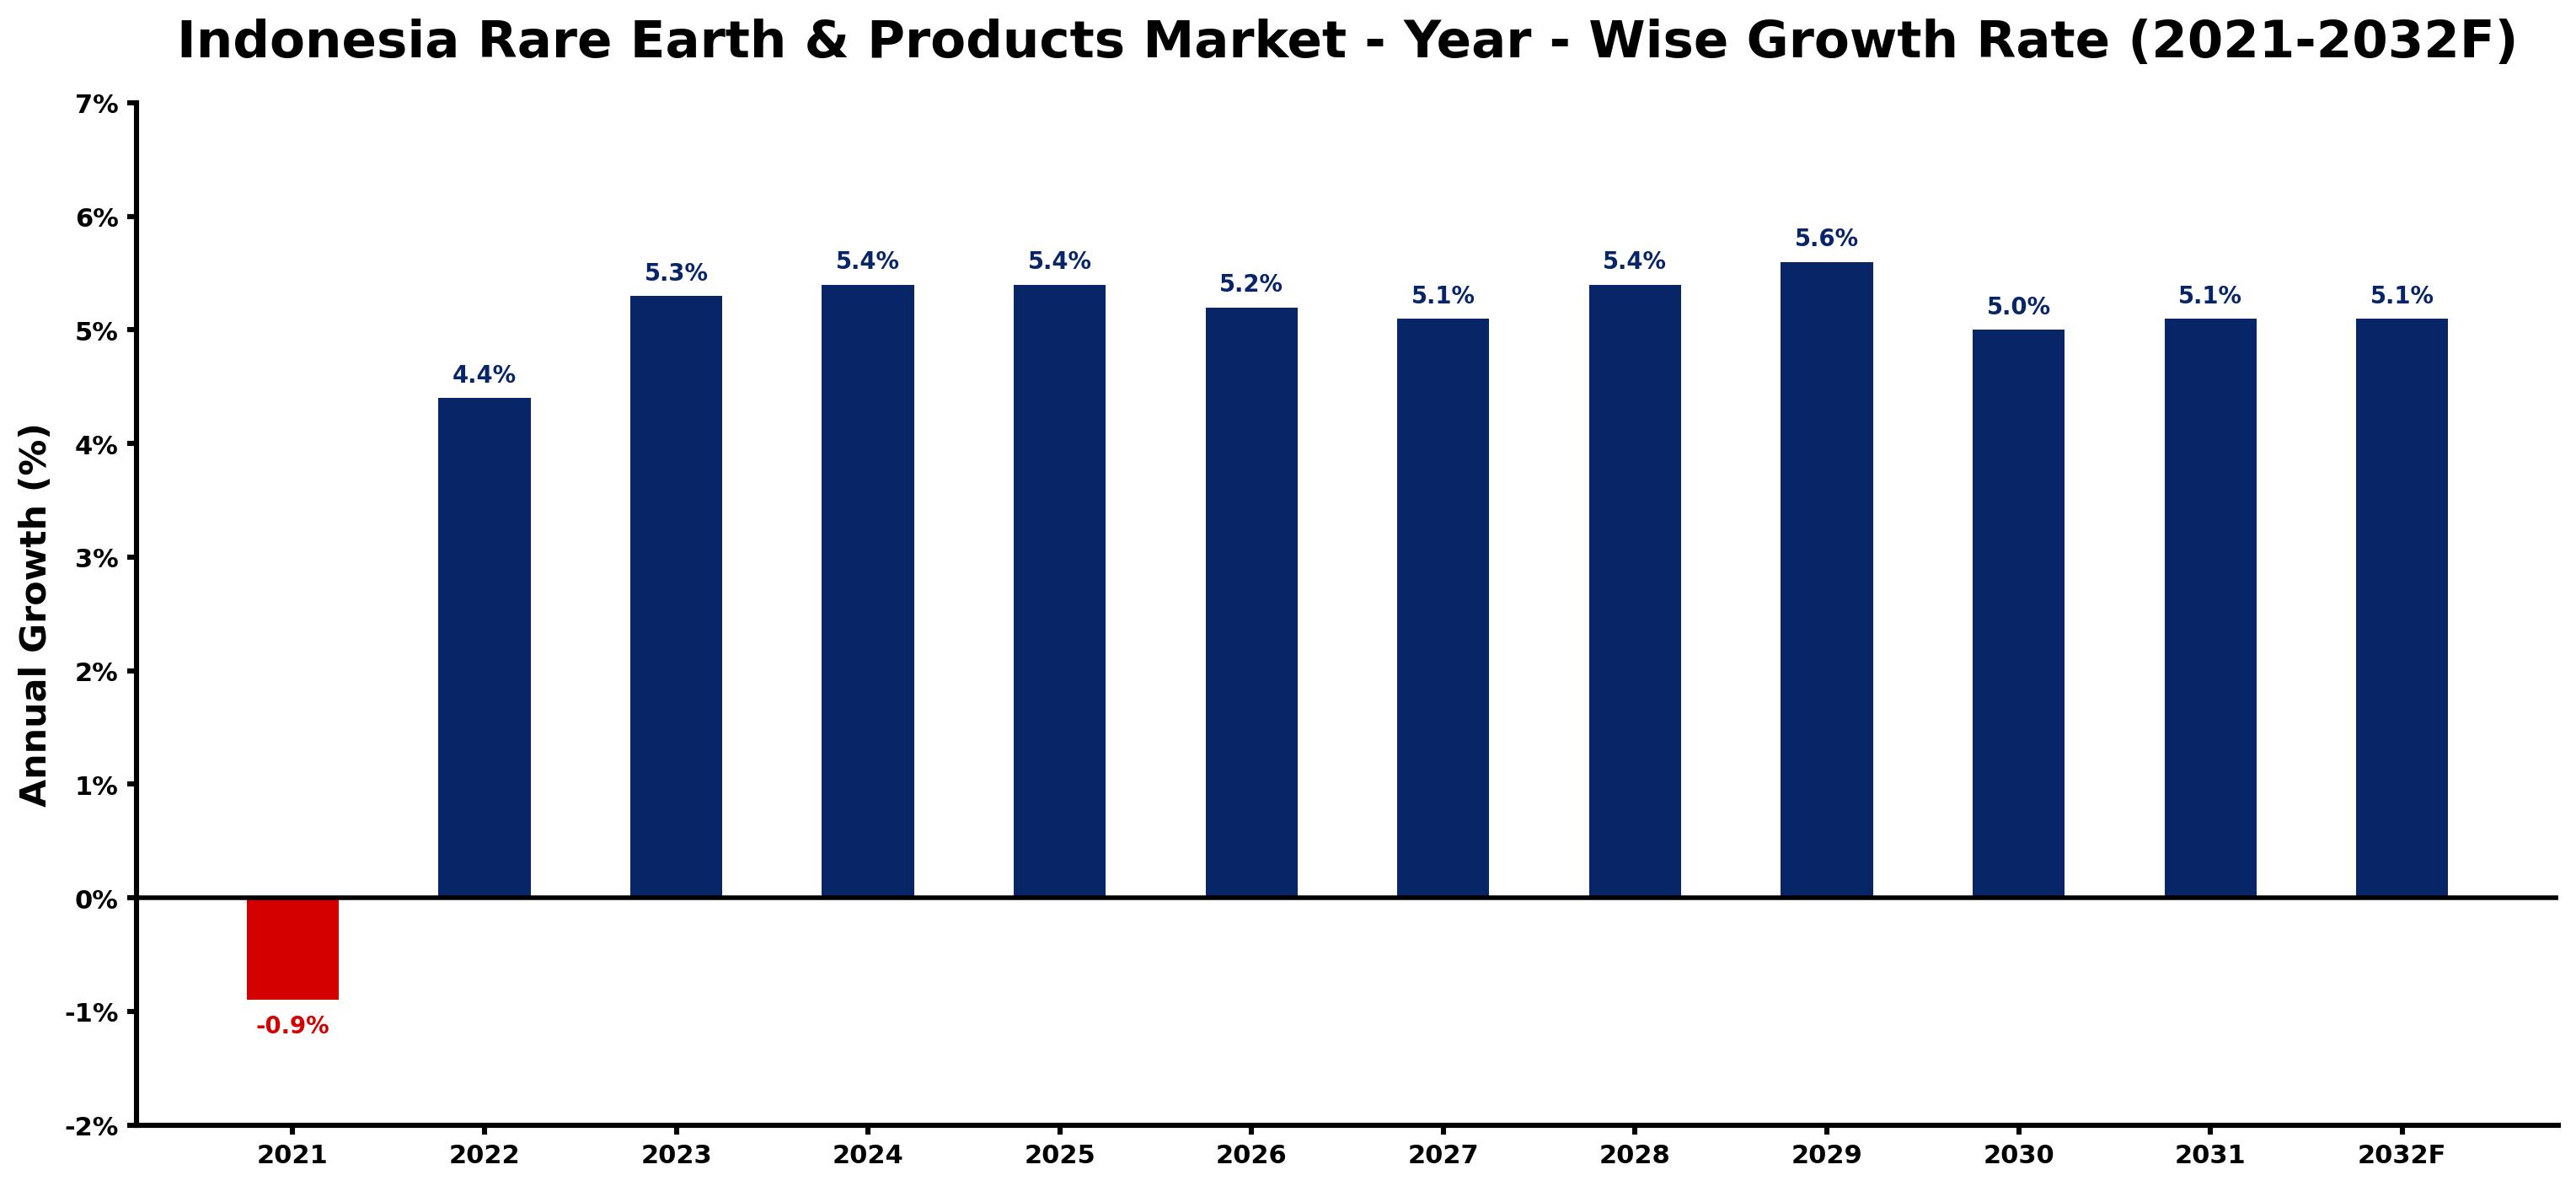
The table below presents the year wise growth rates along with the key drivers influencing the market
| Year | Growth Rate | Major Drivers |
| 2021 | -0.9% | Geopolitical tensions impacted trade relations, leading to supply chain disruptions in rare earth product availability. |
| 2022 | 4.4% | Increased foreign investment focuses on Indonesia's rich mineral resources and expertise. |
| 2023 | 5.3% | Growing industrial applications for rare earths enhance local processing capabilities significantly. |
| 2024 | 5.4% | International collaborations foster knowledge transfer in rare earth extraction technologies. |
| 2025 | 5.4% | Environmental sustainability initiatives push for cleaner extraction methods in the region. |
| 2026 | 5.2% | Technological innovations streamline processing efficiency, boosting output and reducing waste. |
| 2027 | 5.1% | Corporate social responsibility practices become essential for reputation and market access. |
| 2028 | 5.4% | Local demand for electric vehicles expands, increasing rare earth material requirements. |
| 2029 | 5.6% | Emerging tech startups drive innovative applications for rare earth elements in electronics. |
| 2030 | 5.0% | Supply chain resilience becomes a priority, leading to diversified sourcing strategies. |
| 2031 | 5.1% | Global market trends influence Indonesia's positioning as a key player in rare earths. |
| 2032 | 5.1% | Achieving sustainable production methods enhances Indonesia's competitive advantage internationally. |
Note - Market size estimations and growth projections presented in this report are based on 6Wresearch's advanced forecasting approach, validated with industry datasets as of June 2026.
Indonesia Rare Earth & Products Market Synopsis
The Indonesia Rare Earth Products Market is projected to reach 5.2% and witness significant growth during the forecast period (2026-2032). As one of the world's largest markets for rare earth products, Indonesia has established itself as a key supplier in the global supply chain, exporting substantial quantities of these materials to major economies, including China, Japan, India, South Korea, and Taiwan. In 2019, Indonesia's exports accounted for about 18% of total global rare earth exports, underscoring its pivotal role in the international market.
Indonesia Rare Earth & Products Market Growth Drivers
The growth trajectory of the Indonesia Rare Earth & Products Market can be attributed to several compelling drivers. Firstly, the escalating demand for rare earth elements from diverse industries, particularly in the renewable energy sector and automotive production (electric vehicles), has significantly influenced market dynamics. As countries pivot towards sustainable energy solutions, the need for these critical materials is expected to rise.
Furthermore, Indonesia's competitive pricing structure, fueled by relatively low labor costs, enhances its desirability as a sourcing destination for foreign investors. This price advantage positions Indonesia favorably in comparison to other producing nations, attracting foreign investments that bolster production capabilities. Additionally, recent government initiatives, including tax incentives and funding for infrastructure improvements, have catalyzed increased investments in the rare earth sector, further facilitating market growth.
Indonesia Rare Earth & Products Market Challenges and Restraints
Despite its leading position in production and export volumes, the Indonesia Rare Earth & Products Market faces several challenges that could impede further growth. One of the primary issues is inadequate infrastructure and transportation networks, which hinder effective product distribution and supply chain efficiency. This limitation can potentially lead to delays in meeting international demand.
Additionally, limited access to capital and advanced technology poses a significant challenge for businesses engaged in research and development activities, affecting innovation and competitiveness within the sector. Environmental regulations imposed by the Indonesian government also contribute to the complexities faced by market participants, as compliance can require substantial investment and operational adjustments.
Indonesia Rare Earth & Products Market Investment Opportunities
Investors observing the Indonesia Rare Earth & Products Market will find various opportunities stemming from its growth potential. A significant factor is the increasing global focus on renewable energy and electric vehicles, which raises demand for rare earth minerals. Companies involved in the extraction and processing of these materials are likely to benefit from this trend.
Moreover, the Indonesian government's favorable investment climate, reinforced by tax incentives and strategic development plans, positions the country as an attractive destination for foreign direct investment. The potential for partnerships in research and development initiatives also presents lucrative opportunities, particularly in enhancing production techniques and minimizing environmental impact.
Indonesia Rare Earth & Products Market Government Investment and Initiatives
The Indonesian government has undertaken various initiatives aimed at bolstering the rare earth sector, reflecting its commitment to sustaining growth and attracting foreign investment. Strategic development plans focused on infrastructure improvements are being prioritized, enhancing the operational capabilities of companies in this space. These developments include investments in transportation networks and logistics, which are crucial for efficient product distribution.
Additionally, the government has implemented policies that provide tax incentives for businesses operating within the rare earth sector, encouraging both local and foreign investments. These incentives are designed to stimulate growth in production capacity and promote technological advancements. Furthermore, initiatives aimed at enhancing environmental compliance and sustainability practices reflect the government's dual focus on economic growth and environmental stewardship.
Indonesia Rare Earth & Products Market Latest Developments (May 2025 - June 2026)
In the period from May 2025 to June 2026, the Indonesia Rare Earth & Products Market has seen several notable developments that signify its evolving landscape. Companies have increasingly focused on enhancing their production techniques to comply with stringent environmental regulations while remaining competitive in global markets. Additionally, partnerships between local firms and international entities have become more prevalent, emphasizing collaboration in research and technology sharing.
Moreover, the Indonesian government has announced plans for further investments in infrastructure projects that support the rare earth industry, aimed at improving supply chain efficiency and product accessibility. These developments signal a growing recognition of the rare earth sector's critical role in the country's economic framework and the global market.
Indonesia Rare Earth & Products Market - Key Attractiveness of the Report
- 10 Years of Market Numbers
- Historical Data Starting from 2022 to 2025
- Base Year: 2025
- Forecast Data until 2032
- Key Performance Indicators Impacting the Market
- Major Upcoming Developments and Projects
Key Highlights of the Report:
- Indonesia Rare Earth & Products Market Outlook
- Market Size of Indonesia Rare Earth & Products Market, 2025
- Forecast of Indonesia Rare Earth & Products Market, 2032F
- Historical Data and Forecast of Indonesia Rare Earth & Products Revenues & Volume for the Period 2022-2032F
- Indonesia Rare Earth & Products Market Trend Evolution
- Indonesia Rare Earth & Products Market Drivers and Challenges
- Indonesia Rare Earth & Products Price Trends
- Indonesia Rare Earth & Products Porter's Five Forces
- Indonesia Rare Earth & Products Industry Life Cycle
- Historical Data and Forecast of Indonesia Rare Earth & Products Market Revenues & Volume By Product Types for the Period 2022-2032F
- Historical Data and Forecast of Indonesia Rare Earth & Products Market Revenues & Volume By Cerium for the Period 2022-2032F
- Historical Data and Forecast of Indonesia Rare Earth & Products Market Revenues & Volume By Dysprosium for the Period 2022-2032F
- Historical Data and Forecast of Indonesia Rare Earth & Products Market Revenues & Volume By Erbium for the Period 2022-2032F
- Historical Data and Forecast of Indonesia Rare Earth & Products Market Revenues & Volume By Europium for the Period 2022-2032F
- Historical Data and Forecast of Indonesia Rare Earth & Products Market Revenues & Volume By Gadolinium for the Period 2022-2032F
- Historical Data and Forecast of Indonesia Rare Earth & Products Market Revenues & Volume By Holmium for the Period 2022-2032F
- Historical Data and Forecast of Indonesia Rare Earth & Products Market Revenues & Volume By Lanthanum for the Period 2022-2032F
- Historical Data and Forecast of Indonesia Cerium Rare Earth & Products Market Revenues & Volume By Others for the Period 2022-2032F
- Historical Data and Forecast of Indonesia Rare Earth & Products Market Revenues & Volume By Applications for the Period 2022-2032F
- Historical Data and Forecast of Indonesia Rare Earth & Products Market Revenues & Volume By Magnets for the Period 2022-2032F
- Historical Data and Forecast of Indonesia Rare Earth & Products Market Revenues & Volume By Catalysts for the Period 2022-2032F
- Historical Data and Forecast of Indonesia Rare Earth & Products Market Revenues & Volume By Metallurgy for the Period 2022-2032F
- Historical Data and Forecast of Indonesia Rare Earth & Products Market Revenues & Volume By Polishing for the Period 2022-2032F
- Historical Data and Forecast of Indonesia Rare Earth & Products Market Revenues & Volume By Glass for the Period 2022-2032F
- Historical Data and Forecast of Indonesia Rare Earth & Products Market Revenues & Volume By Phosphors for the Period 2022-2032F
- Historical Data and Forecast of Indonesia Rare Earth & Products Market Revenues & Volume By Ceramics for the Period 2022-2032F
- Historical Data and Forecast of Indonesia Rare Earth & Products Market Revenues & Volume By Others for the Period 2022-2032F
- Indonesia Rare Earth & Products Import Export Trade Statistics
- Market Opportunity Assessment By Product Types
- Market Opportunity Assessment By Applications
- Indonesia Rare Earth & Products Top Companies Market Share
- Indonesia Rare Earth & Products Competitive Benchmarking By Technical and Operational Parameters
- Indonesia Rare Earth & Products Company Profiles
- Indonesia Rare Earth & Products Key Strategic Recommendations
Frequently Asked Questions About the Market Study (FAQs):
The growth is primarily driven by increasing demand from the renewable energy and automotive sectors, along with favorable government policies and competitive pricing.
The government provides tax incentives, invests in infrastructure, and promotes collaborations to enhance production capabilities and compliance with environmental standards.
Key challenges include inadequate infrastructure, limited access to capital and technology, and strict environmental regulations that may impact operational efficiency.
The market is expected to experience steady growth driven by increasing demand for rare earth products and supportive government initiatives, with a projected value of 5.1%.
6Wresearch actively monitors the Indonesia Rare Earth & Products Market and publishes its comprehensive annual report, highlighting emerging trends, growth drivers, revenue analysis, and forecast outlook. Our insights help businesses to make data-backed strategic decisions with ongoing market dynamics. Our analysts track relevent industries related to the Indonesia Rare Earth & Products Market, allowing our clients with actionable intelligence and reliable forecasts tailored to emerging regional needs.
Yes, we provide customisation as per your requirements. To learn more, feel free to contact us on sales@6wresearch.com
1 Executive Summary |
2 Introduction |
2.1 Key Highlights of the Report |
2.2 Report Description |
2.3 Market Scope & Segmentation |
2.4 Research Methodology |
2.5 Assumptions |
3 Indonesia Rare Earth & Products Market Overview |
3.1 Indonesia Country Macro Economic Indicators |
3.2 Indonesia Rare Earth & Products Market Revenues & Volume, 2022 & 2032F |
3.3 Indonesia Rare Earth & Products Market - Industry Life Cycle |
3.4 Indonesia Rare Earth & Products Market - Porter's Five Forces |
3.5 Indonesia Rare Earth & Products Market Revenues & Volume Share, By Product Types, 2022 & 2032F |
3.6 Indonesia Rare Earth & Products Market Revenues & Volume Share, By Applications, 2022 & 2032F |
4 Indonesia Rare Earth & Products Market Dynamics |
4.1 Impact Analysis |
4.2 Market Drivers |
4.3 Market Restraints |
5 Indonesia Rare Earth & Products Market Trends |
6 Indonesia Rare Earth & Products Market, By Types |
6.1 Indonesia Rare Earth & Products Market, By Product Types |
6.1.1 Overview and Analysis |
6.1.2 Indonesia Rare Earth & Products Market Revenues & Volume, By Product Types, 2022-2032F |
6.1.3 Indonesia Rare Earth & Products Market Revenues & Volume, By Cerium, 2022-2032F |
6.1.4 Indonesia Rare Earth & Products Market Revenues & Volume, By Dysprosium, 2022-2032F |
6.1.5 Indonesia Rare Earth & Products Market Revenues & Volume, By Erbium, 2022-2032F |
6.1.6 Indonesia Rare Earth & Products Market Revenues & Volume, By Europium, 2022-2032F |
6.1.7 Indonesia Rare Earth & Products Market Revenues & Volume, By Gadolinium, 2022-2032F |
6.1.8 Indonesia Rare Earth & Products Market Revenues & Volume, By Holmium, 2022-2032F |
6.1.9 Indonesia Rare Earth & Products Market Revenues & Volume, By Others, 2022-2032F |
6.1.10 Indonesia Rare Earth & Products Market Revenues & Volume, By Others, 2022-2032F |
6.2 Indonesia Rare Earth & Products Market, By Applications |
6.2.1 Overview and Analysis |
6.2.2 Indonesia Rare Earth & Products Market Revenues & Volume, By Magnets, 2022-2032F |
6.2.3 Indonesia Rare Earth & Products Market Revenues & Volume, By Catalysts, 2022-2032F |
6.2.4 Indonesia Rare Earth & Products Market Revenues & Volume, By Metallurgy, 2022-2032F |
6.2.5 Indonesia Rare Earth & Products Market Revenues & Volume, By Polishing, 2022-2032F |
6.2.6 Indonesia Rare Earth & Products Market Revenues & Volume, By Glass, 2022-2032F |
6.2.7 Indonesia Rare Earth & Products Market Revenues & Volume, By Phosphors, 2022-2032F |
6.2.8 Indonesia Rare Earth & Products Market Revenues & Volume, By Others, 2022-2032F |
6.2.9 Indonesia Rare Earth & Products Market Revenues & Volume, By Others, 2022-2032F |
7 Indonesia Rare Earth & Products Market Import-Export Trade Statistics |
7.1 Indonesia Rare Earth & Products Market Export to Major Countries |
7.2 Indonesia Rare Earth & Products Market Imports from Major Countries |
8 Indonesia Rare Earth & Products Market Key Performance Indicators |
9 Indonesia Rare Earth & Products Market - Opportunity Assessment |
9.1 Indonesia Rare Earth & Products Market Opportunity Assessment, By Product Types, 2022 & 2032F |
9.2 Indonesia Rare Earth & Products Market Opportunity Assessment, By Applications, 2022 & 2032F |
10 Indonesia Rare Earth & Products Market - Competitive Landscape |
10.1 Indonesia Rare Earth & Products Market Revenue Share, By Companies, 2025 |
10.2 Indonesia Rare Earth & Products Market Competitive Benchmarking, By Operating and Technical Parameters |
11 Company Profiles |
12 Recommendations |
13 Disclaimer |
Global Go To Market Strategy - 2030
Export potential enables firms to identify high-growth global markets with greater confidence by combining advanced trade intelligence with a structured quantitative methodology. The framework analyzes emerging demand trends and country-level import patterns while integrating macroeconomic and trade datasets such as GDP and population forecasts, bilateral import–export flows, tariff structures, elasticity differentials between developed and developing economies, geographic distance, and import demand projections. Using weighted trade values from 2020–2024 as the base period to project country-to-country export potential for 2030, these inputs are operationalized through calculated drivers such as gravity model parameters, tariff impact factors, and projected GDP per-capita growth. Through an analysis of hidden potentials, demand hotspots, and market conditions that are most favorable to success, this method enables firms to focus on target countries, maximize returns, and global expansion with data, backed by accuracy.
By factoring in the projected importer demand gap that is currently unmet and could be potential opportunity, it identifies the potential for the Exporter (Country) among 190 countries, against the general trade analysis, which identifies the biggest importer or exporter.
To discover high-growth global markets and optimize your business strategy:
Click Here
Pricing
- Single User License$ 1,995
- Department License$ 2,400
- Site License$ 3,120
- Global License$ 3,795

Leadership Perspectives from Industry Events
Search
Thought Leadership and Analyst Meet


Our Clients
6WResearch In News
- India Air Conditioner Market Set for Strong Rebound in 2026 After Weather-Led Correction and GST-Driven Recovery: 6Wresearch
- ADAS in India: How Automatic Emergency Braking, Blind Spot Detection & Driver Monitoring are Transforming Road Safety
- Doha a strategic location for EV manufacturing hub: IPA Qatar
- Demand for luxury TVs surging in the GCC, says Samsung
- Empowering Growth: The Thriving Journey of Bangladesh’s Cable Industry
- Demand for luxury TVs surging in the GCC, says Samsung
Latest Reports
- Nicaragua RPG Gaming Market (2026-2032)
- New Zealand RPG Gaming Market (2026-2032)
- Netherlands RPG Gaming Market (2026-2032)
- Nauru RPG Gaming Market (2026-2032)
- Namibia RPG Gaming Market (2026-2032)
- Mozambique RPG Gaming Market (2026-2032)
- Montenegro RPG Gaming Market (2026-2032)
- Mongolia RPG Gaming Market (2026-2032)
- Monaco RPG Gaming Market (2026-2032)
- Micronesia RPG Gaming Market (2026-2032)
Industry Events and Analyst Meet

EV India Expo 2026

HIMTEX 2026

India Refining Summit 2026

India EV Show 2026

EV tech India Expo 2026
Whitepaper
- Middle East & Africa Commercial Security Market Click here to view more.
- Middle East & Africa Fire Safety Systems & Equipment Market Click here to view more.
- GCC Drone Market Click here to view more.
- Middle East Lighting Fixture Market Click here to view more.
- GCC Physical & Perimeter Security Market Click here to view more.