Indonesia Renewable Chemicals Market (2026-2032) Outlook | Revenue, Share, Size, Trends, Analysis, Growth, Forecast, Value, Companies & Industry
Market Forecast By Product Type (Alcohols, Organic Acids, Ketones, Platform Chemicals, Biopolymers, Others), By Applications (Transportation, Textiles, Food safety, Environment, Communication, Housing, Recreation, Other Applications) And Competitive Landscape
| Product Code: ETC344128 | Publication Date: Aug 2022 | Updated Date: Jul 2026 | Product Type: Market Research Report | |
| Publisher: 6Wresearch | Author: Ravi Bhandari | No. of Pages: 75 | No. of Figures: 35 | No. of Tables: 20 |
Indonesia Renewable Chemicals Market Size, Share & Growth Rate
The Indonesia Renewable Chemicals Market was estimated at USD 289 Million in 2025 and is projected to reach USD 380 Million by 2032, growing at a CAGR of 4.0% from 2026 to 2032. This growth trajectory reflects a notable shift towards sustainable chemical alternatives driven by Indonesia's rich agricultural resources, which offer abundant feedstocks for renewable chemical production. Additionally, the rising consumer demand for eco-friendly products and stringent government regulations supporting sustainability initiatives are further propelling market expansion.
Indonesia Renewable Chemicals Market Year-wise Growth Rate and Key Drivers
This graph highlights how the Indonesia Renewable Chemicals Market has steadily grown over the years, supported by major growth factors.
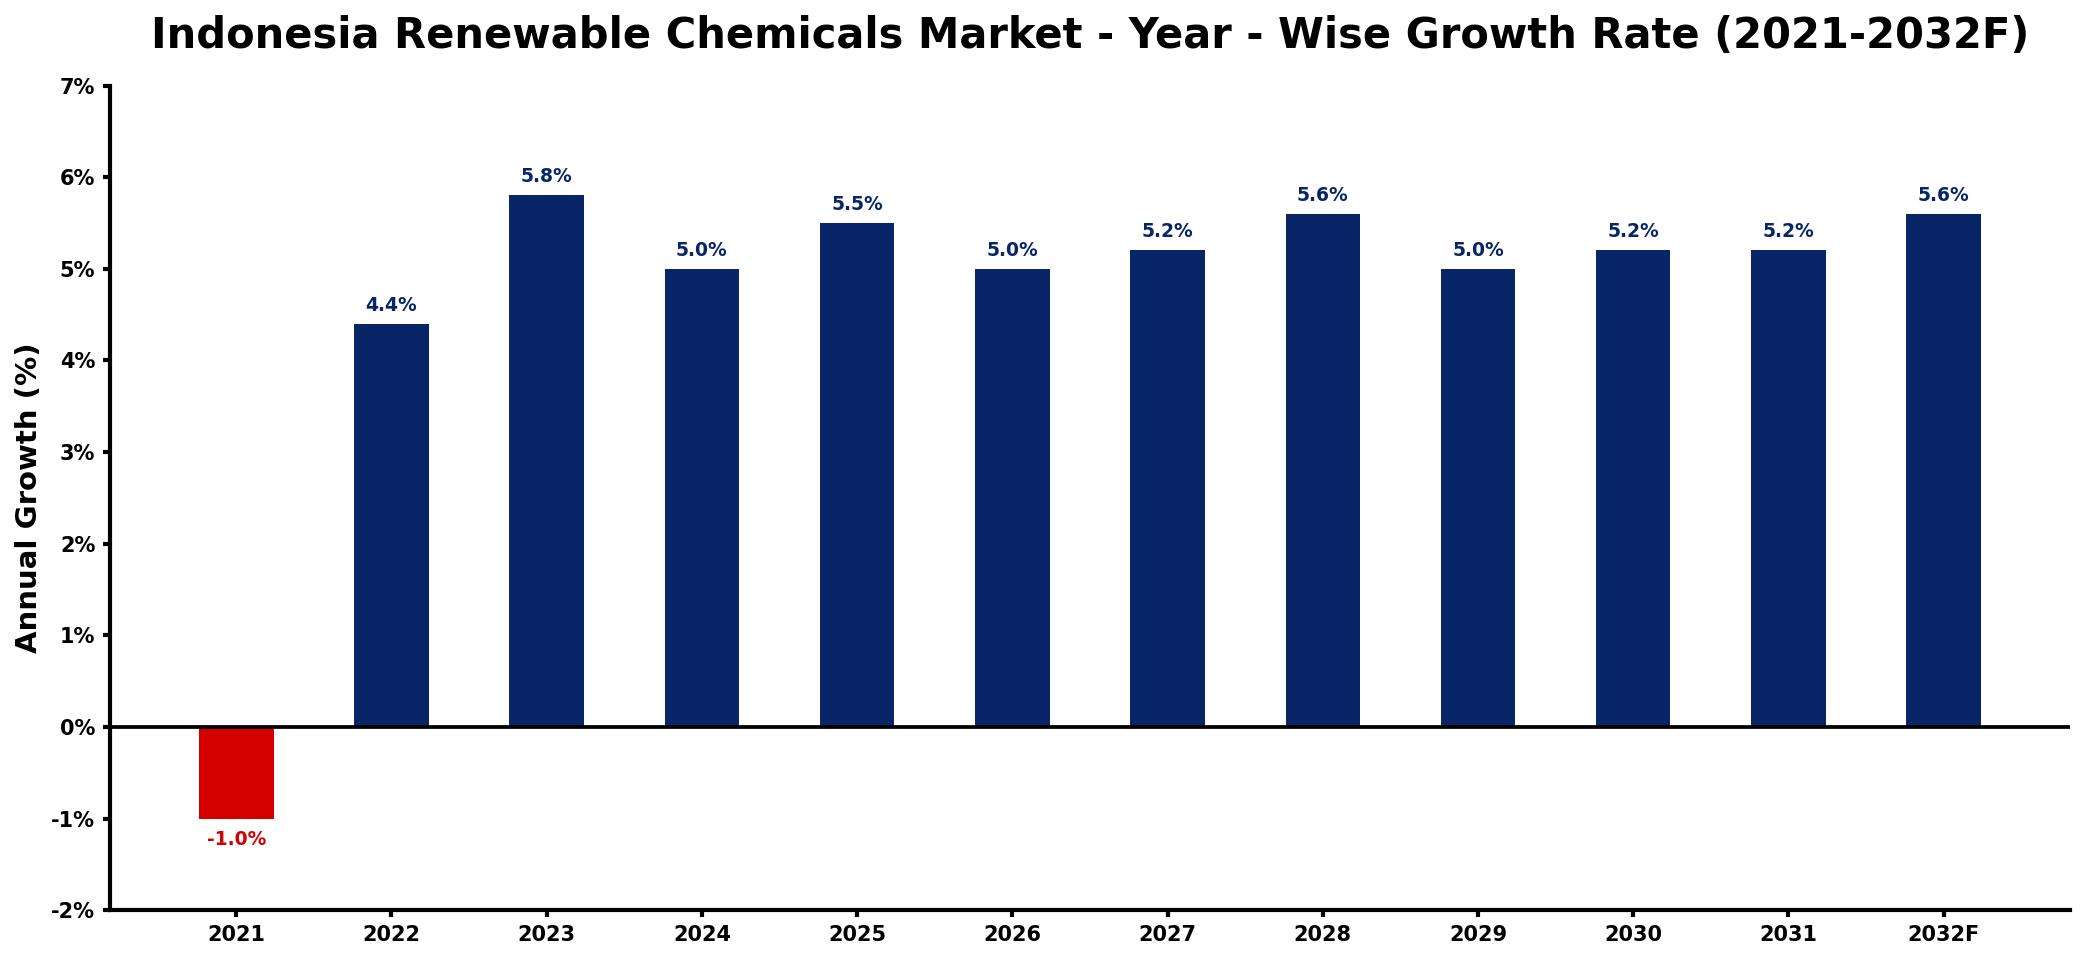
The table below presents the year‑wise growth rates along with the key drivers influencing the market
| Year | Growth Rate | Major Drivers |
| 2021 | -1.0% | weak end-use demand conditions |
| 2022 | 4.4% | increased investment in sustainable technologies |
| 2023 | 5.8% | growing demand for eco-friendly solutions |
| 2024 | 5.0% | expansion of green manufacturing facilities |
| 2025 | 5.5% | rising interest in circular economy |
| 2026 | 5.0% | enhanced regulatory support for sustainability |
| 2027 | 5.2% | increased collaborations among industries |
| 2028 | 5.6% | growing awareness of environmental impact |
| 2029 | 5.0% | advancements in sustainable production methods |
| 2030 | 5.2% | wider acceptance of green innovations |
| 2031 | 5.2% | strengthened supply chain sustainability efforts |
| 2032 | 5.6% | expanding healthcare application demand |
Note: Market size estimations and growth projections presented in this report are based on 6Wresearch's proprietary forecasting methodology, utilizing the latest available industry data, government publications, and primary research inputs.
Indonesia Renewable Chemicals Market Synopsis
As a leading producer of palm oil and other agricultural commodities, Indonesia has the potential to become a significant player in the renewable chemicals market. The availability of bio-based feedstocks, such as palm oil and other biomass, is driving innovations in biofuels, bioplastics, and green solvents tailored for local and global markets.
Moreover, the increasing awareness of environmental issues and the impact of traditional chemicals have sparked a shift in industry preferences. This has led to heightened investment in research and development of renewable alternatives that not only reduce carbon footprints but also meet the demands of environmentally conscious consumers.
Indonesia Renewable Chemicals Market Key Takeaways
- The market is projected to grow significantly, reflecting strong local demand for sustainable chemical solutions.
- Indonesia's agricultural sector provides a solid foundation for renewable feedstock production.
- Government incentives and environmental regulations are key drivers supporting market growth.
- Consumer preferences are increasingly leaning towards eco-friendly and sustainable products.
- Innovations in production technologies are essential for overcoming cost and quality challenges.
Evaluation of Restraints in Indonesia Renewable Chemicals Market
Despite the promising outlook, the Indonesia Renewable Chemicals Market faces several restraints. One major challenge is the need for cost-competitive production methods, as renewable chemicals often require higher initial investments compared to conventional counterparts. Additionally, ensuring consistent quality of renewable products poses a hurdle for market players. Companies must also navigate complex regulatory frameworks while balancing sustainability expectations with the economic viability of their offerings.
Indonesia Renewable Chemicals Market Trends
Current trends indicate a marked rise in collaborations between public and private sectors aimed at developing innovative renewable chemical technologies. Furthermore, the integration of advanced analytics and biotechnology is transforming traditional production methods, enhancing efficiency and sustainability. There is also an increasing focus on circular economy principles, encouraging the recycling and reusing of materials within the renewable chemicals sector.
Indonesia Renewable Chemicals Market Opportunities
Opportunities for growth in the Indonesia Renewable Chemicals Market are abundant. The push for bio-based alternatives to petrochemicals is gaining traction, opening avenues for investments in bioplastics and biofuels. Additionally, the development of green solvents for various industrial applications presents a lucrative opportunity for players willing to innovate. The expansion of global markets for renewable chemicals can also provide Indonesian manufacturers with access to new revenue streams.
Government Initiatives in the Indonesia Renewable Chemicals Market
The Indonesian government is actively supporting the renewable chemicals sector through various initiatives aimed at promoting sustainability. Incentives such as tax breaks, subsidies for green technology, and investment in research and development are designed to encourage local production of renewable chemicals. Furthermore, public spending on environmental programs and compliance with international sustainability standards are pivotal in shaping the future of this market.
Future Insights of the Indonesia Renewable Chemicals Market
Looking ahead to the period between 2026 and 2032, the Indonesia Renewable Chemicals Market is expected to gain significant momentum, driven by both domestic and international demand for sustainable products. The emphasis on reducing greenhouse gas emissions will likely bolster investments in renewable chemical technologies. With a growing consumer base prioritizing sustainability, market players who embrace innovation and adapt to evolving market dynamics will likely thrive in this burgeoning sector.
Indonesia Renewable Chemicals Market Latest Developments (2025 - 2026)
In the latest developments within the Indonesia Renewable Chemicals Market, industry stakeholders are increasingly focusing on partnerships aimed at technological advancements. Collaborative efforts between academia and the private sector are fostering innovation in bio-based chemical production. Additionally, there have been announcements regarding new projects aimed at enhancing production capacities for bioplastics and biofuels, reflecting an optimistic outlook for sustainable chemical solutions.
Indonesia Renewable Chemicals Market - Key Attractiveness of the Report
- 10 Years of Market Numbers
- Historical Data Starting from 2022 to 2025
- Base Year: 2025
- Forecast Data until 2032
- Key Performance Indicators Impacting the Market
- Major Upcoming Developments and Projects
Key Highlights of the Report:
- Indonesia Renewable Chemicals Market Outlook
- Market Size of Indonesia Renewable Chemicals Market, 2025
- Forecast of Indonesia Renewable Chemicals Market, 2032
- Historical Data and Forecast of Indonesia Renewable Chemicals Revenues & Volume for the Period 2022-2032F
- Indonesia Renewable Chemicals Market Trend Evolution
- Indonesia Renewable Chemicals Market Drivers and Challenges
- Indonesia Renewable Chemicals Price Trends
- Indonesia Renewable Chemicals Porter's Five Forces
- Indonesia Renewable Chemicals Industry Life Cycle
- Historical Data and Forecast of Indonesia Renewable Chemicals Market Revenues & Volume By Product Type for the Period 2022-2032F
- Historical Data and Forecast of Indonesia Renewable Chemicals Market Revenues & Volume By Alcohols for the Period 2022-2032F
- Historical Data and Forecast of Indonesia Renewable Chemicals Market Revenues & Volume By Organic Acids for the Period 2022-2032F
- Historical Data and Forecast of Indonesia Renewable Chemicals Market Revenues & Volume By Ketones for the Period 2022-2032F
- Historical Data and Forecast of Indonesia Renewable Chemicals Market Revenues & Volume By Platform Chemicals for the Period 2022-2032F
- Historical Data and Forecast of Indonesia Renewable Chemicals Market Revenues & Volume By Biopolymers for the Period 2022-2032F
- Historical Data and Forecast of Indonesia Renewable Chemicals Market Revenues & Volume By Others for the Period 2022-2032F
- Historical Data and Forecast of Indonesia Renewable Chemicals Market Revenues & Volume By Applications for the Period 2022-2032F
- Historical Data and Forecast of Indonesia Renewable Chemicals Market Revenues & Volume By Transportation for the Period 2022-2032F
- Historical Data and Forecast of Indonesia Renewable Chemicals Market Revenues & Volume By Textiles for the Period 2022-2032F
- Historical Data and Forecast of Indonesia Renewable Chemicals Market Revenues & Volume By Food safety for the Period 2022-2032F
- Historical Data and Forecast of Indonesia Renewable Chemicals Market Revenues & Volume By Environment for the Period 2022-2032F
- Historical Data and Forecast of Indonesia Renewable Chemicals Market Revenues & Volume By Communication for the Period 2022-2032F
- Historical Data and Forecast of Indonesia Renewable Chemicals Market Revenues & Volume By Housing for the Period 2022-2032F
- Historical Data and Forecast of Indonesia Renewable Chemicals Market Revenues & Volume By Recreation for the Period 2022-2032F
- Historical Data and Forecast of Indonesia Renewable Chemicals Market Revenues & Volume By Other Applications for the Period 2022-2032F
- Indonesia Renewable Chemicals Import Export Trade Statistics
- Market Opportunity Assessment By Product Type
- Market Opportunity Assessment By Applications
- Indonesia Renewable Chemicals Top Companies Market Share
- Indonesia Renewable Chemicals Competitive Benchmarking By Technical and Operational Parameters
- Indonesia Renewable Chemicals Company Profiles
- Indonesia Renewable Chemicals Key Strategic Recommendations
Frequently Asked Questions About the Market Study (FAQs):
The Indonesia Renewable Chemicals Market is estimated at USD 289 Million in 2025, with projections to reach USD 380 Million by 2032, reflecting a CAGR of 4.0% from 2026 to 2032.
Indonesia's extensive agricultural sector provides abundant feedstock for the production of renewable chemicals, making it a pivotal player in sourcing raw materials for biofuels, bioplastics, and green solvents.
Government policies, including incentives for sustainable practices and investments in green technology, significantly influence the growth of the renewable chemicals market in Indonesia, encouraging local production and innovation.
Innovations such as biotechnological advancements and advanced analytics are reshaping production methods, improving efficiency and sustainability in the renewable chemicals sector.
Bio-based plastics, biofuels, and green solvents are increasingly gaining popularity in Indonesia, driven by rising consumer awareness and demand for sustainable alternatives.
The pandemic has heightened consumer awareness regarding sustainability, leading to increased demand for renewable chemicals, which has created new opportunities for market growth and innovation.
6Wresearch actively monitors the Indonesia Renewable Chemicals Market and publishes its comprehensive annual report, highlighting emerging trends, growth drivers, revenue analysis, and forecast outlook. Our insights help businesses to make data-backed strategic decisions with ongoing market dynamics. Our analysts track relevent industries related to the Indonesia Renewable Chemicals Market, allowing our clients with actionable intelligence and reliable forecasts tailored to emerging regional needs.
Yes, we provide customisation as per your requirements. To learn more, feel free to contact us on sales@6wresearch.com
1 Executive Summary |
2 Introduction |
2.1 Key Highlights of the Report |
2.2 Report Description |
2.3 Market Scope & Segmentation |
2.4 Research Methodology |
2.5 Assumptions |
3 Indonesia Renewable Chemicals Market Overview |
3.1 Indonesia Country Macro Economic Indicators |
3.2 Indonesia Renewable Chemicals Market Revenues & Volume, 2022 & 2032F |
3.3 Indonesia Renewable Chemicals Market - Industry Life Cycle |
3.4 Indonesia Renewable Chemicals Market - Porter's Five Forces |
3.5 Indonesia Renewable Chemicals Market Revenues & Volume Share, By Product Type, 2022 & 2032F |
3.6 Indonesia Renewable Chemicals Market Revenues & Volume Share, By Applications, 2022 & 2032F |
4 Indonesia Renewable Chemicals Market Dynamics |
4.1 Impact Analysis |
4.2 Market Drivers |
4.2.1 Increasing government support and regulations promoting the use of renewable chemicals in Indonesia |
4.2.2 Growing awareness among consumers regarding sustainability and eco-friendly products |
4.2.3 Rising demand from industries such as cosmetics, food and beverages, and packaging for renewable chemicals |
4.3 Market Restraints |
4.3.1 High production costs associated with renewable chemicals compared to traditional petroleum-based chemicals |
4.3.2 Limited availability of raw materials for renewable chemical production in Indonesia |
4.3.3 Lack of infrastructure and technology advancements hindering the widespread adoption of renewable chemicals in the market |
5 Indonesia Renewable Chemicals Market Trends |
6 Indonesia Renewable Chemicals Market, By Types |
6.1 Indonesia Renewable Chemicals Market, By Product Type |
6.1.1 Overview and Analysis |
6.1.2 Indonesia Renewable Chemicals Market Revenues & Volume, By Product Type, 2022-2032F |
6.1.3 Indonesia Renewable Chemicals Market Revenues & Volume, By Alcohols, 2022-2032F |
6.1.4 Indonesia Renewable Chemicals Market Revenues & Volume, By Organic Acids, 2022-2032F |
6.1.5 Indonesia Renewable Chemicals Market Revenues & Volume, By Ketones, 2022-2032F |
6.1.6 Indonesia Renewable Chemicals Market Revenues & Volume, By Platform Chemicals, 2022-2032F |
6.1.7 Indonesia Renewable Chemicals Market Revenues & Volume, By Biopolymers, 2022-2032F |
6.1.8 Indonesia Renewable Chemicals Market Revenues & Volume, By Others, 2022-2032F |
6.2 Indonesia Renewable Chemicals Market, By Applications |
6.2.1 Overview and Analysis |
6.2.2 Indonesia Renewable Chemicals Market Revenues & Volume, By Transportation, 2022-2032F |
6.2.3 Indonesia Renewable Chemicals Market Revenues & Volume, By Textiles, 2022-2032F |
6.2.4 Indonesia Renewable Chemicals Market Revenues & Volume, By Food safety, 2022-2032F |
6.2.5 Indonesia Renewable Chemicals Market Revenues & Volume, By Environment, 2022-2032F |
6.2.6 Indonesia Renewable Chemicals Market Revenues & Volume, By Communication, 2022-2032F |
6.2.7 Indonesia Renewable Chemicals Market Revenues & Volume, By Housing, 2022-2032F |
6.2.8 Indonesia Renewable Chemicals Market Revenues & Volume, By Other Applications, 2022-2032F |
6.2.9 Indonesia Renewable Chemicals Market Revenues & Volume, By Other Applications, 2022-2032F |
7 Indonesia Renewable Chemicals Market Import-Export Trade Statistics |
7.1 Indonesia Renewable Chemicals Market Export to Major Countries |
7.2 Indonesia Renewable Chemicals Market Imports from Major Countries |
8 Indonesia Renewable Chemicals Market Key Performance Indicators |
8.1 Percentage of renewable chemicals in the overall chemical market in Indonesia |
8.2 Investment in research and development for renewable chemical technologies |
8.3 Adoption rate of renewable chemicals by key industries in Indonesia |
9 Indonesia Renewable Chemicals Market - Opportunity Assessment |
9.1 Indonesia Renewable Chemicals Market Opportunity Assessment, By Product Type, 2022 & 2032F |
9.2 Indonesia Renewable Chemicals Market Opportunity Assessment, By Applications, 2022 & 2032F |
10 Indonesia Renewable Chemicals Market - Competitive Landscape |
10.1 Indonesia Renewable Chemicals Market Revenue Share, By Companies, 2025 |
10.2 Indonesia Renewable Chemicals Market Competitive Benchmarking, By Operating and Technical Parameters |
11 Company Profiles |
12 Recommendations |
13 Disclaimer |
Global Go To Market Strategy - 2030
Export potential enables firms to identify high-growth global markets with greater confidence by combining advanced trade intelligence with a structured quantitative methodology. The framework analyzes emerging demand trends and country-level import patterns while integrating macroeconomic and trade datasets such as GDP and population forecasts, bilateral import–export flows, tariff structures, elasticity differentials between developed and developing economies, geographic distance, and import demand projections. Using weighted trade values from 2020–2024 as the base period to project country-to-country export potential for 2030, these inputs are operationalized through calculated drivers such as gravity model parameters, tariff impact factors, and projected GDP per-capita growth. Through an analysis of hidden potentials, demand hotspots, and market conditions that are most favorable to success, this method enables firms to focus on target countries, maximize returns, and global expansion with data, backed by accuracy.
By factoring in the projected importer demand gap that is currently unmet and could be potential opportunity, it identifies the potential for the Exporter (Country) among 190 countries, against the general trade analysis, which identifies the biggest importer or exporter.
To discover high-growth global markets and optimize your business strategy:
Click Here
Pricing
- Single User License$ 1,995
- Department License$ 2,400
- Site License$ 3,120
- Global License$ 3,795

Leadership Perspectives from Industry Events
Search
Thought Leadership and Analyst Meet


Our Clients
6WResearch In News
- India Air Conditioner Market Set for Strong Rebound in 2026 After Weather-Led Correction and GST-Driven Recovery: 6Wresearch
- ADAS in India: How Automatic Emergency Braking, Blind Spot Detection & Driver Monitoring are Transforming Road Safety
- Doha a strategic location for EV manufacturing hub: IPA Qatar
- Demand for luxury TVs surging in the GCC, says Samsung
- Empowering Growth: The Thriving Journey of Bangladesh’s Cable Industry
- Demand for luxury TVs surging in the GCC, says Samsung
Latest Reports
- Nicaragua RPG Gaming Market (2026-2032)
- New Zealand RPG Gaming Market (2026-2032)
- Netherlands RPG Gaming Market (2026-2032)
- Nauru RPG Gaming Market (2026-2032)
- Namibia RPG Gaming Market (2026-2032)
- Mozambique RPG Gaming Market (2026-2032)
- Montenegro RPG Gaming Market (2026-2032)
- Mongolia RPG Gaming Market (2026-2032)
- Monaco RPG Gaming Market (2026-2032)
- Micronesia RPG Gaming Market (2026-2032)
Industry Events and Analyst Meet

EV India Expo 2026

HIMTEX 2026

India Refining Summit 2026

India EV Show 2026

EV tech India Expo 2026
Whitepaper
- Middle East & Africa Commercial Security Market Click here to view more.
- Middle East & Africa Fire Safety Systems & Equipment Market Click here to view more.
- GCC Drone Market Click here to view more.
- Middle East Lighting Fixture Market Click here to view more.
- GCC Physical & Perimeter Security Market Click here to view more.