Indonesia Silica Sand For Glass Making Market (2026-2032) Outlook | Companies, Size, Value, Industry, Growth, Analysis, Share, Forecast, Trends & Revenue
Market Forecast By Application (Flat Glass, Fiber Glass, Glass Containers, Special & Technical, Tableware Glass, Others), By Purity (High Purity, Ultra High Purity) And Competitive Landscape
| Product Code: ETC346588 | Publication Date: Aug 2022 | Updated Date: Mar 2026 | Product Type: Market Research Report | |
| Publisher: 6Wresearch | Author: Ravi Bhandari | No. of Pages: 75 | No. of Figures: 35 | No. of Tables: 20 |
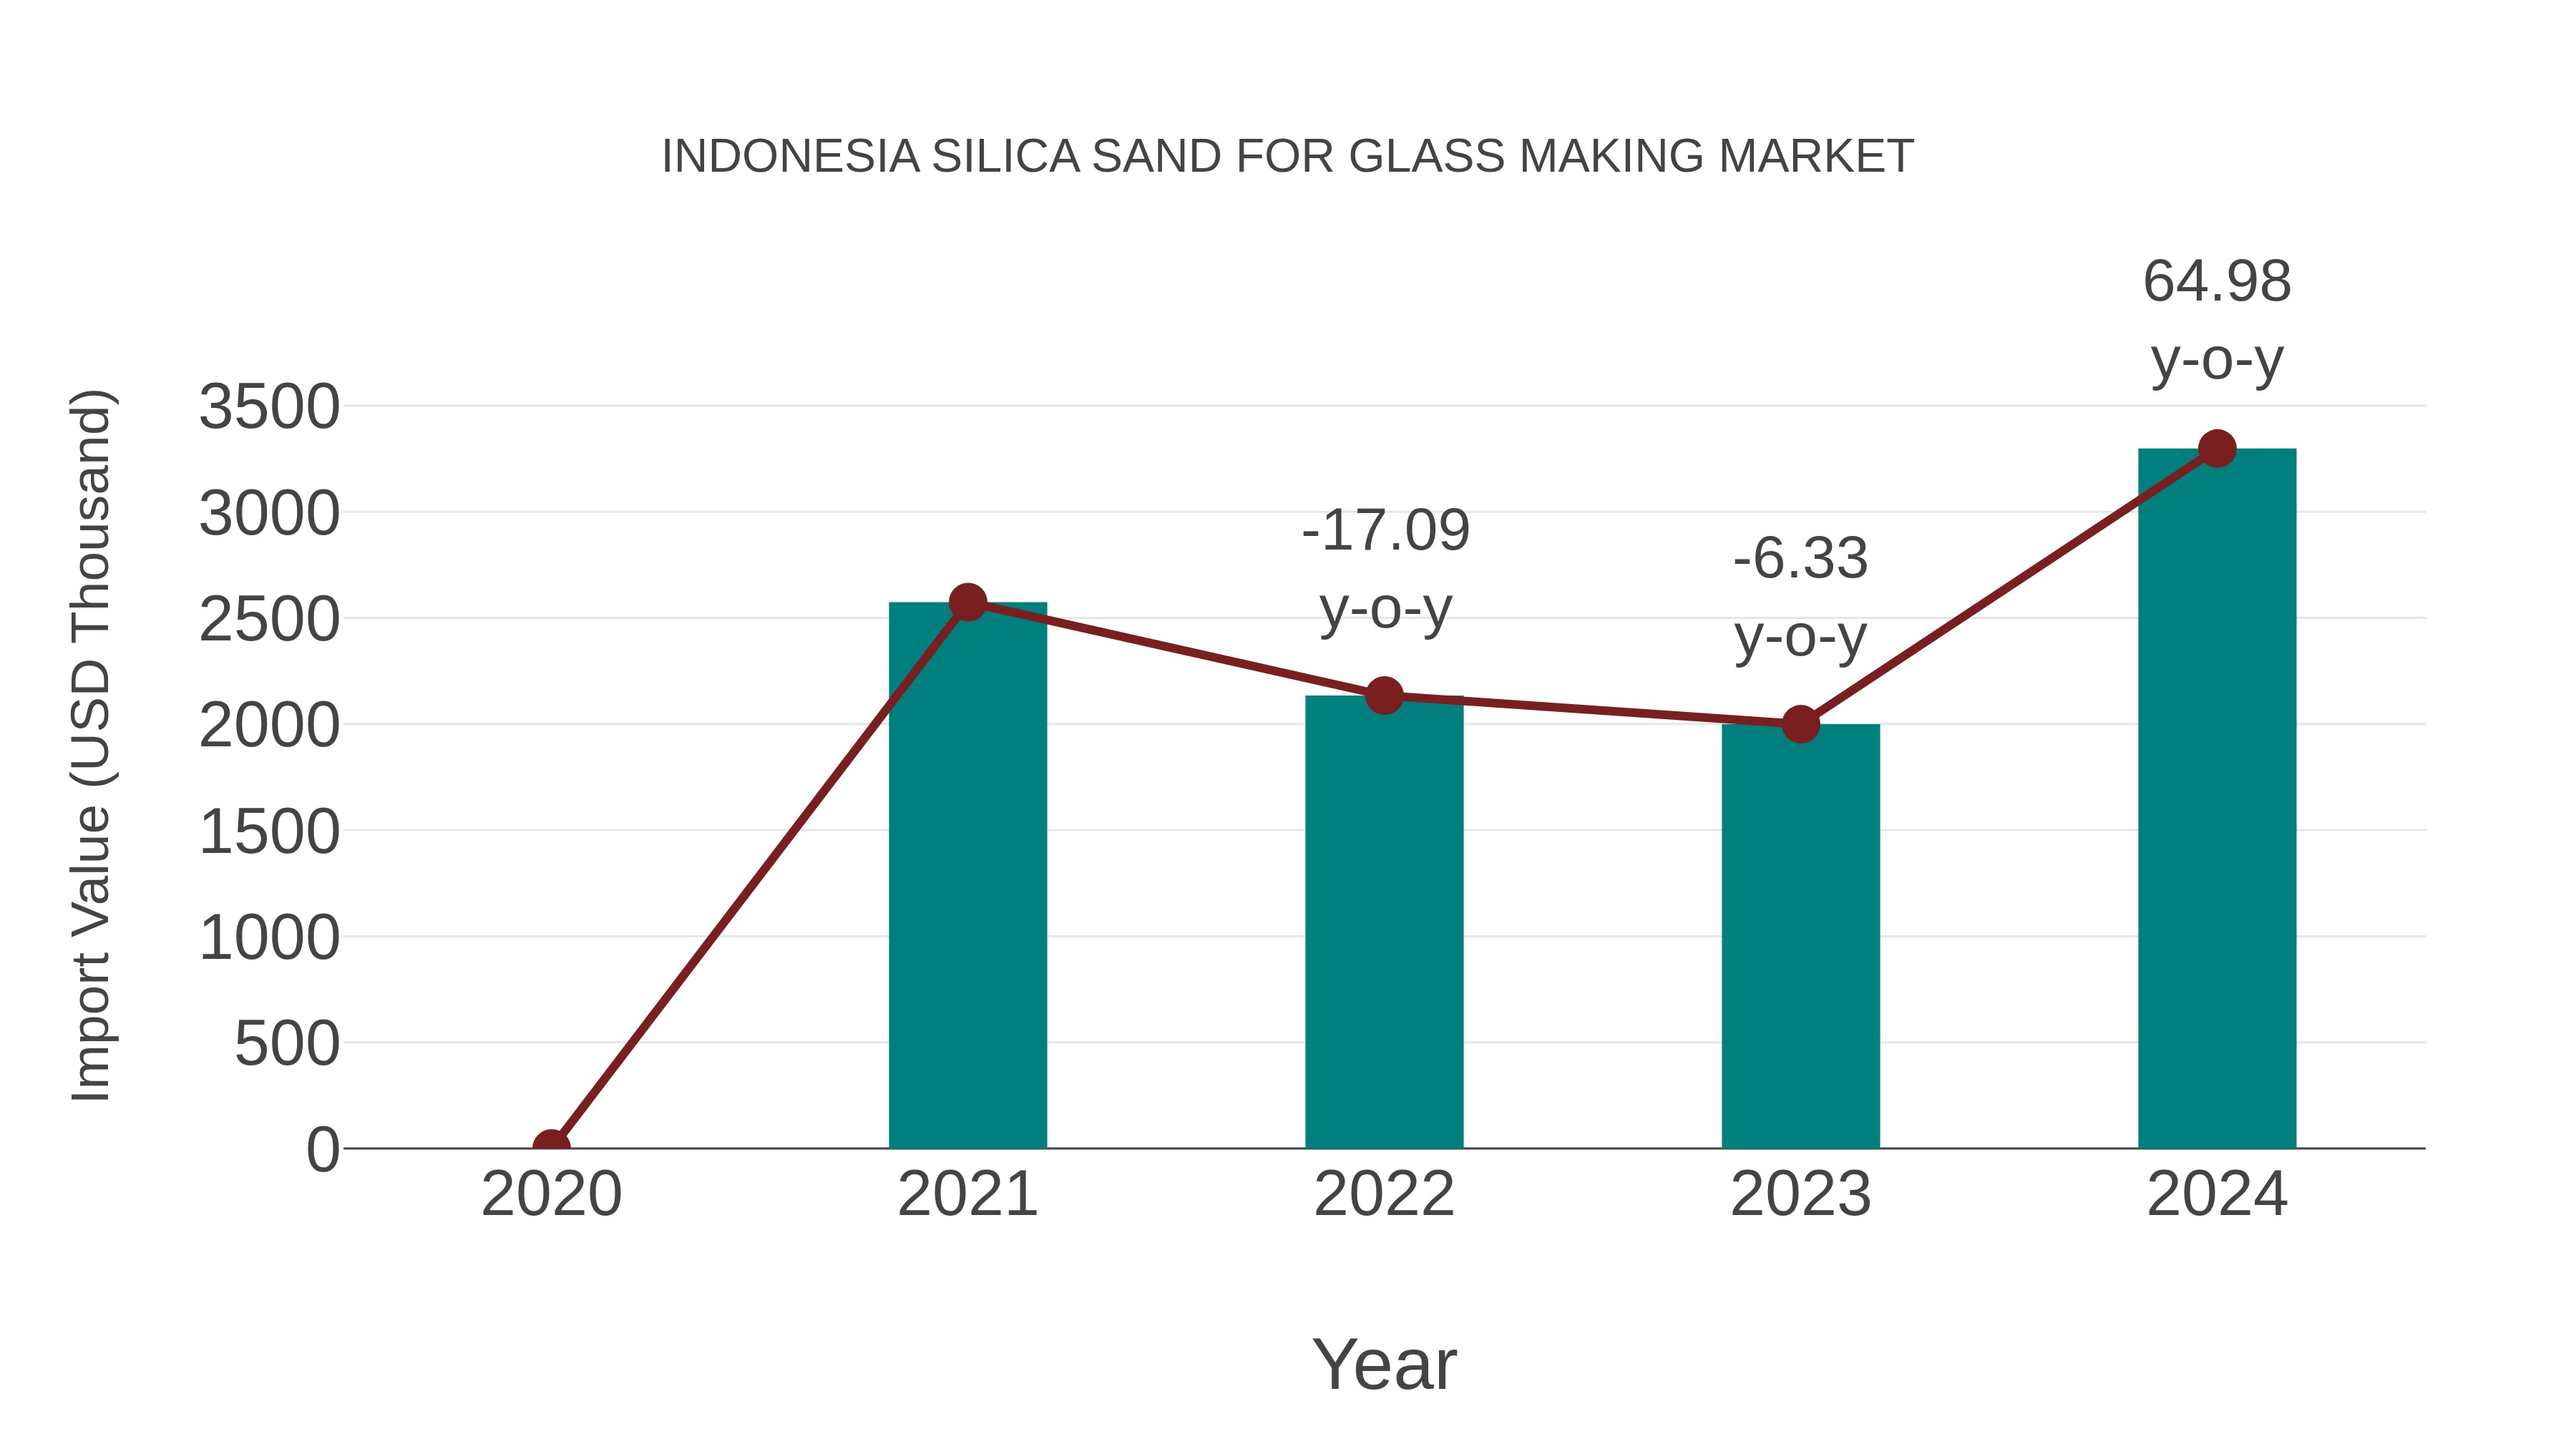
Indonesia Silica Sand for Glass Making Market: Import Trend Analysis
Indonesia`s import trend for silica sand for glass making saw significant growth from 2023 to 2024, with a growth rate of 64.98%. The compound annual growth rate (CAGR) for the period 2020-2024 stood at 8.61%. This import momentum can be attributed to increased demand for silica sand in the glassmaking industry, indicating a positive market stability and potential for further growth in the sector.
Indonesia Silica Sand For Glass Making Market Synopsis
Silica sand is a key ingredient in glass production, and the demand for high-quality silica sand for glass making in Indonesia is on the rise. With a burgeoning construction and automotive industry, the glass market is expanding, thereby driving the demand for silica sand suitable for glass manufacturing.
Drivers of the Market
The Indonesia silica sand for glass making market is experiencing substantial growth due to several key drivers. Firstly, the thriving glass manufacturing industry, driven by increased demand in architecture, automotive, and consumer electronics sectors, is propelling the market. High-quality silica sand is a critical raw material in glass production, and its availability is crucial for the industry`s growth. Secondly, the construction industry`s expansion and the demand for aesthetically appealing glass facades in buildings are boosting the need for silica sand. Moreover, advancements in glass technology, such as the development of energy-efficient and smart glass, are driving the demand for specialized silica sand. Additionally, Indonesia`s abundant natural resources of silica sand position it as a prominent supplier to both domestic and international markets. Overall, the Indonesia silica sand for glass making market is thriving due to the booming glass industry and Indonesia`s strategic role in supplying quality silica sand.
Challenges of the Market
The Indonesia silica sand for glass making market encounters challenges associated with maintaining the quality and consistency of silica sand required for glass production. Ensuring a steady supply of high-purity silica sand is essential to meet the stringent requirements of the glass industry. Additionally, competition from international suppliers and potential fluctuations in global demand can impact the market. Market players should prioritize quality control, invest in processing technology, and establish long-term partnerships with glass manufacturers to secure a stable market share.
COVID-19 Impact on the Market
This topic would specifically focus on the use of silica sand in the glass manufacturing industry. It may cover factors like quality requirements, supply sources, and market dynamics.
Key Players in the Market
In the Indonesia silica sand for glass making market, key players such as PT. Tiga Rasa Indonesia and CV. Wira Sembrani Minerals have gained prominence. PT. Tiga Rasa Indonesia specializes in producing high-quality silica sand suitable for glass manufacturing, meeting the stringent quality standards required by the industry. CV. Wira Sembrani Minerals is known for its extensive silica sand reserves and efficient mining operations, ensuring a steady supply of raw materials to glass manufacturers in Indonesia. The glass industry`s growth in the country relies heavily on a consistent supply of high-quality silica sand.
Key Highlights of the Report:
- Indonesia Silica Sand For Glass Making Market Outlook
- Market Size of Indonesia Silica Sand For Glass Making Market, 2025
- Forecast of Indonesia Silica Sand For Glass Making Market, 2032
- Historical Data and Forecast of Indonesia Silica Sand For Glass Making Revenues & Volume for the Period 2022-2032F
- Indonesia Silica Sand For Glass Making Market Trend Evolution
- Indonesia Silica Sand For Glass Making Market Drivers and Challenges
- Indonesia Silica Sand For Glass Making Price Trends
- Indonesia Silica Sand For Glass Making Porter's Five Forces
- Indonesia Silica Sand For Glass Making Industry Life Cycle
- Historical Data and Forecast of Indonesia Silica Sand For Glass Making Market Revenues & Volume By Application for the Period 2022-2032F
- Historical Data and Forecast of Indonesia Silica Sand For Glass Making Market Revenues & Volume By Flat Glass for the Period 2022-2032F
- Historical Data and Forecast of Indonesia Silica Sand For Glass Making Market Revenues & Volume By Fiber Glass for the Period 2022-2032F
- Historical Data and Forecast of Indonesia Silica Sand For Glass Making Market Revenues & Volume By Glass Containers for the Period 2022-2032F
- Historical Data and Forecast of Indonesia Silica Sand For Glass Making Market Revenues & Volume By Special & Technical for the Period 2022-2032F
- Historical Data and Forecast of Indonesia Silica Sand For Glass Making Market Revenues & Volume By Tableware Glass for the Period 2022-2032F
- Historical Data and Forecast of Indonesia Silica Sand For Glass Making Market Revenues & Volume By Others for the Period 2022-2032F
- Historical Data and Forecast of Indonesia Silica Sand For Glass Making Market Revenues & Volume By Purity for the Period 2022-2032F
- Historical Data and Forecast of Indonesia Silica Sand For Glass Making Market Revenues & Volume By High Purity for the Period 2022-2032F
- Historical Data and Forecast of Indonesia Silica Sand For Glass Making Market Revenues & Volume By Ultra High Purity for the Period 2022-2032F
- Indonesia Silica Sand For Glass Making Import Export Trade Statistics
- Market Opportunity Assessment By Application
- Market Opportunity Assessment By Purity
- Indonesia Silica Sand For Glass Making Top Companies Market Share
- Indonesia Silica Sand For Glass Making Competitive Benchmarking By Technical and Operational Parameters
- Indonesia Silica Sand For Glass Making Company Profiles
- Indonesia Silica Sand For Glass Making Key Strategic Recommendations
Indonesia Silica Sand For Glass Making Market (2026-2032): FAQs
6Wresearch actively monitors the Indonesia Silica Sand For Glass Making Market and publishes its comprehensive annual report, highlighting emerging trends, growth drivers, revenue analysis, and forecast outlook. Our insights help businesses to make data-backed strategic decisions with ongoing market dynamics. Our analysts track relevent industries related to the Indonesia Silica Sand For Glass Making Market, allowing our clients with actionable intelligence and reliable forecasts tailored to emerging regional needs.
Yes, we provide customisation as per your requirements. To learn more, feel free to contact us on sales@6wresearch.com
1 Executive Summary |
2 Introduction |
2.1 Key Highlights of the Report |
2.2 Report Description |
2.3 Market Scope & Segmentation |
2.4 Research Methodology |
2.5 Assumptions |
3 Indonesia Silica Sand For Glass Making Market Overview |
3.1 Indonesia Country Macro Economic Indicators |
3.2 Indonesia Silica Sand For Glass Making Market Revenues & Volume, 2022 & 2032F |
3.3 Indonesia Silica Sand For Glass Making Market - Industry Life Cycle |
3.4 Indonesia Silica Sand For Glass Making Market - Porter's Five Forces |
3.5 Indonesia Silica Sand For Glass Making Market Revenues & Volume Share, By Application, 2022 & 2032F |
3.6 Indonesia Silica Sand For Glass Making Market Revenues & Volume Share, By Purity, 2022 & 2032F |
4 Indonesia Silica Sand For Glass Making Market Dynamics |
4.1 Impact Analysis |
4.2 Market Drivers |
4.2.1 Growing demand for glass products in various industries, such as construction, automotive, and electronics, driving the need for silica sand. |
4.2.2 Increasing investments in infrastructure projects and urbanization in Indonesia, leading to higher consumption of glass made from silica sand. |
4.2.3 Technological advancements in glass manufacturing processes, increasing the efficiency and quality of silica sand usage. |
4.3 Market Restraints |
4.3.1 Environmental concerns related to silica sand mining and processing, leading to regulatory challenges and sustainability issues. |
4.3.2 Fluctuations in silica sand prices due to factors like supply chain disruptions, geopolitical issues, and changes in demand. |
4.3.3 Competition from alternative materials in the glass-making industry, impacting the market share of silica sand. |
5 Indonesia Silica Sand For Glass Making Market Trends |
6 Indonesia Silica Sand For Glass Making Market, By Types |
6.1 Indonesia Silica Sand For Glass Making Market, By Application |
6.1.1 Overview and Analysis |
6.1.2 Indonesia Silica Sand For Glass Making Market Revenues & Volume, By Application, 2022-2032F |
6.1.3 Indonesia Silica Sand For Glass Making Market Revenues & Volume, By Flat Glass, 2022-2032F |
6.1.4 Indonesia Silica Sand For Glass Making Market Revenues & Volume, By Fiber Glass, 2022-2032F |
6.1.5 Indonesia Silica Sand For Glass Making Market Revenues & Volume, By Glass Containers, 2022-2032F |
6.1.6 Indonesia Silica Sand For Glass Making Market Revenues & Volume, By Special & Technical, 2022-2032F |
6.1.7 Indonesia Silica Sand For Glass Making Market Revenues & Volume, By Tableware Glass, 2022-2032F |
6.1.8 Indonesia Silica Sand For Glass Making Market Revenues & Volume, By Others, 2022-2032F |
6.2 Indonesia Silica Sand For Glass Making Market, By Purity |
6.2.1 Overview and Analysis |
6.2.2 Indonesia Silica Sand For Glass Making Market Revenues & Volume, By High Purity, 2022-2032F |
6.2.3 Indonesia Silica Sand For Glass Making Market Revenues & Volume, By Ultra High Purity, 2022-2032F |
7 Indonesia Silica Sand For Glass Making Market Import-Export Trade Statistics |
7.1 Indonesia Silica Sand For Glass Making Market Export to Major Countries |
7.2 Indonesia Silica Sand For Glass Making Market Imports from Major Countries |
8 Indonesia Silica Sand For Glass Making Market Key Performance Indicators |
8.1 Energy efficiency of silica sand extraction and processing operations. |
8.2 Percentage of silica sand sourced from sustainable and environmentally friendly mines. |
8.3 Adoption rate of advanced glass-making technologies utilizing silica sand. |
8.4 Research and development investments in improving the quality and purity of silica sand for glass production. |
9 Indonesia Silica Sand For Glass Making Market - Opportunity Assessment |
9.1 Indonesia Silica Sand For Glass Making Market Opportunity Assessment, By Application, 2022 & 2032F |
9.2 Indonesia Silica Sand For Glass Making Market Opportunity Assessment, By Purity, 2022 & 2032F |
10 Indonesia Silica Sand For Glass Making Market - Competitive Landscape |
10.1 Indonesia Silica Sand For Glass Making Market Revenue Share, By Companies, 2025 |
10.2 Indonesia Silica Sand For Glass Making Market Competitive Benchmarking, By Operating and Technical Parameters |
11 Company Profiles |
12 Recommendations |
13 Disclaimer |
Global Go To Market Strategy - 2030
Export potential enables firms to identify high-growth global markets with greater confidence by combining advanced trade intelligence with a structured quantitative methodology. The framework analyzes emerging demand trends and country-level import patterns while integrating macroeconomic and trade datasets such as GDP and population forecasts, bilateral import–export flows, tariff structures, elasticity differentials between developed and developing economies, geographic distance, and import demand projections. Using weighted trade values from 2020–2024 as the base period to project country-to-country export potential for 2030, these inputs are operationalized through calculated drivers such as gravity model parameters, tariff impact factors, and projected GDP per-capita growth. Through an analysis of hidden potentials, demand hotspots, and market conditions that are most favorable to success, this method enables firms to focus on target countries, maximize returns, and global expansion with data, backed by accuracy.
By factoring in the projected importer demand gap that is currently unmet and could be potential opportunity, it identifies the potential for the Exporter (Country) among 190 countries, against the general trade analysis, which identifies the biggest importer or exporter.
To discover high-growth global markets and optimize your business strategy:
Click Here
Pricing
- Single User License$ 1,995
- Department License$ 2,400
- Site License$ 3,120
- Global License$ 3,795

Leadership Perspectives from Industry Events
Search
Thought Leadership and Analyst Meet


Our Clients
6WResearch In News
- India Air Conditioner Market Set for Strong Rebound in 2026 After Weather-Led Correction and GST-Driven Recovery: 6Wresearch
- ADAS in India: How Automatic Emergency Braking, Blind Spot Detection & Driver Monitoring are Transforming Road Safety
- Doha a strategic location for EV manufacturing hub: IPA Qatar
- Demand for luxury TVs surging in the GCC, says Samsung
- Empowering Growth: The Thriving Journey of Bangladesh’s Cable Industry
- Demand for luxury TVs surging in the GCC, says Samsung
Latest Reports
- Nicaragua RPG Gaming Market (2026-2032)
- New Zealand RPG Gaming Market (2026-2032)
- Netherlands RPG Gaming Market (2026-2032)
- Nauru RPG Gaming Market (2026-2032)
- Namibia RPG Gaming Market (2026-2032)
- Mozambique RPG Gaming Market (2026-2032)
- Montenegro RPG Gaming Market (2026-2032)
- Mongolia RPG Gaming Market (2026-2032)
- Monaco RPG Gaming Market (2026-2032)
- Micronesia RPG Gaming Market (2026-2032)
Industry Events and Analyst Meet

EV India Expo 2026

HIMTEX 2026

India Refining Summit 2026

India EV Show 2026

EV tech India Expo 2026
Whitepaper
- Middle East & Africa Commercial Security Market Click here to view more.
- Middle East & Africa Fire Safety Systems & Equipment Market Click here to view more.
- GCC Drone Market Click here to view more.
- Middle East Lighting Fixture Market Click here to view more.
- GCC Physical & Perimeter Security Market Click here to view more.