Indonesia Silverware, Plated Ware and Stainless Steel Ware Market (2026-2032) | Revenue, Companies, Growth, Trends, Share, Size, Analysis, Outlook, Value, Industry & Forecast
Market Forecast By Type (Sliver, Plated, Stainless Steel), By Application (Commercial Use, Residential Use), By Sales Channel (Direct Channel, Distribution Channel) And Competitive Landscape
| Product Code: ETC031908 | Publication Date: Jul 2023 | Updated Date: Jun 2026 | Product Type: Report | |
| Publisher: 6Wresearch | Author: Ravi Bhandari | No. of Pages: 70 | No. of Figures: 35 | No. of Tables: 5 |
Indonesia Silverware, Plated Ware and Stainless Steel Ware Market Summary
The indonesia silverware, plated ware and stainless steel ware market was estimated at USD 1093 Million in 2025 and is projected to reach USD 1673 Million by 2032, growing at a CAGR of 7.4% from 2026 to 2032.
Indonesia Silverware, Plated Ware and Stainless Steel Ware Market Year-wise Growth Rate and Key Drivers
This graph highlights how the Indonesia Silverware, Plated Ware and Stainless Steel Ware Market has steadily grown over the years, supported by major growth factors.
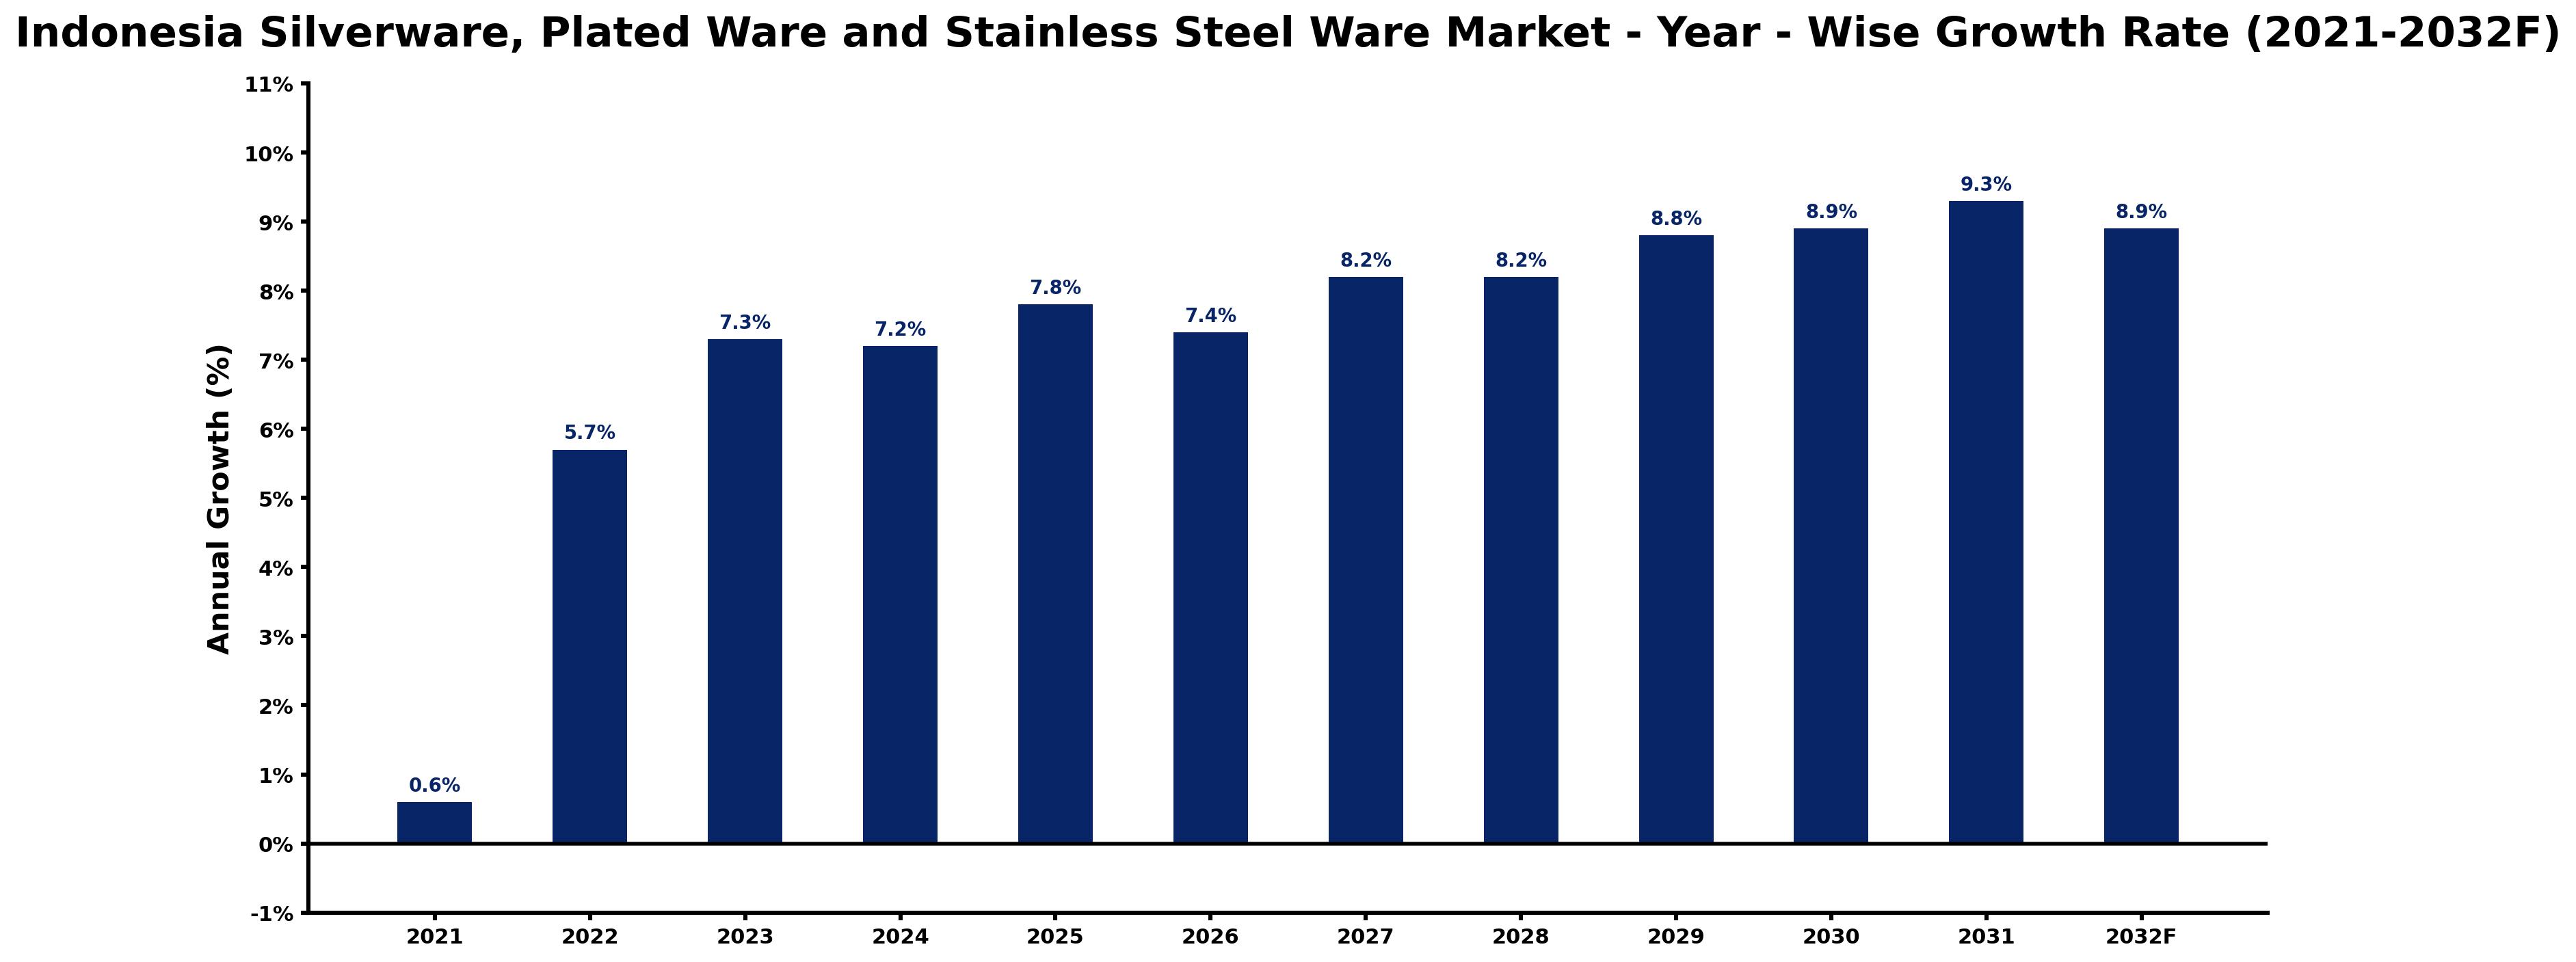
The table below presents the year wise growth rates along with the key drivers influencing the market
| Year | Growth Rate | Major Drivers |
| 2021 | 0.6% | Post-lockdown retail projects ignited consumer interest in home and kitchen products. |
| 2022 | 5.7% | Local craftsmanship gained traction, emphasizing culturally inspired silverware designs. |
| 2023 | 7.3% | E-commerce platforms expanded, facilitating easier access to decorative stainless steel items. |
| 2024 | 7.2% | Sustainable practices emerged, influencing production and consumption of eco-friendly plated ware. |
| 2025 | 7.8% | Urbanization trends shifted consumers towards modern, minimalistic kitchen accessories. |
| 2026 | 7.4% | Retail collaborations with local artisans highlighted unique handcrafted silverware offerings. |
| 2027 | 8.2% | Tourism recovery spurred demand for Indonesian-inspired silverware and plated ware souvenirs. |
| 2028 | 8.2% | Emerging middle class increased spending on premium homeware, including stainless steel products. |
| 2029 | 8.8% | Technological innovations in manufacturing led to higher quality and lower production costs. |
| 2030 | 8.9% | Health and hygiene awareness drove interest in easy-to-clean stainless steel options. |
| 2031 | 9.3% | Cultural events showcased traditional Indonesian silverware, enhancing its market visibility. |
| 2032 | 8.9% | International partnerships enabled market expansion into diverse global retail channels. |
Note - Market size estimations and growth projections presented in this report are based on 6Wresearch's advanced forecasting approach, validated with industry datasets as of June 2026.
Indonesia Silverware, Plated Ware and Stainless Steel Ware Market Synopsis
The Indonesia Silverware, Plated Ware and Stainless Steel Ware Market is projected to reach 7.4% and witness significant growth during the forecast period (2026-2032). As the fourth most populous nation globally, Indonesia, with approximately 265 million inhabitants, presents a robust landscape for market expansion, driven by both economic growth and evolving consumer preferences.
Indonesia Silverware, Plated Ware and Stainless Steel Ware Market Growth Drivers
The growth of the Indonesia Silverware, Plated Ware and Stainless Steel Ware Market can be attributed to several factors that are shaping domestic consumption patterns. Key drivers include:
- Increasing Disposable Income: Over recent years, the GDP per capita in Indonesia has seen a notable rise, from USD 1,852 in 2013 to USD 3,885 in 2018. This increase in disposable income is expected to foster greater demand for premium household products, including silverware and stainless steel items.
- Government Infrastructure Spending: The Indonesian government's substantial investments in infrastructure have bolstered economic activity, stimulating consumer demand for home decor and gifting items, thus enhancing the silverware market.
- Growing Urbanization: As urban areas expand, consumers are increasingly inclined to invest in stylish home furnishings, driving the need for high-quality silverware and plated ware to enhance living spaces.
- Export Incentives: The Indonesian government offers tax relief on exports of household goods, including silverware, facilitating easier access to international markets for domestic manufacturers.
- Enhanced Consumer Preferences: A surge in consumer awareness regarding quality and design is prompting a shift toward higher-end silverware and stainless steel products, contributing to market growth.
Indonesia Silverware, Plated Ware and Stainless Steel Ware Market Challenges and Restraints
Despite the optimistic outlook for the Indonesia Silverware, Plated Ware and Stainless Steel Ware Market, several challenges may hinder growth:
- Technological Limitations: Many manufacturers face obstacles due to outdated machinery that can limit production capabilities and efficiency, affecting their overall output.
- Competition from Imports: The market is increasingly susceptible to competitive pricing from imported goods, which can disrupt local manufacturers and affect market share.
- Quality Control Issues: Ensuring consistent product quality can be challenging for some domestic players, particularly those with limited technological resources.
- Fluctuating Raw Material Prices: Variations in the cost of raw materials can impact production costs, potentially leading to higher retail prices for consumers.
- Market Fragmentation: The presence of numerous small-scale manufacturers may lead to an oversupply situation, which can depress prices and erode profit margins.
Indonesia Silverware, Plated Ware and Stainless Steel Ware Market Government Investment and Initiatives
The Indonesian government has implemented various initiatives to support the growth of the silverware, plated ware, and stainless steel ware sectors. These include:
- Export Incentive Programs: To boost international competitiveness, the government provides tax incentives for exports of silverware and kitchen utensils, encouraging local manufacturers to expand their reach.
- Industrial Development Initiatives: The government is investing in industrial parks and manufacturing hubs that focus on enhancing the capabilities of the silverware sector through modern infrastructure.
- Trade Agreements: Participation in regional trade agreements, such as those facilitated by the ASEAN Economic Community (AEC), promotes free trade and increases market accessibility for Indonesian silverware manufacturers.
- Public Awareness Campaigns: The government is supporting campaigns aimed at raising awareness of Indonesian products, helping to foster pride in local craftsmanship and stimulate domestic demand.
- Enhancing Training and Skills Development: Investment in training initiatives for workers in the silverware industry aims to improve productivity and technological adoption within the sector.
Indonesia Silverware, Plated Ware and Stainless Steel Ware Market Latest Developments (May 2025 - June 2026)
In the period leading up to mid-2026, the Indonesia Silverware, Plated Ware and Stainless Steel Ware Market has witnessed several noteworthy developments:
- Innovation in Product Design: Manufacturers are increasingly focusing on innovative designs to meet the evolving tastes of consumers, enhancing competitiveness in the market.
- Increased Investment in Technology: There has been a push among local firms to modernize production facilities, incorporating advanced technology to improve efficiency and output quality.
- Collaboration Initiatives: Industry stakeholders are exploring collaborative ventures aimed at improving supply chain efficiencies and sharing best practices across the sector.
- Promotion of Sustainable Practices: A growing emphasis on sustainability has led many producers to adopt eco-friendly practices, including the use of recycled materials in their products.
- Market Expansion Plans: Many companies are looking to penetrate new regional markets, seeking to capitalize on growing demand both domestically and internationally.
Indonesia Silverware, Plated Ware and Stainless Steel Ware Market - Key Attractiveness of the Report
- 10 Years of Market Numbers
- Historical Data Starting from 2022 to 2025
- Base Year: 2025
- Forecast Data until 2032
- Key Performance Indicators Impacting the Market
- Major Upcoming Developments and Projects
Key Highlights of the Report:
- Indonesia Silverware, Plated Ware and Stainless Steel Ware Market Outlook
- Market Size of Indonesia Silverware, Plated Ware and Stainless Steel Ware Market, 2025
- Forecast of Indonesia Silverware, Plated Ware and Stainless Steel Ware Market, 2032F
- Historical Data and Forecast of Indonesia Silverware, Plated Ware and Stainless Steel Ware Revenues & Volume for the Period 2022-2032F
- Indonesia Silverware, Plated Ware and Stainless Steel Ware Market Trend Evolution
- Indonesia Silverware, Plated Ware and Stainless Steel Ware Market Drivers and Challenges
- Indonesia Silverware, Plated Ware and Stainless Steel Ware Price Trends
- Indonesia Silverware, Plated Ware and Stainless Steel Ware Porter's Five Forces
- Indonesia Silverware, Plated Ware and Stainless Steel Ware Industry Life Cycle
- Historical Data and Forecast of Indonesia Silverware, Plated Ware and Stainless Steel Ware Market Revenues & Volume By Type for the Period 2022-2032F
- Historical Data and Forecast of Indonesia Silverware, Plated Ware and Stainless Steel Ware Market Revenues & Volume By Sliver for the Period 2022-2032F
- Historical Data and Forecast of Indonesia Silverware, Plated Ware and Stainless Steel Ware Market Revenues & Volume By Plated for the Period 2022-2032F
- Historical Data and Forecast of Indonesia Silverware, Plated Ware and Stainless Steel Ware Market Revenues & Volume By Stainless Steel for the Period 2022-2032F
- Historical Data and Forecast of Indonesia Silverware, Plated Ware and Stainless Steel Ware Market Revenues & Volume By Application for the Period 2022-2032F
- Historical Data and Forecast of Indonesia Silverware, Plated Ware and Stainless Steel Ware Market Revenues & Volume By Commercial Use for the Period 2022-2032F
- Historical Data and Forecast of Indonesia Silverware, Plated Ware and Stainless Steel Ware Market Revenues & Volume By Residential Use for the Period 2022-2032F
- Historical Data and Forecast of Indonesia Silverware, Plated Ware and Stainless Steel Ware Market Revenues & Volume By Sales Channel for the Period 2022-2032F
- Historical Data and Forecast of Indonesia Silverware, Plated Ware and Stainless Steel Ware Market Revenues & Volume By Direct Channel for the Period 2022-2032F
- Historical Data and Forecast of Indonesia Silverware, Plated Ware and Stainless Steel Ware Market Revenues & Volume By Distribution Channel for the Period 2022-2032F
- Indonesia Silverware, Plated Ware and Stainless Steel Ware Import Export Trade Statistics
- Market Opportunity Assessment By Type
- Market Opportunity Assessment By Application
- Market Opportunity Assessment By Sales Channel
- Indonesia Silverware, Plated Ware and Stainless Steel Ware Top Companies Market Share
- Indonesia Silverware, Plated Ware and Stainless Steel Ware Competitive Benchmarking By Technical and Operational Parameters
- Indonesia Silverware, Plated Ware and Stainless Steel Ware Company Profiles
- Indonesia Silverware, Plated Ware and Stainless Steel Ware Key Strategic Recommendations
Frequently Asked Questions About the Market Study (FAQs):
The market growth can be attributed to rising disposable income, government infrastructure investments, and increasing consumer demand for stylish home decor items.
Manufacturers encounter challenges such as technological limitations, competition from imports, and fluctuating raw material prices that can affect production and profitability.
The government supports the market through export incentive programs, industrial development initiatives, and promoting trade agreements to enhance market access for local producers.
Recent developments include increased investment in technology, innovation in product design, and a growing emphasis on sustainable practices among manufacturers.
6Wresearch actively monitors the Indonesia Silverware, Plated Ware and Stainless Steel Ware Market and publishes its comprehensive annual report, highlighting emerging trends, growth drivers, revenue analysis, and forecast outlook. Our insights help businesses to make data-backed strategic decisions with ongoing market dynamics. Our analysts track relevent industries related to the Indonesia Silverware, Plated Ware and Stainless Steel Ware Market, allowing our clients with actionable intelligence and reliable forecasts tailored to emerging regional needs.
Yes, we provide customisation as per your requirements. To learn more, feel free to contact us on sales@6wresearch.com
1 Executive Summary |
2 Introduction |
2.1 Key Highlights of the Report |
2.2 Report Description |
2.3 Market Scope & Segmentation |
2.4 Research Methodology |
2.5 Assumptions |
3 Indonesia Silverware, Plated Ware and Stainless Steel Ware Market Overview |
3.1 Indonesia Country Macro Economic Indicators |
3.2 Indonesia Silverware, Plated Ware and Stainless Steel Ware Market Revenues & Volume, 2022 & 2032F |
3.3 Indonesia Silverware, Plated Ware and Stainless Steel Ware Market - Industry Life Cycle |
3.4 Indonesia Silverware, Plated Ware and Stainless Steel Ware Market - Porter's Five Forces |
3.5 Indonesia Silverware, Plated Ware and Stainless Steel Ware Market Revenues & Volume Share, By Type, 2022 & 2032F |
3.6 Indonesia Silverware, Plated Ware and Stainless Steel Ware Market Revenues & Volume Share, By Application, 2022 & 2032F |
3.7 Indonesia Silverware, Plated Ware and Stainless Steel Ware Market Revenues & Volume Share, By Sales Channel, 2022 & 2032F |
4 Indonesia Silverware, Plated Ware and Stainless Steel Ware Market Dynamics |
4.1 Impact Analysis |
4.2 Market Drivers |
4.3 Market Restraints |
5 Indonesia Silverware, Plated Ware and Stainless Steel Ware Market Trends |
6 Indonesia Silverware, Plated Ware and Stainless Steel Ware Market, By Types |
6.1 Indonesia Silverware, Plated Ware and Stainless Steel Ware Market, By Type |
6.1.1 Overview and Analysis |
6.1.2 Indonesia Silverware, Plated Ware and Stainless Steel Ware Market Revenues & Volume, By Type, 2022-2032F |
6.1.3 Indonesia Silverware, Plated Ware and Stainless Steel Ware Market Revenues & Volume, By Sliver, 2022-2032F |
6.1.4 Indonesia Silverware, Plated Ware and Stainless Steel Ware Market Revenues & Volume, By Plated, 2022-2032F |
6.1.5 Indonesia Silverware, Plated Ware and Stainless Steel Ware Market Revenues & Volume, By Stainless Steel, 2022-2032F |
6.2 Indonesia Silverware, Plated Ware and Stainless Steel Ware Market, By Application |
6.2.1 Overview and Analysis |
6.2.2 Indonesia Silverware, Plated Ware and Stainless Steel Ware Market Revenues & Volume, By Commercial Use, 2022-2032F |
6.2.3 Indonesia Silverware, Plated Ware and Stainless Steel Ware Market Revenues & Volume, By Residential Use, 2022-2032F |
6.3 Indonesia Silverware, Plated Ware and Stainless Steel Ware Market, By Sales Channel |
6.3.1 Overview and Analysis |
6.3.2 Indonesia Silverware, Plated Ware and Stainless Steel Ware Market Revenues & Volume, By Direct Channel, 2022-2032F |
6.3.3 Indonesia Silverware, Plated Ware and Stainless Steel Ware Market Revenues & Volume, By Distribution Channel, 2022-2032F |
7 Indonesia Silverware, Plated Ware and Stainless Steel Ware Market Import-Export Trade Statistics |
7.1 Indonesia Silverware, Plated Ware and Stainless Steel Ware Market Export to Major Countries |
7.2 Indonesia Silverware, Plated Ware and Stainless Steel Ware Market Imports from Major Countries |
8 Indonesia Silverware, Plated Ware and Stainless Steel Ware Market Key Performance Indicators |
9 Indonesia Silverware, Plated Ware and Stainless Steel Ware Market - Opportunity Assessment |
9.1 Indonesia Silverware, Plated Ware and Stainless Steel Ware Market Opportunity Assessment, By Type, 2022 & 2032F |
9.2 Indonesia Silverware, Plated Ware and Stainless Steel Ware Market Opportunity Assessment, By Application, 2022 & 2032F |
9.3 Indonesia Silverware, Plated Ware and Stainless Steel Ware Market Opportunity Assessment, By Sales Channel, 2022 & 2032F |
10 Indonesia Silverware, Plated Ware and Stainless Steel Ware Market - Competitive Landscape |
10.1 Indonesia Silverware, Plated Ware and Stainless Steel Ware Market Revenue Share, By Companies, 2025 |
10.2 Indonesia Silverware, Plated Ware and Stainless Steel Ware Market Competitive Benchmarking, By Operating and Technical Parameters |
11 Company Profiles |
12 Recommendations |
13 Disclaimer |
Global Go To Market Strategy - 2030
Export potential enables firms to identify high-growth global markets with greater confidence by combining advanced trade intelligence with a structured quantitative methodology. The framework analyzes emerging demand trends and country-level import patterns while integrating macroeconomic and trade datasets such as GDP and population forecasts, bilateral import–export flows, tariff structures, elasticity differentials between developed and developing economies, geographic distance, and import demand projections. Using weighted trade values from 2020–2024 as the base period to project country-to-country export potential for 2030, these inputs are operationalized through calculated drivers such as gravity model parameters, tariff impact factors, and projected GDP per-capita growth. Through an analysis of hidden potentials, demand hotspots, and market conditions that are most favorable to success, this method enables firms to focus on target countries, maximize returns, and global expansion with data, backed by accuracy.
By factoring in the projected importer demand gap that is currently unmet and could be potential opportunity, it identifies the potential for the Exporter (Country) among 190 countries, against the general trade analysis, which identifies the biggest importer or exporter.
To discover high-growth global markets and optimize your business strategy:
Click Here
Pricing
- Single User License$ 1,995
- Department License$ 2,400
- Site License$ 3,120
- Global License$ 3,795

Leadership Perspectives from Industry Events
Search
Thought Leadership and Analyst Meet


Our Clients
6WResearch In News
- India Air Conditioner Market Set for Strong Rebound in 2026 After Weather-Led Correction and GST-Driven Recovery: 6Wresearch
- ADAS in India: How Automatic Emergency Braking, Blind Spot Detection & Driver Monitoring are Transforming Road Safety
- Doha a strategic location for EV manufacturing hub: IPA Qatar
- Demand for luxury TVs surging in the GCC, says Samsung
- Empowering Growth: The Thriving Journey of Bangladesh’s Cable Industry
- Demand for luxury TVs surging in the GCC, says Samsung
Latest Reports
- Nicaragua RPG Gaming Market (2026-2032)
- New Zealand RPG Gaming Market (2026-2032)
- Netherlands RPG Gaming Market (2026-2032)
- Nauru RPG Gaming Market (2026-2032)
- Namibia RPG Gaming Market (2026-2032)
- Mozambique RPG Gaming Market (2026-2032)
- Montenegro RPG Gaming Market (2026-2032)
- Mongolia RPG Gaming Market (2026-2032)
- Monaco RPG Gaming Market (2026-2032)
- Micronesia RPG Gaming Market (2026-2032)
Industry Events and Analyst Meet

EV India Expo 2026

HIMTEX 2026

India Refining Summit 2026

India EV Show 2026

EV tech India Expo 2026
Whitepaper
- Middle East & Africa Commercial Security Market Click here to view more.
- Middle East & Africa Fire Safety Systems & Equipment Market Click here to view more.
- GCC Drone Market Click here to view more.
- Middle East Lighting Fixture Market Click here to view more.
- GCC Physical & Perimeter Security Market Click here to view more.