Indonesia Solar Power Equipment Market (2026-2032) Outlook | Revenue, Share, Forecast, Size, Analysis, Trends, Growth, Value, Companies, Industry
Market Forecast By Equipment (Solar Panels, Mounting, Racking & Tracking System, Storage System, Others), By Application (Residential, Nonresidential, Utility) And Competitive Landscape
| Product Code: ETC271108 | Publication Date: Aug 2023 | Updated Date: Jul 2026 | Product Type: Market Research Report | |
| Publisher: 6Wresearch | Author: Ravi Bhandari | No. of Pages: 75 | No. of Figures: 35 | No. of Tables: 20 |
Indonesia Solar Power Equipment Market Size, Share & Growth Rate
The Indonesia Solar Power Equipment Market was estimated at USD 794 Million in 2025 and is projected to reach USD 1189 Million by 2032, growing at a CAGR of 5.9% from 2026 to 2032. This growth trajectory is underpinned by heightened consumer awareness of environmental sustainability, reinforced by government mandates promoting renewable energy sources. Additionally, advancements in solar technology and cost-effective financing solutions are catalyzing investment in solar infrastructure, making solar power increasingly appealing across diverse sectors in Indonesia.
Indonesia Solar Power Equipment Market Year-wise Growth Rate and Key Drivers
This graph highlights how the Indonesia Solar Power Equipment Market has steadily grown over the years, supported by major growth factors.
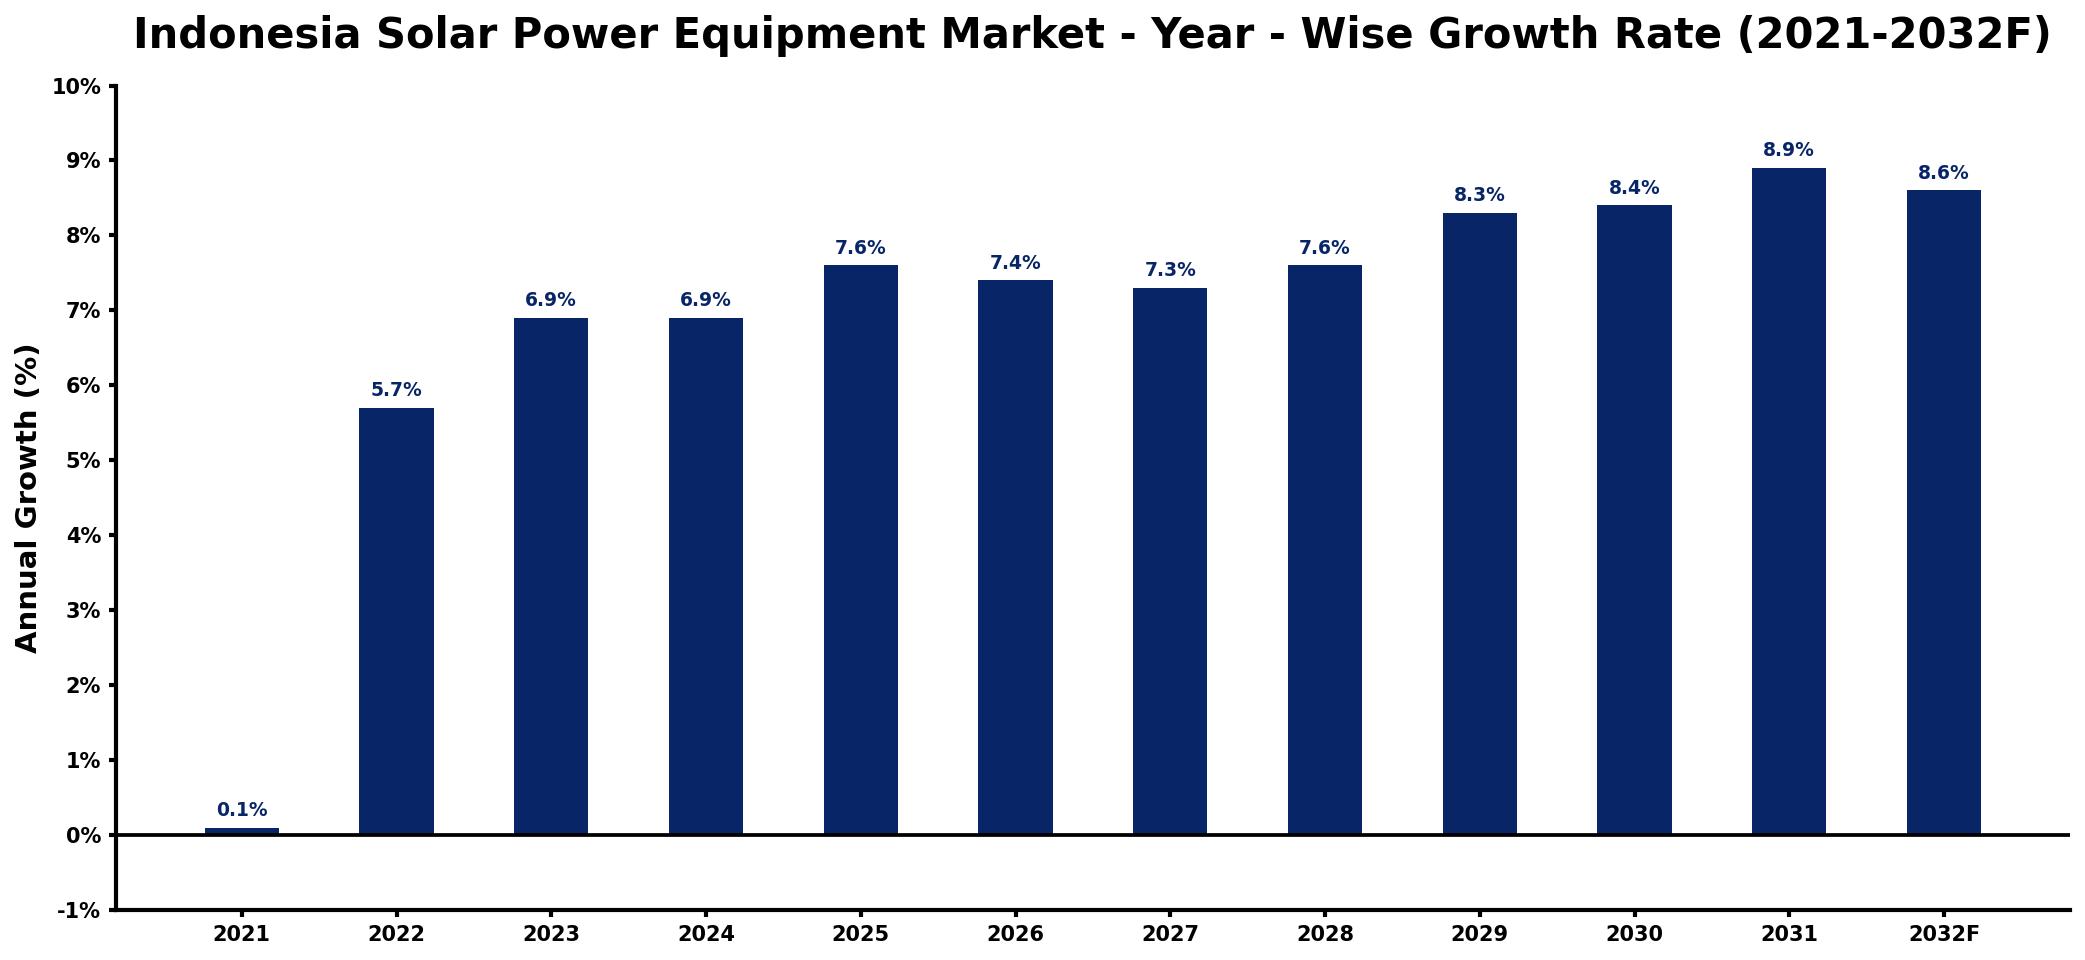
The table below presents the year‑wise growth rates along with the key drivers influencing the market
| Year | Growth Rate | Major Drivers |
| 2021 | 0.1% | Emerging renewable energy policies |
| 2022 | 5.7% | Increased private sector investments |
| 2023 | 6.9% | Growing residential adoption rates |
| 2024 | 6.9% | Expansion of utility-scale projects |
| 2025 | 7.6% | Rising environmental awareness initiatives |
| 2026 | 7.4% | Technological advancements in alternatives |
| 2027 | 7.3% | Enhanced grid integration solutions |
| 2028 | 7.6% | Government incentives for adoption |
| 2029 | 8.3% | Corporate sustainability commitments rising |
| 2030 | 8.4% | International partnerships for innovation |
| 2031 | 8.9% | stronger distribution network expansion |
| 2032 | 8.6% | Growing demand for clean alternatives |
Note: Market size estimations and growth projections presented in this report are based on 6Wresearch's proprietary forecasting methodology, utilizing the latest available industry data, government publications, and primary research inputs.
Indonesia Solar Power Equipment Market Synopsis
The strongest force shaping the Indonesia Solar Power Equipment Market today is the governments robust support for renewable energy initiatives. Policies such as the GIZ Renewable Energy Support Program (RESP) are setting ambitious production targets that are compelling stakeholders to invest in solar technologies. As a result, the competitive landscape is evolving rapidly, accommodating diverse players focused on distributed generation systems.
In addition to governmental support, there is a growing trend toward the adoption of solar energy due to its cost competitiveness and technological advancements. The introduction of Feed-in Tariffs (FIT) and Renewable Portfolio Standards (RPS) schemes is fostering a favorable environment for microgrid systems, thereby attracting investments from banks and non-banking financial companies (NBFCs), which further facilitate the expansion of solar power applications across Indonesia.
Indonesia Solar Power Equipment Market Key Takeaways
- Government policies and consumer awareness are driving the market growth.
- Technological advancements in solar cell efficiency are enhancing market competitiveness.
- Financial incentives from local authorities promote investment in solar infrastructure.
- The trend towards decentralized energy systems is creating new market opportunities.
- Challenges related to initial installation costs remain a focus for manufacturers.
Evaluation of Restraints in Indonesia Solar Power Equipment Market
Despite the optimistic outlook for the Indonesia Solar Power Equipment Market, several restraints are hindering its growth. High upfront costs associated with solar installations remain a significant barrier for potential adopters. Many consumers and businesses are hesitant to make substantial initial investments in solar technology, even when long-term savings are projected. Manufacturers must convey the financial and environmental benefits effectively to alleviate these concerns, ensuring broader market penetration.
Indonesia Solar Power Equipment Market Trends
Current trends shaping the Indonesia Solar Power Equipment Market include a shift towards more sophisticated solar panel technologies, which offer increased efficiency and durability. Moreover, the rise of integrated solar solutions, combining energy storage with photovoltaic systems, is gaining traction. As microgrid developments expand, there is an increasing focus on solar installations tailored for urban and rural applications, optimizing energy use and accessibility in diverse communities.
Indonesia Solar Power Equipment Market Opportunities
The most significant growth and investment opportunities in the Indonesia Solar Power Equipment Market lie in the distributed generation segment. As demand for localized energy solutions rises, vendors can capitalize on developing microgrid systems that are tailored to meet specific regional needs. Additionally, the push for environmentally friendly technologies opens avenues for innovations in solar materials and energy storage systems, further enhancing the attractiveness of this sector.
Government Initiatives in the Indonesia Solar Power Equipment Market
The Indonesian government is actively promoting renewable energy through various initiatives and policies aimed at increasing solar energy adoption. Programs like the GIZ Renewable Energy Support Program (RESP) illustrate a commitment to meeting renewable energy targets. Furthermore, local authorities are introducing financial incentives such as competitive Feed-in Tariffs (FIT) and Renewable Portfolio Standards (RPS) to stimulate investments in solar projects, aligning national energy goals with sustainable practices.
Future Insights of the Indonesia Solar Power Equipment Market
Looking ahead to 2026-2032, the Indonesia Solar Power Equipment Market is expected to experience dynamic growth driven by continuous technological innovation and supportive government policies. The increasing integration of solar energy into national grids and the expansion of microgrid initiatives will facilitate broader adoption. Furthermore, as awareness of environmental issues grows, more businesses and consumers are likely to transition towards sustainable energy solutions, propelling the market forward.
Indonesia Solar Power Equipment Market Latest Developments (2025 - 2026)
Recent developments in the Indonesia Solar Power Equipment Market reflect an ongoing commitment to enhancing renewable energy infrastructure. Local authorities are ramping up projects focused on microgrid development, which are crucial for rural electrification. Additionally, banks and financial institutions are increasingly offering tailored financing solutions to support solar investments, helping to mitigate the high upfront costs that have traditionally impeded market growth. These trends indicate a proactive approach towards building a more sustainable energy landscape in Indonesia.
Indonesia Solar Power Equipment Market - Key Attractiveness of the Report
- 10 Years of Market Numbers
- Historical Data Starting from 2022 to 2025
- Base Year: 2025
- Forecast Data until 2032
- Key Performance Indicators Impacting the Market
- Major Upcoming Developments and Projects
Key Highlights of the Report:
- Indonesia Solar Power Equipment Market Outlook
- Market Size of Indonesia Solar Power Equipment Market, 2025
- Forecast of Indonesia Solar Power Equipment Market, 2032
- Historical Data and Forecast of Indonesia Solar Power Equipment Revenues & Volume for the Period 2022-2032F
- Indonesia Solar Power Equipment Market Trend Evolution
- Indonesia Solar Power Equipment Market Drivers and Challenges
- Indonesia Solar Power Equipment Price Trends
- Indonesia Solar Power Equipment Porter's Five Forces
- Indonesia Solar Power Equipment Industry Life Cycle
- Historical Data and Forecast of Indonesia Solar Power Equipment Market Revenues & Volume By Equipment for the Period 2022-2032F
- Historical Data and Forecast of Indonesia Solar Power Equipment Market Revenues & Volume By Solar Panels for the Period 2022-2032F
- Historical Data and Forecast of Indonesia Solar Power Equipment Market Revenues & Volume By Mounting, Racking & Tracking System for the Period 2022-2032F
- Historical Data and Forecast of Indonesia Solar Power Equipment Market Revenues & Volume By Storage System for the Period 2022-2032F
- Historical Data and Forecast of Indonesia Solar Power Equipment Market Revenues & Volume By Others for the Period 2022-2032F
- Historical Data and Forecast of Indonesia Solar Power Equipment Market Revenues & Volume By Application for the Period 2022-2032F
- Historical Data and Forecast of Indonesia Solar Power Equipment Market Revenues & Volume By Residential for the Period 2022-2032F
- Historical Data and Forecast of Indonesia Solar Power Equipment Market Revenues & Volume By Nonresidential for the Period 2022-2032F
- Historical Data and Forecast of Indonesia Solar Power Equipment Market Revenues & Volume By Utility for the Period 2022-2032F
- Indonesia Solar Power Equipment Import Export Trade Statistics
- Market Opportunity Assessment By Equipment
- Market Opportunity Assessment By Application
- Indonesia Solar Power Equipment Top Companies Market Share
- Indonesia Solar Power Equipment Competitive Benchmarking By Technical and Operational Parameters
- Indonesia Solar Power Equipment Company Profiles
- Indonesia Solar Power Equipment Key Strategic Recommendations
Frequently Asked Questions About the Market Study (FAQs):
Key drivers include government incentives, consumer awareness regarding sustainability, and advancements in solar technology that enhance efficiency and reduce costs.
The market is projected to grow from USD 794 Million in 2025 to USD 1189 Million by 2032, with a CAGR of 5.9% during the period from 2026 to 2032, reflecting robust growth potential.
Manufacturers are grappling with the high initial costs of solar equipment, which can deter investment despite the potential long-term savings associated with solar power systems.
Solar power is increasingly being adopted across various sectors, including residential, commercial, and rural electrification projects, particularly where access to conventional electricity is limited.
The Indonesian government is implementing various policies and programs aimed at increasing solar energy adoption, such as the GIZ Renewable Energy Support Program, which establishes clear production targets and provides financial incentives for solar projects.
6Wresearch actively monitors the Indonesia Solar Power Equipment Market and publishes its comprehensive annual report, highlighting emerging trends, growth drivers, revenue analysis, and forecast outlook. Our insights help businesses to make data-backed strategic decisions with ongoing market dynamics. Our analysts track relevent industries related to the Indonesia Solar Power Equipment Market, allowing our clients with actionable intelligence and reliable forecasts tailored to emerging regional needs.
Yes, we provide customisation as per your requirements. To learn more, feel free to contact us on sales@6wresearch.com
1 Executive Summary |
2 Introduction |
2.1 Key Highlights of the Report |
2.2 Report Description |
2.3 Market Scope & Segmentation |
2.4 Research Methodology |
2.5 Assumptions |
3 Indonesia Solar Power Equipment Market Overview |
3.1 Indonesia Country Macro Economic Indicators |
3.2 Indonesia Solar Power Equipment Market Revenues & Volume, 2022 & 2032F |
3.3 Indonesia Solar Power Equipment Market - Industry Life Cycle |
3.4 Indonesia Solar Power Equipment Market - Porter's Five Forces |
3.5 Indonesia Solar Power Equipment Market Revenues & Volume Share, By Equipment, 2022 & 2032F |
3.6 Indonesia Solar Power Equipment Market Revenues & Volume Share, By Application, 2022 & 2032F |
4 Indonesia Solar Power Equipment Market Dynamics |
4.1 Impact Analysis |
4.2 Market Drivers |
4.2.1 Government initiatives and incentives to promote renewable energy adoption |
4.2.2 Increasing awareness and concern for environmental sustainability |
4.2.3 Growing demand for reliable and affordable energy sources |
4.3 Market Restraints |
4.3.1 High initial investment costs of solar power equipment |
4.3.2 Lack of adequate infrastructure for solar power integration |
4.3.3 Limited access to financing options for solar power projects |
5 Indonesia Solar Power Equipment Market Trends |
6 Indonesia Solar Power Equipment Market, By Types |
6.1 Indonesia Solar Power Equipment Market, By Equipment |
6.1.1 Overview and Analysis |
6.1.2 Indonesia Solar Power Equipment Market Revenues & Volume, By Equipment, 2022-2032F |
6.1.3 Indonesia Solar Power Equipment Market Revenues & Volume, By Solar Panels, 2022-2032F |
6.1.4 Indonesia Solar Power Equipment Market Revenues & Volume, By Mounting, Racking & Tracking System, 2022-2032F |
6.1.5 Indonesia Solar Power Equipment Market Revenues & Volume, By Storage System, 2022-2032F |
6.1.6 Indonesia Solar Power Equipment Market Revenues & Volume, By Others, 2022-2032F |
6.2 Indonesia Solar Power Equipment Market, By Application |
6.2.1 Overview and Analysis |
6.2.2 Indonesia Solar Power Equipment Market Revenues & Volume, By Residential, 2022-2032F |
6.2.3 Indonesia Solar Power Equipment Market Revenues & Volume, By Nonresidential, 2022-2032F |
6.2.4 Indonesia Solar Power Equipment Market Revenues & Volume, By Utility, 2022-2032F |
7 Indonesia Solar Power Equipment Market Import-Export Trade Statistics |
7.1 Indonesia Solar Power Equipment Market Export to Major Countries |
7.2 Indonesia Solar Power Equipment Market Imports from Major Countries |
8 Indonesia Solar Power Equipment Market Key Performance Indicators |
8.1 Average cost per watt of solar power equipment |
8.2 Number of government policies and incentives supporting solar power adoption |
8.3 Percentage of energy consumption in Indonesia met by solar power |
8.4 Number of solar power projects in development or operational |
8.5 Rate of growth in solar power capacity installed in Indonesia |
9 Indonesia Solar Power Equipment Market - Opportunity Assessment |
9.1 Indonesia Solar Power Equipment Market Opportunity Assessment, By Equipment, 2022 & 2032F |
9.2 Indonesia Solar Power Equipment Market Opportunity Assessment, By Application, 2022 & 2032F |
10 Indonesia Solar Power Equipment Market - Competitive Landscape |
10.1 Indonesia Solar Power Equipment Market Revenue Share, By Companies, 2025 |
10.2 Indonesia Solar Power Equipment Market Competitive Benchmarking, By Operating and Technical Parameters |
11 Company Profiles |
12 Recommendations |
13 Disclaimer |
Global Go To Market Strategy - 2030
Export potential enables firms to identify high-growth global markets with greater confidence by combining advanced trade intelligence with a structured quantitative methodology. The framework analyzes emerging demand trends and country-level import patterns while integrating macroeconomic and trade datasets such as GDP and population forecasts, bilateral import–export flows, tariff structures, elasticity differentials between developed and developing economies, geographic distance, and import demand projections. Using weighted trade values from 2020–2024 as the base period to project country-to-country export potential for 2030, these inputs are operationalized through calculated drivers such as gravity model parameters, tariff impact factors, and projected GDP per-capita growth. Through an analysis of hidden potentials, demand hotspots, and market conditions that are most favorable to success, this method enables firms to focus on target countries, maximize returns, and global expansion with data, backed by accuracy.
By factoring in the projected importer demand gap that is currently unmet and could be potential opportunity, it identifies the potential for the Exporter (Country) among 190 countries, against the general trade analysis, which identifies the biggest importer or exporter.
To discover high-growth global markets and optimize your business strategy:
Click Here
Pricing
- Single User License$ 1,995
- Department License$ 2,400
- Site License$ 3,120
- Global License$ 3,795

Leadership Perspectives from Industry Events
Search
Thought Leadership and Analyst Meet


Our Clients
6WResearch In News
- India Air Conditioner Market Set for Strong Rebound in 2026 After Weather-Led Correction and GST-Driven Recovery: 6Wresearch
- ADAS in India: How Automatic Emergency Braking, Blind Spot Detection & Driver Monitoring are Transforming Road Safety
- Doha a strategic location for EV manufacturing hub: IPA Qatar
- Demand for luxury TVs surging in the GCC, says Samsung
- Empowering Growth: The Thriving Journey of Bangladesh’s Cable Industry
- Demand for luxury TVs surging in the GCC, says Samsung
Latest Reports
- Nicaragua RPG Gaming Market (2026-2032)
- New Zealand RPG Gaming Market (2026-2032)
- Netherlands RPG Gaming Market (2026-2032)
- Nauru RPG Gaming Market (2026-2032)
- Namibia RPG Gaming Market (2026-2032)
- Mozambique RPG Gaming Market (2026-2032)
- Montenegro RPG Gaming Market (2026-2032)
- Mongolia RPG Gaming Market (2026-2032)
- Monaco RPG Gaming Market (2026-2032)
- Micronesia RPG Gaming Market (2026-2032)
Industry Events and Analyst Meet

EV India Expo 2026

HIMTEX 2026

India Refining Summit 2026

India EV Show 2026

EV tech India Expo 2026
Whitepaper
- Middle East & Africa Commercial Security Market Click here to view more.
- Middle East & Africa Fire Safety Systems & Equipment Market Click here to view more.
- GCC Drone Market Click here to view more.
- Middle East Lighting Fixture Market Click here to view more.
- GCC Physical & Perimeter Security Market Click here to view more.