Indonesia Tea Market (2026-2032) | Share, Revenue, Outlook, Industry, Size, Analysis, Forecast, Trends, Value, Growth & Companies
Market Forecast By Type (Green Tea, Black Tea, Oolong Tea, Fruit/Herbal Tea, Others), By Packaging (Plastic Containers, Loose Tea, Paperboards, Aluminum Tins, Tea Bags), By Distribution Channel (Supermarkets/Hypermarkets, Specialty Stores, Convenience Stores, Online Stores, Others), By Application (Residential, Commercial) And Competitive Landscape
| Product Code: ETC178247 | Publication Date: Jul 2023 | Updated Date: Mar 2026 | Product Type: Market Research Report | |
| Publisher: 6Wresearch | Author: Ravi Bhandari | No. of Pages: 70 | No. of Figures: 35 | No. of Tables: 5 |
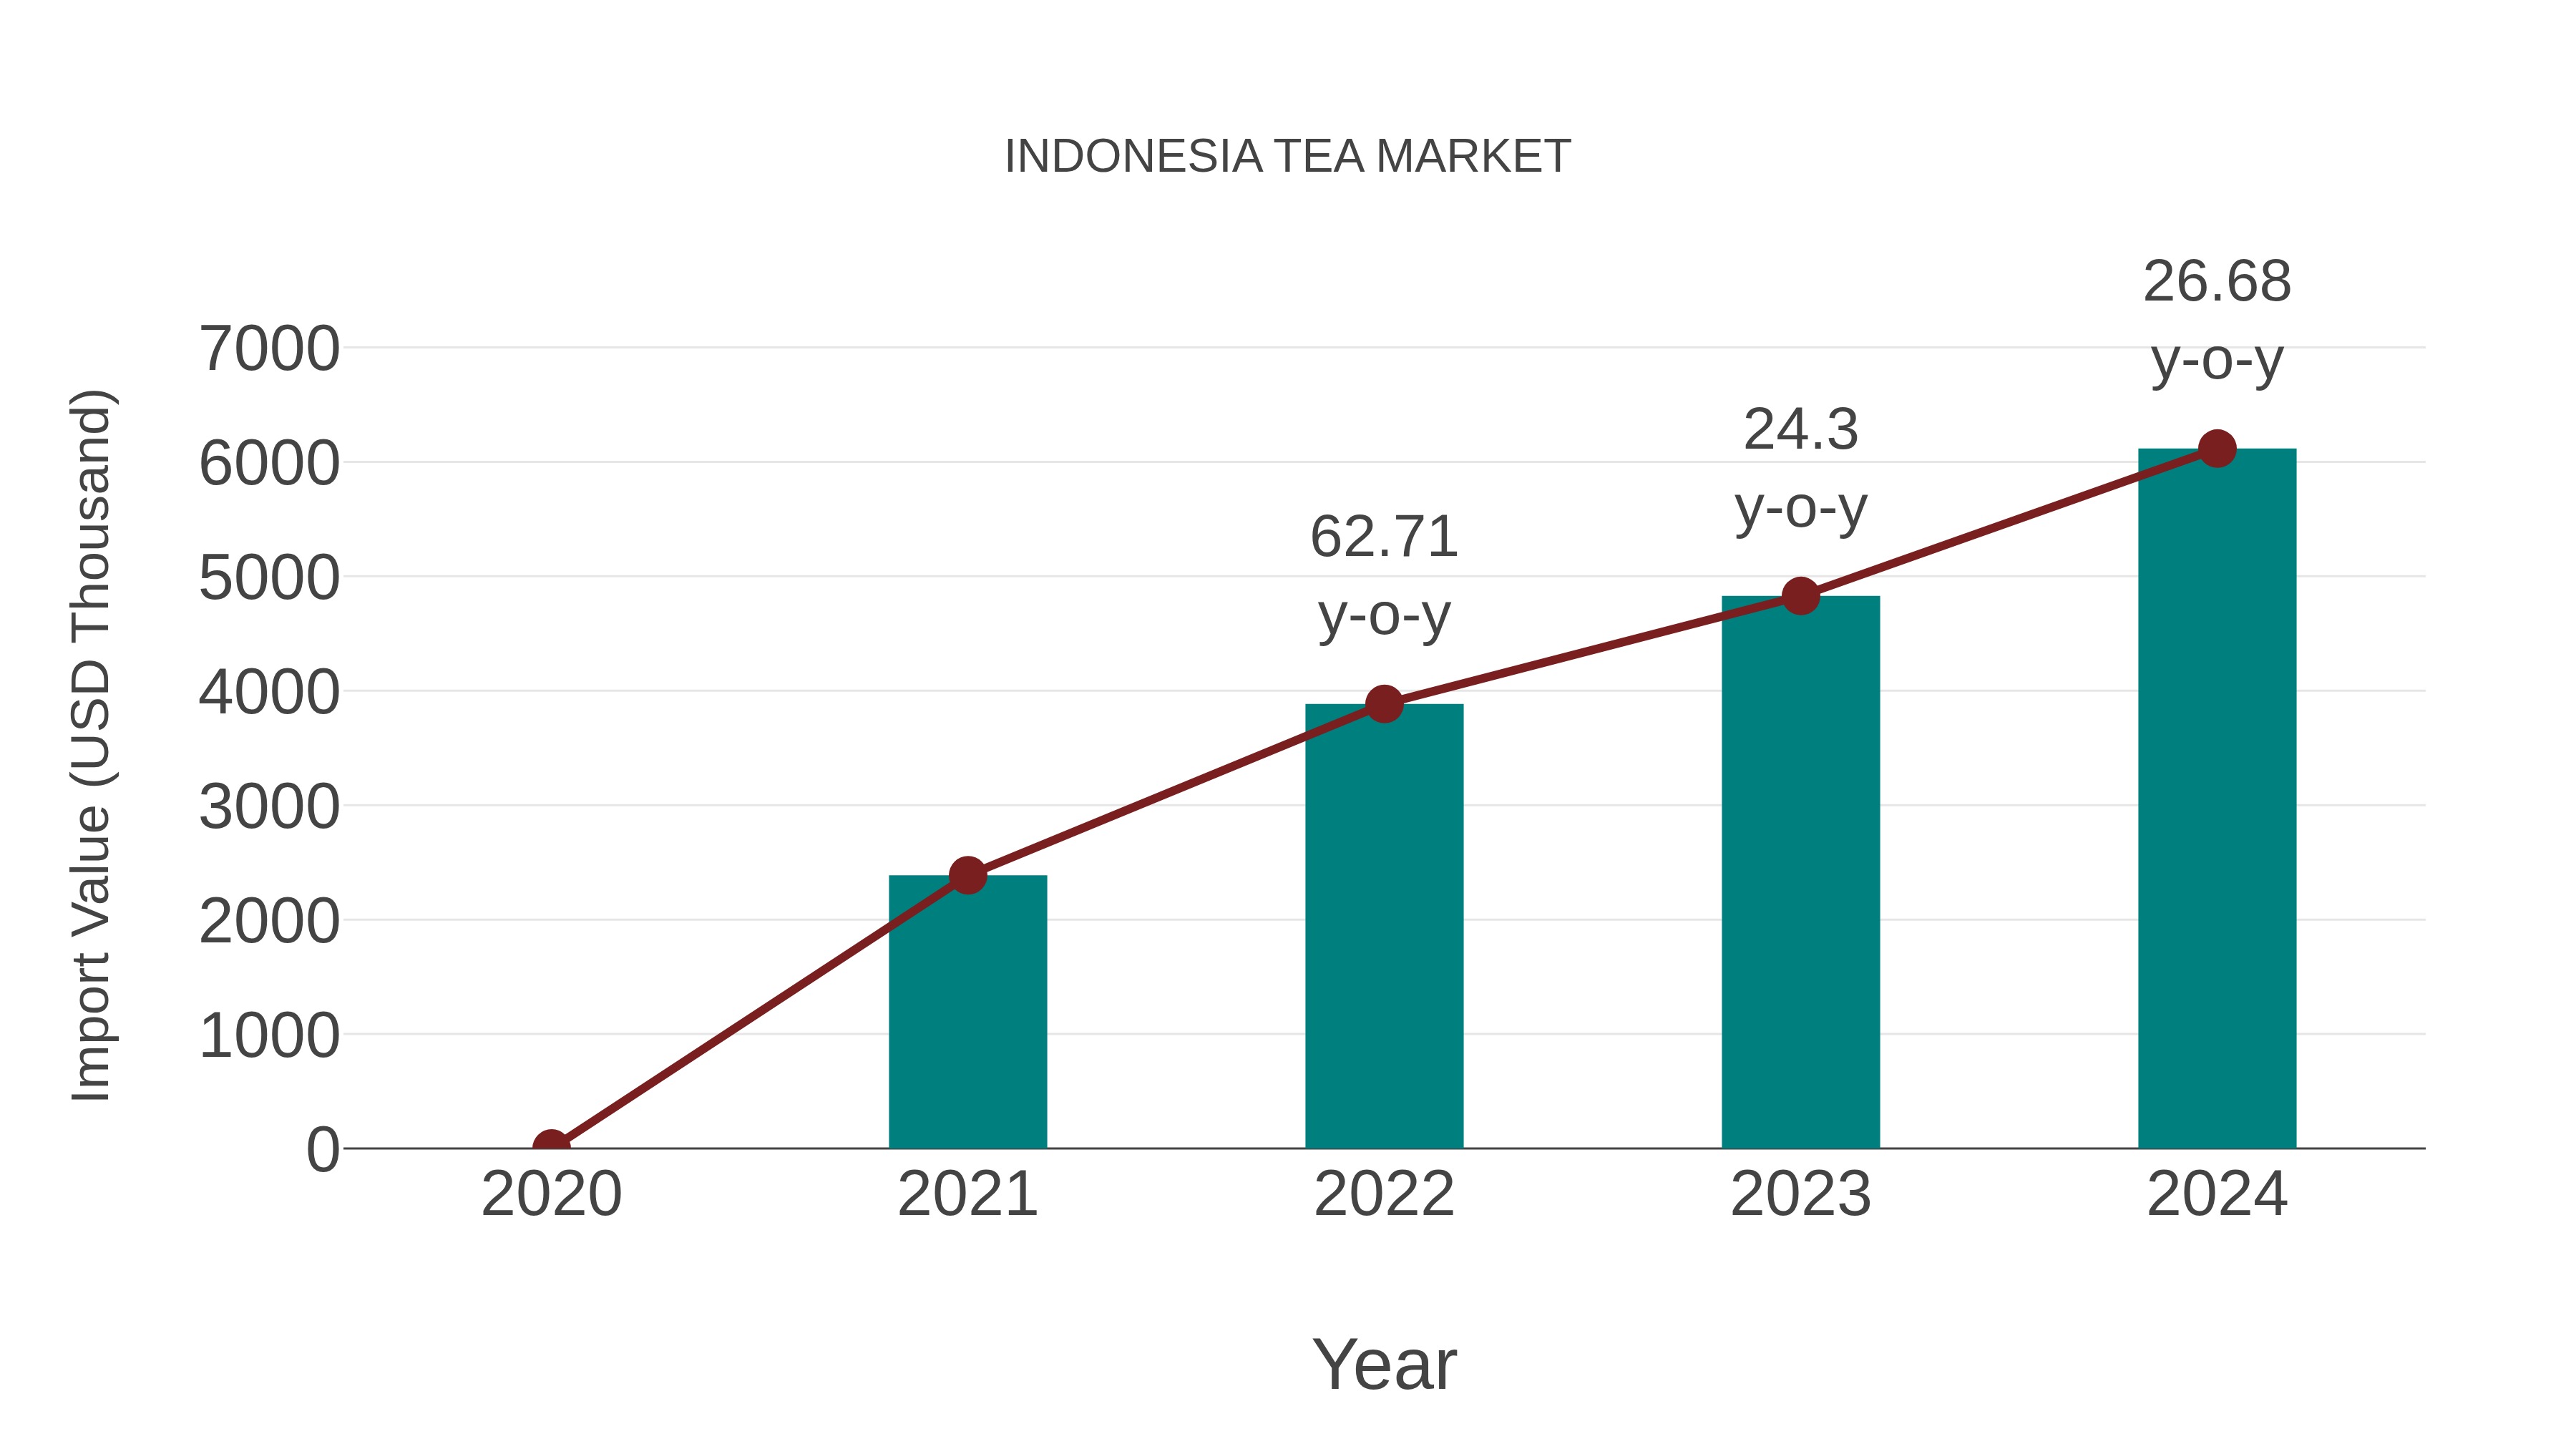
Indonesia Tea Market: Import Trend Analysis
In the Indonesia tea market, the import trend exhibited strong growth from 2023 to 2024, with a notable increase of 26.68%. The compound annual growth rate (CAGR) from 2020 to 2024 stood at 36.84%. This surge in imports could be attributed to shifting consumer preferences towards premium tea varieties, indicating a potential increase in market demand and consumption patterns during this period.
Indonesia Tea Market Growth Rate
According to 6Wresearch internal database and industry insights, the Indonesia Tea Market is projected to grow at a compound annual growth rate (CAGR) of 5.8% during the forecast period (2026-2032).
Topics Covered in the Indonesia Tea Market Report
The Indonesia Tea Market report thoroughly covers the market by type, packaging, distribution channel and application. The market report provides an unbiased and detailed analysis of ongoing market trends, opportunities/high growth areas, and market drivers, which help stakeholders devise and align their market strategies according to the current and future market dynamics.
Indonesia Tea Market Highlights
| Report Name | Indonesia Tea Market |
| Forecast Period | 2026–2032 |
| CAGR | 5.8% |
| Growing Sector | Supermarkets/Hypermarkets |
Indonesia Tea Market Synopsis
Indonesia Tea Market is anticipated to experience stable growth over the coming years due to rising domestic consumption of traditional beverages, expanding product innovation in flavored and herbal tea varieties, and increasing distribution through organized retail channels. The country has a strong cultural association with tea drinking, which continues to support demand across both residential and commercial applications. In addition, local producers are gradually introducing premium and health-focused tea blends to cater to changing consumer preferences toward wellness beverages. Furthermore, improving packaging technologies and expanding supermarket networks across urban and semi-urban regions are encouraging consumers to purchase branded tea products, thereby strengthening market expansion.
Evaluation of Growth Drivers in the Indonesia Tea Market
Below mentioned are some prominent drivers and their influence on the market dynamics:
| Drivers | Primary Segments Affected | Why it Matters (Evidence) |
| Rising Domestic Tea Consumption | Green & Black Tea, Residential | Traditional tea drinking culture drives strong household demand across the country. |
| Expansion of Organized Retail | All Types, Supermarkets | More shelf space for branded premium tea products in retail chains. |
| Increasing Demand for Herbal Beverages | Fruit/Herbal Tea, Residential & Commercial | Consumers prefer wellness drinks that have health benefits. |
| Growth of Tea Cafés and Specialty Stores | Oolong & Premium Tea, Specialty Stores | Café culture encourages premium tea experiences and product diversity. |
| Innovation in Packaging Technology | Tea Bags & Aluminum Tins, All Channels | Technological innovation in tea packaging increases the visibility of the product. |
Indonesia Tea Market is expected to grow at the CAGR of 5.8% during the forecast period of 2026-2032. One of the major factors that contribute to this market is the increase in the preference of consumers to choose healthy drinks, such as herbal or organic tea, as opposed to other caffeinated drinks, including coffee or other soft drinks. This is due to the perceived health benefits and the affordability of this alternative compared to other exotic drinks that consumers can enjoy. Moreover, Indonesia has beautiful tea estates and plantations that have become popular destinations, hence boosting the economy as people go to visit and learn about tea. International trade agreements and partnerships are another important aspect that affects the Indonesia tea market growth.
Evaluation of Restraints in the Indonesia Tea Market
Below mentioned are some major restraints and their influence on the market dynamics:
| Restraints | Primary Segments Affected | What This Means (Evidence) |
| Fluctuating Tea Leaf Production | Green & Black Tea, Producers | Weather variations influence raw material supply and price stability. |
| Rising Competition from Coffee | All Types, Commercial | Expanding café culture shifts consumer attention toward coffee beverages. |
| Price Sensitivity Among Consumers | Loose Tea & Plastic Containers | Lower-income households prefer cheaper unbranded tea alternatives. |
| Limited Product Differentiation | All Types, Retail Channels | Similar product offerings reduce brand differentiation. |
| Distribution Challenges in Remote Areas | All Types, Convenience Stores | Logistics limitations affect product availability outside urban markets. |
Indonesia Tea Market Challenges
Despite the presence of considerable growth prospects, there are a number of challenges faced by the Indonesia Tea Industry, which affects the overall Indonesia Tea Market Share. For instance, there are fluctuations in the production of tea leaves due to changing climatic conditions and plantation yields. Furthermore, the growing demand for coffee-based products and other ready-to-drink beverages is gradually shifting consumer preferences away from traditional tea consumption. Additionally, price sensitivity among a large portion of the population is increasing the demand for unbranded loose tea products, which acts as a restraint for organized market players. Distribution also remains a major challenge, as companies often face difficulties in reaching remote and rural areas effectively.
Indonesia Tea Market Trends
The key emerging trends in the Indonesia Tea Market are as follows:
- Health-Focused Herbal Tea Growth: There is a growing demand for fruit-infused and herbal teas as people are increasingly turning to these drinks for their potential health benefits.
- Premium Tea Brand Creation: There are several tea companies in Indonesia that are creating specialty teas and offering them to urban consumers.
- Increasing Demand for Ready to Brew Tea Bags: The hectic lifestyle of people is forcing them to adopt ready-to-drink tea bags and ready-to-brew tea products.
- Digital Retail Growth of Tea Products: The rise of online shopping and e-commerce sites is also increasing in Indonesia, which will provide customers with access to a variety of tea brands and varieties.
Investment Opportunities in the Indonesia Tea Market
Major investment opportunities emerging within the Indonesia Tea Market include:
- Premium Tea Processing Facilities – Establishing modern processing units to produce high-quality specialty tea for domestic and export markets.
- Herbal and Functional Tea Product Development – Investing in innovative tea blends containing herbs, fruits, and botanical ingredients targeting health-conscious consumers.
- Tea Café and Experience Centers – Launching premium tea cafés that promote specialty tea tasting and retail sales.
- E-commerce Tea Distribution Platforms – Creating digital retail channels for direct-to-consumer tea sales across Indonesia.
Top 5 Leading Players in the Indonesia Tea Market
Some prominent companies actively operating in the Indonesia Tea Market include:
1. Unilever Indonesia (SariWangi)
| Company Name | Unilever Indonesia |
|---|---|
| Established | 1933 |
| Headquarters | Jakarta, Indonesia |
| Official Website | Click Here |
Unilever Indonesia produces the well-known SariWangi tea brand, which is widely consumed in Indonesian households. The company offers packaged tea bags and flavored tea varieties while leveraging its strong retail distribution network to maintain a leading position in Indonesia’s domestic tea beverage market.
2. PT Perkebunan Nusantara (PTPN)
| Company Name | PT Perkebunan Nusantara (PTPN) |
|---|---|
| Established | 1996 |
| Headquarters | Jakarta, Indonesia |
| Official Website | Click Here |
PT Perkebunan Nusantara manages extensive tea plantations across Indonesia and produces a range of black and green tea products for domestic consumption and exports. The company plays a crucial role in supporting the country’s tea cultivation and large-scale agricultural production.
3. Tong Tji Tea
| Company Name | Tong Tji Tea |
|---|---|
| Established | 1938 |
| Headquarters | Tegal, Indonesia |
| Official Website | - |
Tong Tji Tea provides traditional Indonesian tea products including loose-leaf tea and packaged tea bags. The company has also expanded into café outlets that promote premium tea experiences, helping strengthen its brand presence in both retail and hospitality sectors.
4. Mayora Indah Tbk
| Company Name | Mayora Indah Tbk |
|---|---|
| Established | 1977 |
| Headquarters | Jakarta, Indonesia |
| Official Website | Click Here |
Mayora Indah produces a variety of packaged beverage products including tea-based drinks and ready-to-drink teas. The company benefits from strong manufacturing capabilities and an extensive distribution network across supermarkets, convenience stores, and retail outlets throughout Indonesia.
5. Sosro Group
| Company Name | Sosro Group |
|---|---|
| Established | 1940 |
| Headquarters | Jakarta, Indonesia |
| Official Website | Click Here |
Sosro Group is widely recognized for its tea-based beverages and ready-to-drink tea products. The company combines traditional Indonesian tea heritage with modern beverage processing to deliver popular packaged tea brands across domestic and international markets.
Government Regulations Introduced in the Indonesia Tea Market
According to Indonesian Government Data, Various initiatives have been undertaken to enhance the agricultural and beverage industries, including those related to tea production and distribution. The Ministry of Agriculture launched the National Tea Revitalization Program in 2018, which targets improving the productivity of tea plantations, assisting tea farmers in improving cultivation methods, and improving tea processing facilities. Besides, the Indonesian government is committed to assisting small-scale tea farmers through agricultural development schemes, including those related to tea exports. On the other hand, the Ministry of Trade has encouraged the production of value-added tea products, thus improving the competitiveness of tea in the local and international markets. Besides, the government has partnered with agricultural cooperatives aimed at improving stability in tea supply and promoting sustainable cultivation practices in major tea-producing regions.
Future Insights of the Indonesia Tea Market
Indonesia Tea Market is expected to experience a moderate pace of expansion owing to the growing demand for natural drinks, the increasing popularity of premium tea blends, and the improvement in retail infrastructure. Urbanization trends and changes in eating habits are prompting consumers to seek specialty teas like herbal, fruit-infused drinks, and health drinks. In addition, investments in tea plantation efficiency and processing technology will have a favorable impact on product quality and the domestic supply chain. The expansion of digital retail platforms will provide a wider reach for the market, allowing tea manufacturers to tap into the younger demographic and urban population, thus cementing the long-term prospects for the Indonesia Tea Market.
Market Segmentation Analysis
Black Tea to Dominate the Market – By Type
According to Asmita, Senior Research Analyst, 6Wresearch, Black Tea is expected to have the largest market share in the Indonesia Tea Market, as this variant has been in high demand and consumption for a long period in Indonesia. The demand for Black Tea in Indonesia has been high, and people in Indonesia have always been inclined towards Black Tea due to its high taste quotient and the fact that Black Tea can be consumed both in hot form and ready-to-drink form. The presence of a high volume of Black Tea plantations in areas such as West Java and Central Java also supports this variant, along with the fact that most tea brands in Indonesia have Black Tea in their portfolio in the form of tea bags and loose leaves, and Black Tea is also commonly found in cafes and restaurants in the form of a drink.
Residential Segment to Dominate the Market – By Application
The Residential segment is expected to hold the largest share in the Indonesia Tea Market as tea is considered to be one of the most popular beverages in Indonesian households. Tea is considered to be an integral part of daily meals as well as family gatherings. Tea is enjoyed by people of different ages as it is considered to be an integral part of daily life. In addition to this, the increasing availability of herbal as well as flavored tea in the market via supermarkets as well as online platforms is motivating residents to try different types of tea.
Key Attractiveness of the Report
- 10 Years of Market Numbers.
- Historical Data Starting from 2022 to 2025.
- Base Year: 2025.
- Forecast Data until 2032.
- Key Performance Indicators Impacting the Market.
- Major Upcoming Developments and Projects.
Key Highlights of the Report:
- Indonesia Tea Market Outlook
- Market Size of Indonesia Tea Market, 2025
- Forecast of Indonesia Tea Market, 2032
- Historical Data and Forecast of Indonesia Tea Revenues & Volume for the Period 2022-2032F
- Indonesia Tea Market Trend Evolution
- Indonesia Tea Market Drivers and Challenges
- Indonesia Tea Price Trends
- Indonesia Tea Porter's Five Forces
- Indonesia Tea Industry Life Cycle
- Historical Data and Forecast of Indonesia Tea Market Revenues & Volume By Type for the Period 2022-2032F
- Historical Data and Forecast of Indonesia Tea Market Revenues & Volume By Green Tea for the Period 2022-2032F
- Historical Data and Forecast of Indonesia Tea Market Revenues & Volume By Black Tea for the Period 2022-2032F
- Historical Data and Forecast of Indonesia Tea Market Revenues & Volume By Oolong Tea for the Period 2022-2032F
- Historical Data and Forecast of Indonesia Tea Market Revenues & Volume By Fruit/Herbal Tea for the Period 2022-2032F
- Historical Data and Forecast of Indonesia Tea Market Revenues & Volume By Others for the Period 2022-2032F
- Historical Data and Forecast of Indonesia Tea Market Revenues & Volume By Packaging for the Period 2022-2032F
- Historical Data and Forecast of Indonesia Tea Market Revenues & Volume By Plastic Containers for the Period 2022-2032F
- Historical Data and Forecast of Indonesia Tea Market Revenues & Volume By Loose Tea for the Period 2022-2032F
- Historical Data and Forecast of Indonesia Tea Market Revenues & Volume By Paperboards for the Period 2022-2032F
- Historical Data and Forecast of Indonesia Tea Market Revenues & Volume By Aluminum Tins for the Period 2022-2032F
- Historical Data and Forecast of Indonesia Tea Market Revenues & Volume By Tea Bags for the Period 2022-2032F
- Historical Data and Forecast of Indonesia Tea Market Revenues & Volume By Distribution Channel for the Period 2022-2032F
- Historical Data and Forecast of Indonesia Tea Market Revenues & Volume By Supermarkets/Hypermarkets for the Period 2022-2032F
- Historical Data and Forecast of Indonesia Tea Market Revenues & Volume By Specialty Stores for the Period 2022-2032F
- Historical Data and Forecast of Indonesia Tea Market Revenues & Volume By Convenience Stores for the Period 2022-2032F
- Historical Data and Forecast of Indonesia Tea Market Revenues & Volume By Online Stores for the Period 2022-2032F
- Historical Data and Forecast of Indonesia Tea Market Revenues & Volume By Others for the Period 2022-2032F
- Historical Data and Forecast of Indonesia Tea Market Revenues & Volume By Application for the Period 2022-2032F
- Historical Data and Forecast of Indonesia Tea Market Revenues & Volume By Residential for the Period 2022-2032F
- Historical Data and Forecast of Indonesia Tea Market Revenues & Volume By Commercial for the Period 2022-2032F
- Indonesia Tea Import Export Trade Statistics
- Market Opportunity Assessment By Type
- Market Opportunity Assessment By Packaging
- Market Opportunity Assessment By Distribution Channel
- Market Opportunity Assessment By Application
- Indonesia Tea Top Companies Market Share
- Indonesia Tea Competitive Benchmarking By Technical and Operational Parameters
- Indonesia Tea Company Profiles
- Indonesia Tea Key Strategic Recommendations
Market Scope and Segmentation
The report provides a detailed analysis of the following market segments:
By Type
- Green Tea
- Black Tea
- Oolong Tea
- Fruit/Herbal Tea
- Others
By Packaging
- Plastic Containers
- Loose Tea
- Paperboards
- Aluminum Tins
- Tea Bags
By Distribution Channel
- Supermarkets/Hypermarkets
- Specialty Stores
- Convenience Stores
- Online Stores
- Others
By Application
- Residential
- Commercial
Indonesia Tea Market (2026-2032): FAQs
Indonesia Tea Market is expected to expand steadily with increasing domestic consumption, wider retail availability, and rising demand for herbal and specialty tea varieties across the country.
The Indonesia Tea Market is expected to grow at a CAGR of 5.8% from 2026-2032.
Major companies operating in the Indonesia Tea Market include Unilever Indonesia (SariWangi), PT Perkebunan Nusantara, Tong Tji Tea Indonesia, Mayora Indah Tbk, and Sosro Group, which contribute to the growth of the market with innovative products and expansion of distribution channels.
Increasing demand for herbal tea beverages, premium tea blends, and digital retailing of tea products are the major trends operating in the Indonesia Tea Market.
6Wresearch actively monitors the Indonesia Tea Market and publishes its comprehensive annual report, highlighting emerging trends, growth drivers, revenue analysis, and forecast outlook. Our insights help businesses to make data-backed strategic decisions with ongoing market dynamics. Our analysts track relevent industries related to the Indonesia Tea Market, allowing our clients with actionable intelligence and reliable forecasts tailored to emerging regional needs.
Yes, we provide customisation as per your requirements. To learn more, feel free to contact us on sales@6wresearch.com
| 1 Executive Summary |
| 2 Introduction |
| 2.1 Key Highlights of the Report |
| 2.2 Report Description |
| 2.3 Market Scope & Segmentation |
| 2.4 Research Methodology |
| 2.5 Assumptions |
| 3 Indonesia Tea Market Overview |
| 3.1 Indonesia Country Macro Economic Indicators |
| 3.2 Indonesia Tea Market Revenues & Volume, 2022 & 2032F |
| 3.3 Indonesia Tea Market - Industry Life Cycle |
| 3.4 Indonesia Tea Market - Porter's Five Forces |
| 3.5 Indonesia Tea Market Revenues & Volume Share, By Type, 2022 & 2032F |
| 3.6 Indonesia Tea Market Revenues & Volume Share, By Packaging, 2022 & 2032F |
| 3.7 Indonesia Tea Market Revenues & Volume Share, By Distribution Channel, 2022 & 2032F |
| 3.8 Indonesia Tea Market Revenues & Volume Share, By Application, 2022 & 2032F |
| 4 Indonesia Tea Market Dynamics |
| 4.1 Impact Analysis |
| 4.2 Market Drivers |
| 4.2.1 Increasing health awareness and demand for natural and organic products |
| 4.2.2 Growing popularity of tea as a functional beverage with various health benefits |
| 4.2.3 Rise in disposable income leading to higher spending on premium tea products |
| 4.3 Market Restraints |
| 4.3.1 Competition from other beverages like coffee, juices, and soft drinks |
| 4.3.2 Fluctuating prices of raw materials and impact of weather conditions on tea production |
| 5 Indonesia Tea Market Trends |
| 6 Indonesia Tea Market, By Types |
| 6.1 Indonesia Tea Market, By Type |
| 6.1.1 Overview and Analysis |
| 6.1.2 Indonesia Tea Market Revenues & Volume, By Type, 2022-2032F |
| 6.1.3 Indonesia Tea Market Revenues & Volume, By Green Tea, 2022-2032F |
| 6.1.4 Indonesia Tea Market Revenues & Volume, By Black Tea, 2022-2032F |
| 6.1.5 Indonesia Tea Market Revenues & Volume, By Oolong Tea, 2022-2032F |
| 6.1.6 Indonesia Tea Market Revenues & Volume, By Fruit/Herbal Tea, 2022-2032F |
| 6.1.7 Indonesia Tea Market Revenues & Volume, By Others, 2022-2032F |
| 6.2 Indonesia Tea Market, By Packaging |
| 6.2.1 Overview and Analysis |
| 6.2.2 Indonesia Tea Market Revenues & Volume, By Plastic Containers, 2022-2032F |
| 6.2.3 Indonesia Tea Market Revenues & Volume, By Loose Tea, 2022-2032F |
| 6.2.4 Indonesia Tea Market Revenues & Volume, By Paperboards, 2022-2032F |
| 6.2.5 Indonesia Tea Market Revenues & Volume, By Aluminum Tins, 2022-2032F |
| 6.2.6 Indonesia Tea Market Revenues & Volume, By Tea Bags, 2022-2032F |
| 6.3 Indonesia Tea Market, By Distribution Channel |
| 6.3.1 Overview and Analysis |
| 6.3.2 Indonesia Tea Market Revenues & Volume, By Supermarkets/Hypermarkets, 2022-2032F |
| 6.3.3 Indonesia Tea Market Revenues & Volume, By Specialty Stores, 2022-2032F |
| 6.3.4 Indonesia Tea Market Revenues & Volume, By Convenience Stores, 2022-2032F |
| 6.3.5 Indonesia Tea Market Revenues & Volume, By Online Stores, 2022-2032F |
| 6.3.6 Indonesia Tea Market Revenues & Volume, By Others, 2022-2032F |
| 6.4 Indonesia Tea Market, By Application |
| 6.4.1 Overview and Analysis |
| 6.4.2 Indonesia Tea Market Revenues & Volume, By Residential, 2022-2032F |
| 6.4.3 Indonesia Tea Market Revenues & Volume, By Commercial, 2022-2032F |
| 7 Indonesia Tea Market Import-Export Trade Statistics |
| 7.1 Indonesia Tea Market Export to Major Countries |
| 7.2 Indonesia Tea Market Imports from Major Countries |
| 8 Indonesia Tea Market Key Performance Indicators |
| 8.1 Consumer engagement through social media platforms |
| 8.2 Number of tea tasting events or workshops conducted |
| 8.3 Percentage increase in online tea sales volume |
| 8.4 Growth in the number of tea cafes or specialty tea shops |
| 8.5 Customer satisfaction ratings for tea quality and variety |
| 9 Indonesia Tea Market - Opportunity Assessment |
| 9.1 Indonesia Tea Market Opportunity Assessment, By Type, 2022 & 2032F |
| 9.2 Indonesia Tea Market Opportunity Assessment, By Packaging, 2022 & 2032F |
| 9.3 Indonesia Tea Market Opportunity Assessment, By Distribution Channel, 2022 & 2032F |
| 9.4 Indonesia Tea Market Opportunity Assessment, By Application, 2022 & 2032F |
| 10 Indonesia Tea Market - Competitive Landscape |
| 10.1 Indonesia Tea Market Revenue Share, By Companies, 2025 |
| 10.2 Indonesia Tea Market Competitive Benchmarking, By Operating and Technical Parameters |
| 11 Company Profiles |
| 12 Recommendations |
| 13 Disclaimer |
Export potential assessment - trade Analytics for 2030
Export potential enables firms to identify high-growth global markets with greater confidence by combining advanced trade intelligence with a structured quantitative methodology. The framework analyzes emerging demand trends and country-level import patterns while integrating macroeconomic and trade datasets such as GDP and population forecasts, bilateral import–export flows, tariff structures, elasticity differentials between developed and developing economies, geographic distance, and import demand projections. Using weighted trade values from 2020–2024 as the base period to project country-to-country export potential for 2030, these inputs are operationalized through calculated drivers such as gravity model parameters, tariff impact factors, and projected GDP per-capita growth. Through an analysis of hidden potentials, demand hotspots, and market conditions that are most favorable to success, this method enables firms to focus on target countries, maximize returns, and global expansion with data, backed by accuracy.
By factoring in the projected importer demand gap that is currently unmet and could be potential opportunity, it identifies the potential for the Exporter (Country) among 190 countries, against the general trade analysis, which identifies the biggest importer or exporter.
To discover high-growth global markets and optimize your business strategy:
Click Here
Pricing
- Single User License$ 1,995
- Department License$ 2,400
- Site License$ 3,120
- Global License$ 3,795

Search
Thought Leadership and Analyst Meet


Our Clients
Latest Reports
- France Thermally Conductive Filler Dispersants Market (2026-2032) | Challenges, Restraints, Value, Share, Size, segmentation, Analysis, Trends, Investment Opportunities, Outlook, Pricing, Demand, Forecast, Revenue, Companies, Growth, Drivers, Strategy, Insights, Competition
- Egypt Thermally Conductive Filler Dispersants Market (2026-2032) | Competition, Forecast, Strategy, Value, Insights, Outlook, Investment Opportunities, Pricing, Demand, Share, segmentation, Drivers, Size, Companies, Restraints, Growth, Trends, Revenue, Challenges, Analysis
- Czech Republic Thermally Conductive Filler Dispersants Market (2026-2032) | Forecast, Pricing, Analysis, Drivers, Insights, Size, Demand, Growth, Challenges, segmentation, Competition, Outlook, Trends, Investment Opportunities, Companies, Strategy, Revenue, Share, Value, Restraints
- Colombia Thermally Conductive Filler Dispersants Market (2026-2032) | segmentation, Trends, Share, Drivers, Strategy, Companies, Demand, Insights, Size, Challenges, Value, Competition, Analysis, Growth, Revenue, Restraints, Forecast, Pricing, Outlook, Investment Opportunities
- China Thermally Conductive Filler Dispersants Market (2026-2032) | Restraints, Investment Opportunities, Pricing, Companies, Share, Size, Challenges, Trends, Outlook, Value, Analysis, Competition, Revenue, Drivers, Forecast, Demand, Insights, Growth, Strategy, segmentation
- Chile Thermally Conductive Filler Dispersants Market (2026-2032) | Investment Opportunities, Trends, Value, Restraints, Share, Companies, Forecast, segmentation, Pricing, Challenges, Demand, Size, Analysis, Drivers, Outlook, Growth, Competition, Strategy, Revenue, Insights
- Cambodia Thermally Conductive Filler Dispersants Market (2026-2032) | Analysis, Share, Outlook, Strategy, Pricing, Demand, Size, Growth, segmentation, Insights, Revenue, Forecast, Challenges, Competition, Companies, Investment Opportunities, Trends, Restraints, Value, Drivers
- Brazil Thermally Conductive Filler Dispersants Market (2026-2032) | Restraints, Forecast, Competition, Size, Revenue, Value, Investment Opportunities, Trends, Insights, Outlook, Growth, Analysis, Drivers, segmentation, Pricing, Challenges, Strategy, Share, Companies, Demand
- Bangladesh Thermally Conductive Filler Dispersants Market (2026-2032) | Restraints, Trends, Analysis, Competition, Insights, Forecast, Value, Investment Opportunities, Pricing, Share, Demand, Outlook, Revenue, segmentation, Companies, Drivers, Growth, Size, Challenges, Strategy
- Bahrain Thermally Conductive Filler Dispersants Market (2026-2032) | Trends, Outlook, Pricing, Demand, Value, Competition, Forecast, Growth, segmentation, Revenue, Companies, Analysis, Insights, Size, Drivers, Challenges, Strategy, Investment Opportunities, Share, Restraints
Industry Events and Analyst Meet

HIMTEX 2026

India Refining Summit 2026

India EV Show 2026

EV tech India Expo 2026

Auto Tech Asia 2026
Whitepaper
- Middle East & Africa Commercial Security Market Click here to view more.
- Middle East & Africa Fire Safety Systems & Equipment Market Click here to view more.
- GCC Drone Market Click here to view more.
- Middle East Lighting Fixture Market Click here to view more.
- GCC Physical & Perimeter Security Market Click here to view more.
6WResearch In News
- Doha a strategic location for EV manufacturing hub: IPA Qatar
- Demand for luxury TVs surging in the GCC, says Samsung
- Empowering Growth: The Thriving Journey of Bangladesh’s Cable Industry
- Demand for luxury TVs surging in the GCC, says Samsung
- Video call with a traditional healer? Once unthinkable, it’s now common in South Africa
- Intelligent Buildings To Smooth GCC’s Path To Net Zero