Indonesia Water Desalination Equipment Market (2026-2032) Outlook | Growth, Trends, Share, Analysis, Value, Forecast, Companies, Revenue, Industry & Size
Market Forecast By Technology (Reverse Osmosis, Multi-Stage Flash (MSF) Distillation, Multi-Effect Distillation (MED), Others), By Source (Seawater, Brackish water, River water, Others), By Application (Municipal, Industrial, Others) And Competitive Landscape
| Product Code: ETC088307 | Publication Date: Jul 2023 | Updated Date: Jun 2026 | Product Type: Report | |
| Publisher: 6Wresearch | Author: Ravi Bhandari | No. of Pages: 70 | No. of Figures: 35 | No. of Tables: 5 |
Indonesia Water Desalination Equipment Market Size, Share & Growth Rate
The Indonesia Water Desalination Equipment Market was estimated at USD 430 Million in 2025 and is projected to reach USD 565 Million by 2032, growing at a CAGR of 4.0% from 2026 to 2032. This growth trajectory is primarily driven by a rising population that has intensified the demand for clean and safe drinking water, pushing stakeholders to invest heavily in advanced desalination technologies. As the country grapples with water scarcity, the government’s proactive measures to enhance freshwater access through sustainable methods are further fueling this market's expansion.
Indonesia Water Desalination Equipment Market Year-wise Growth Rate and Key Drivers
This graph highlights how the Indonesia Water Desalination Equipment Market has steadily grown over the years, supported by major growth factors.
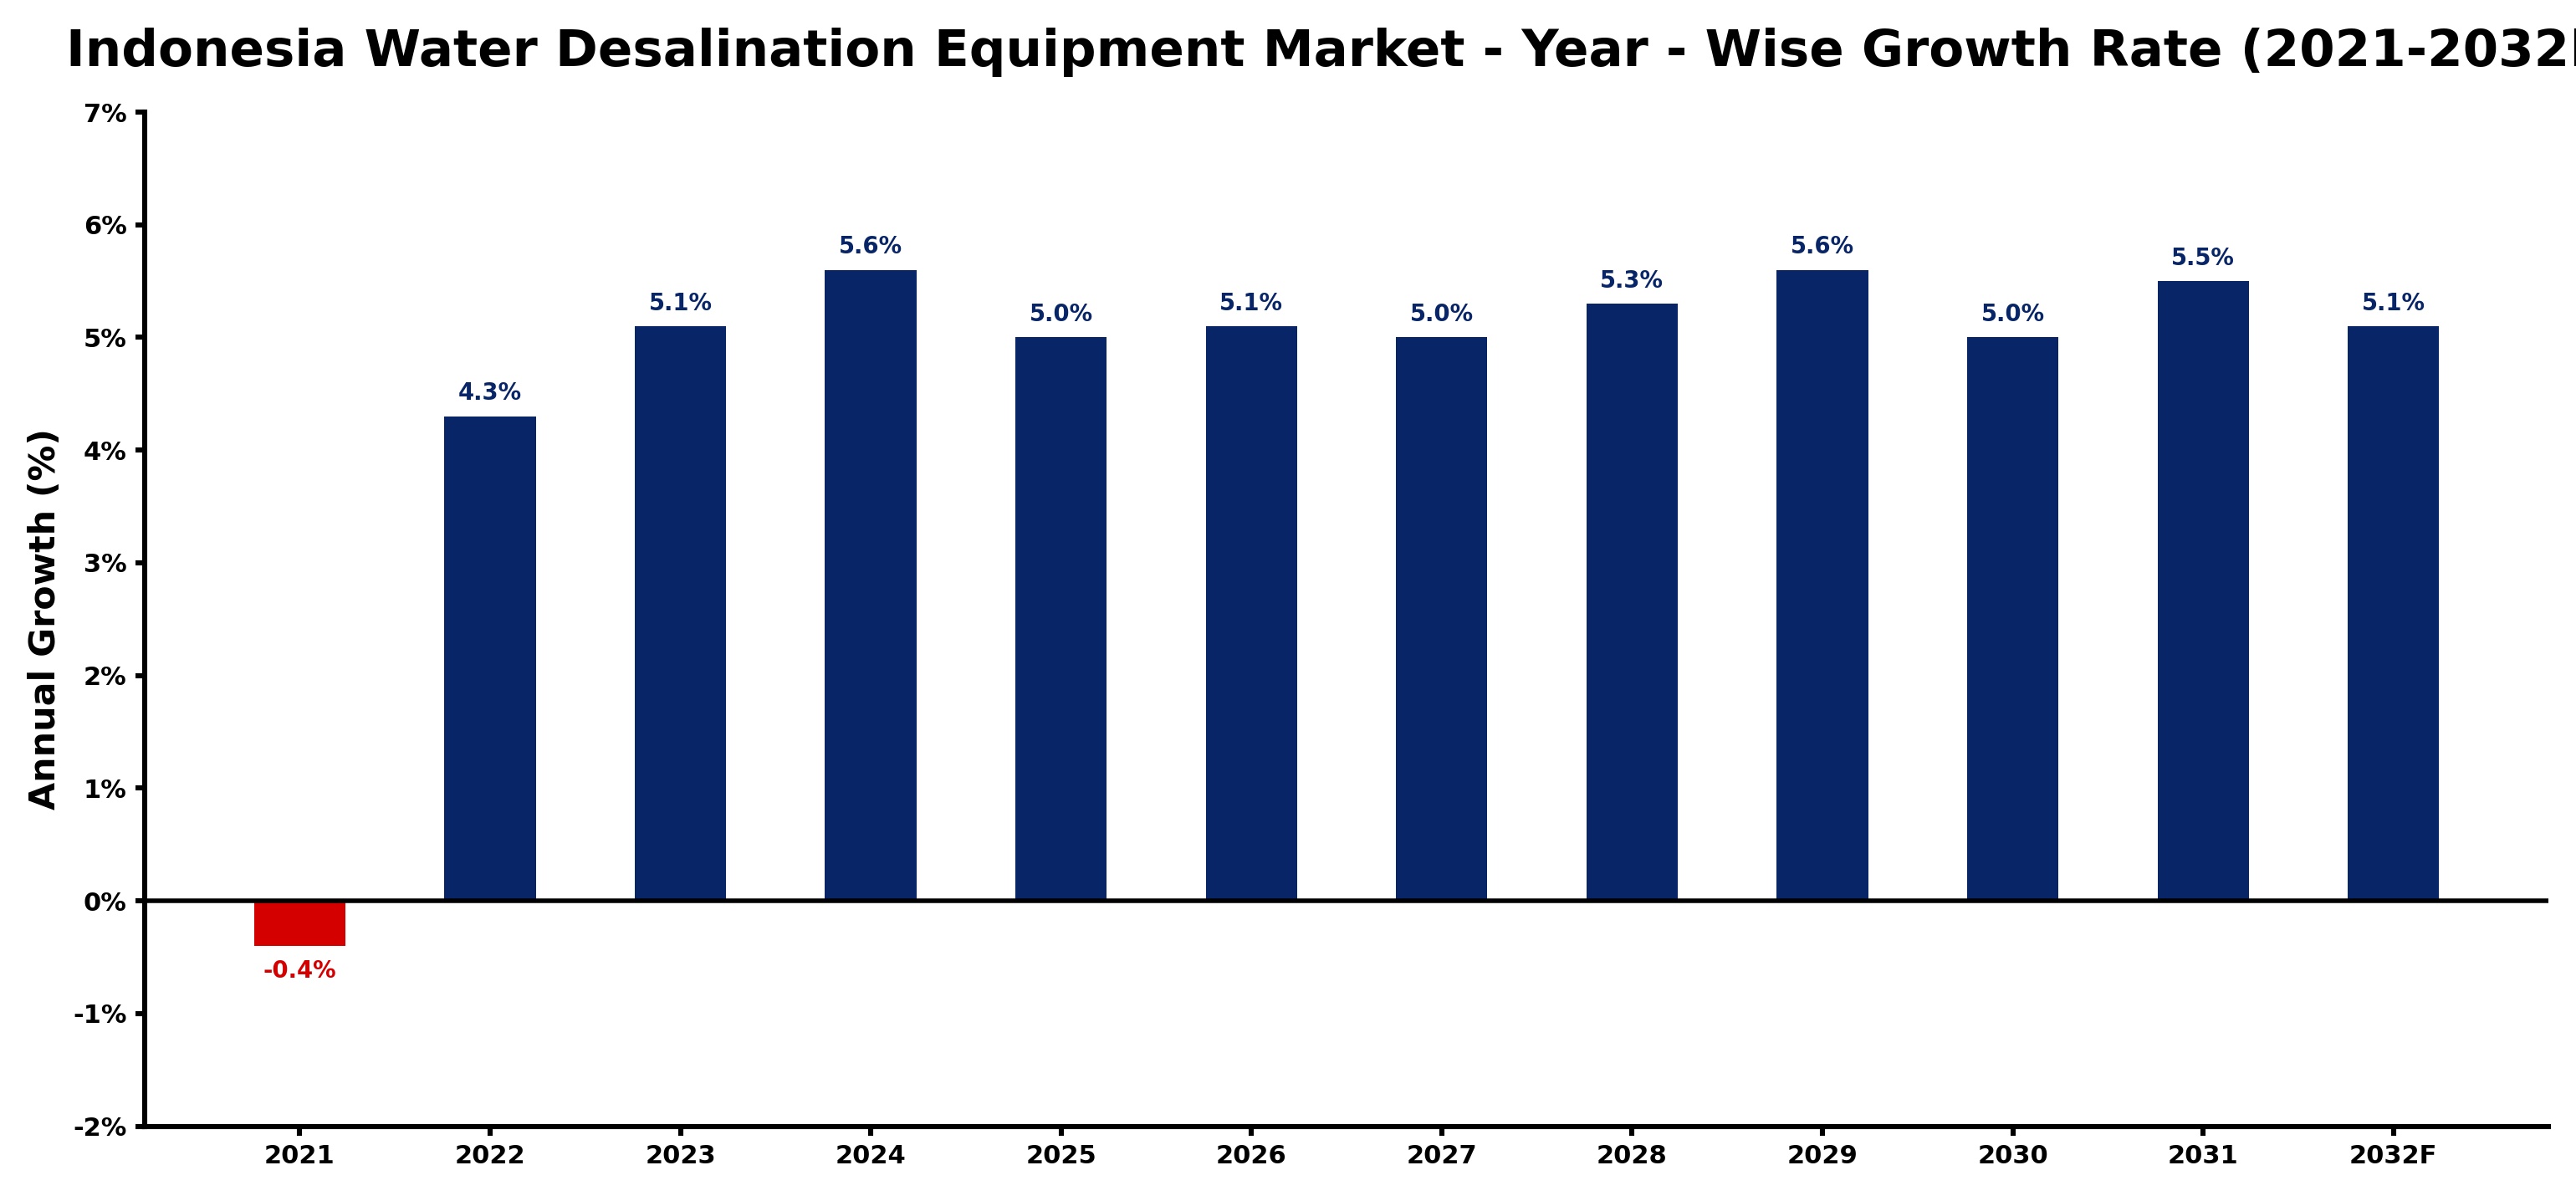
The table below presents the year‑wise growth rates along with the key drivers influencing the market
| Year | Growth Rate | Major Drivers |
| 2021 | -0.4% | Growing renewable energy integration projects |
| 2022 | 4.3% | Growing urbanization and commercial development |
| 2023 | 5.1% | Increasing industrial infrastructure investments |
| 2024 | 5.6% | Expansion of manufacturing activities |
| 2025 | 5.0% | Rising electricity demand across industries |
| 2026 | 5.1% | Expansion of commercial construction activities |
| 2027 | 5.0% | Increasing smart city development projects |
| 2028 | 5.3% | Increasing industrial infrastructure investments |
| 2029 | 5.6% | Rapid growth in telecom and data center sectors |
| 2030 | 5.0% | Increasing industrial infrastructure investments |
| 2031 | 5.5% | Expansion of transportation and logistics networks |
| 2032 | 5.1% | Expansion of commercial construction activities |
Note - Market size estimations and growth projections presented in this report are based on 6Wresearch’s advanced forecasting approach, validated with industry datasets as of June 2026.
Indonesia Water Desalination Equipment Market Synopsis
The most significant force currently shaping the Indonesia Water Desalination Equipment Market is the increasing investment in sea-based desalination plants. This trend is a direct response to the country's escalating potable water demand and the pressing need to address water scarcity caused by rapid urbanization and industrial growth.
Moreover, initiatives from the government aimed at promoting renewable energy are contributing to the sustainability of desalination technologies. The integration of solar and wind power with desalination processes is proving to be a game-changer in improving both environmental outcomes and operational efficiencies.
Indonesia Water Desalination Equipment Market Key Takeaways
- The market is set to grow significantly, driven by rising demand for clean drinking water.
- Government initiatives supporting renewable energy are crucial in shaping the future of desalination technologies.
- Innovative technologies are being adopted to enhance efficiency and reduce operational costs.
- Investment in infrastructure, especially in coastal regions, is rapidly increasing.
- Rising awareness about water reuse is prompting advancements in desalination methods.
Evaluation of Restraints in Indonesia Water Desalination Equipment Market
Despite its promising growth, the Indonesia Water Desalination Equipment Market faces several restraints. High capital costs associated with setting up desalination plants deter potential investors. Furthermore, a lack of awareness among local communities and authorities about the advantages of desalination technology can slow adoption rates. Additionally, the complex regulatory framework can hinder private investments, while limited access to financial resources and skilled labor presents further challenges for market growth.
Indonesia Water Desalination Equipment Market Trends
There is a clear trend towards the adoption of more efficient technologies in the Indonesia Water Desalination Equipment Market. The use of advanced reverse osmosis membranes and nanofiltration materials is gaining traction, as these solutions offer higher permeation rates with lower energy consumption. Simultaneously, greater attention is being paid to wastewater reuse, as regulatory pressures encourage vendors to innovate and enhance operational efficiencies while minimizing environmental impact.
Indonesia Water Desalination Equipment Market Opportunities
Opportunities within the Indonesia Water Desalination Equipment Market lie in the development of hybrid systems that integrate renewable energy sources with desalination technologies. Additionally, expanding urban areas and industrial sectors are increasingly seeking reliable sources of potable water, making investments in desalination a wise choice. Public-private partnerships can also facilitate funding for large-scale projects, opening doors for further innovations and improvements.
Government Initiatives in the Indonesia Water Desalination Equipment Market
The Indonesian government is implementing various initiatives to support the growth of the water desalination sector. Public spending on infrastructure projects, including desalination plants, is being prioritized to address the critical need for clean drinking water. Incentives for adopting renewable energy solutions are also being introduced, further encouraging investment in advanced technologies that improve water access while focusing on sustainability.
Future Insights of the Indonesia Water Desalination Equipment Market
Looking ahead to 2026-2032, the Indonesia Water Desalination Equipment Market is poised for significant transformation. Enhanced technologies will likely lead to reductions in both operational costs and energy consumption, making desalination a more viable option for water scarcity issues. Additionally, as the government prioritizes water security and environmental sustainability, the market can expect to see increased public and private sector collaboration, spurring further growth and innovation.
Indonesia Water Desalination Equipment Market Latest Developments (May 2025 - June 2026)
Recent developments in the Indonesia Water Desalination Equipment Market indicate a shift towards more sustainable practices, with a focus on integrating renewable energy solutions into desalination processes. Companies are exploring partnerships to leverage technological advancements, while the government continues to refine policies that support investment in desalination infrastructure, ultimately aiming to ensure a stable supply of potable water across the nation.
Indonesia Water Desalination Equipment Market - Key Attractiveness of the Report
- 10 Years of Market Numbers
- Historical Data Starting from 2022 to 2025
- Base Year: 2025
- Forecast Data until 2032
- Key Performance Indicators Impacting the Market
- Major Upcoming Developments and Projects
Key Highlights of the Report:
- Indonesia Water Desalination Equipment Market Outlook
- Market Size of Indonesia Water Desalination Equipment Market, 2025
- Forecast of Indonesia Water Desalination Equipment Market, 2032
- Historical Data and Forecast of Indonesia Water Desalination Equipment Revenues & Volume for the Period 2022-2032F
- Indonesia Water Desalination Equipment Market Trend Evolution
- Indonesia Water Desalination Equipment Market Drivers and Challenges
- Indonesia Water Desalination Equipment Price Trends
- Indonesia Water Desalination Equipment Porter's Five Forces
- Indonesia Water Desalination Equipment Industry Life Cycle
- Historical Data and Forecast of Indonesia Water Desalination Equipment Market Revenues & Volume By Technology for the Period 2022-2032F
- Historical Data and Forecast of Indonesia Water Desalination Equipment Market Revenues & Volume By Reverse Osmosis for the Period 2022-2032F
- Historical Data and Forecast of Indonesia Water Desalination Equipment Market Revenues & Volume By Multi-Stage Flash (MSF) Distillation for the Period 2022-2032F
- Historical Data and Forecast of Indonesia Water Desalination Equipment Market Revenues & Volume By Multi-Effect Distillation (MED) for the Period 2022-2032F
- Historical Data and Forecast of Indonesia Water Desalination Equipment Market Revenues & Volume By Others for the Period 2022-2032F
- Historical Data and Forecast of Indonesia Water Desalination Equipment Market Revenues & Volume By Source for the Period 2022-2032F
- Historical Data and Forecast of Indonesia Water Desalination Equipment Market Revenues & Volume By Seawater for the Period 2022-2032F
- Historical Data and Forecast of Indonesia Water Desalination Equipment Market Revenues & Volume By Brackish water for the Period 2022-2032F
- Historical Data and Forecast of Indonesia Water Desalination Equipment Market Revenues & Volume By River water for the Period 2022-2032F
- Historical Data and Forecast of Indonesia Water Desalination Equipment Market Revenues & Volume By Others for the Period 2022-2032F
- Historical Data and Forecast of Indonesia Water Desalination Equipment Market Revenues & Volume By Application for the Period 2022-2032F
- Historical Data and Forecast of Indonesia Water Desalination Equipment Market Revenues & Volume By Municipal for the Period 2022-2032F
- Historical Data and Forecast of Indonesia Water Desalination Equipment Market Revenues & Volume By Industrial for the Period 2022-2032F
- Historical Data and Forecast of Indonesia Water Desalination Equipment Market Revenues & Volume By Others for the Period 2022-2032F
- Indonesia Water Desalination Equipment Import Export Trade Statistics
- Market Opportunity Assessment By Technology
- Market Opportunity Assessment By Source
- Market Opportunity Assessment By Application
- Indonesia Water Desalination Equipment Top Companies Market Share
- Indonesia Water Desalination Equipment Competitive Benchmarking By Technical and Operational Parameters
- Indonesia Water Desalination Equipment Company Profiles
- Indonesia Water Desalination Equipment Key Strategic Recommendations
Indonesia Water Desalination Equipment Market - Frequently Asked Questions
As of 2025, the market size is estimated to be USD 430 Million, projected to reach USD 565 Million by 2032.
The government is prioritizing infrastructure investments and providing incentives for the adoption of renewable energy solutions to boost desalination efforts.
Technologies such as advanced reverse osmosis systems and nanofiltration materials are being adopted to improve efficiency and reduce energy consumption.
Challenges include high capital costs, limited community awareness, and a complex regulatory environment that can impede investments.
Renewable energy solutions are crucial in reducing the operational costs associated with desalination, enhancing both sustainability and affordability.
The Indonesia Water Desalination Equipment Market is expected to see technological advancements that lead to more efficient systems, increased public-private partnerships, and a significant enhancement in water supply stability.
6Wresearch actively monitors the Indonesia Water Desalination Equipment Market and publishes its comprehensive annual report, highlighting emerging trends, growth drivers, revenue analysis, and forecast outlook. Our insights help businesses to make data-backed strategic decisions with ongoing market dynamics. Our analysts track relevent industries related to the Indonesia Water Desalination Equipment Market, allowing our clients with actionable intelligence and reliable forecasts tailored to emerging regional needs.
Yes, we provide customisation as per your requirements. To learn more, feel free to contact us on sales@6wresearch.com
1 Executive Summary |
2 Introduction |
2.1 Key Highlights of the Report |
2.2 Report Description |
2.3 Market Scope & Segmentation |
2.4 Research Methodology |
2.5 Assumptions |
3 Indonesia Water Desalination Equipment Market Overview |
3.1 Indonesia Country Macro Economic Indicators |
3.2 Indonesia Water Desalination Equipment Market Revenues & Volume, 2022 & 2032F |
3.3 Indonesia Water Desalination Equipment Market - Industry Life Cycle |
3.4 Indonesia Water Desalination Equipment Market - Porter's Five Forces |
3.5 Indonesia Water Desalination Equipment Market Revenues & Volume Share, By Technology, 2022 & 2032F |
3.6 Indonesia Water Desalination Equipment Market Revenues & Volume Share, By Source, 2022 & 2032F |
3.7 Indonesia Water Desalination Equipment Market Revenues & Volume Share, By Application, 2022 & 2032F |
4 Indonesia Water Desalination Equipment Market Dynamics |
4.1 Impact Analysis |
4.2 Market Drivers |
4.2.1 Increasing water scarcity and the need for alternative water sources |
4.2.2 Growing population and urbanization leading to higher water demand |
4.2.3 Government initiatives to improve water infrastructure and quality |
4.3 Market Restraints |
4.3.1 High initial investment costs for desalination equipment |
4.3.2 Energy-intensive desalination processes leading to high operational costs |
4.3.3 Environmental concerns related to brine disposal and energy consumption |
5 Indonesia Water Desalination Equipment Market Trends |
6 Indonesia Water Desalination Equipment Market, By Types |
6.1 Indonesia Water Desalination Equipment Market, By Technology |
6.1.1 Overview and Analysis |
6.1.2 Indonesia Water Desalination Equipment Market Revenues & Volume, By Technology, 2022-2032F |
6.1.3 Indonesia Water Desalination Equipment Market Revenues & Volume, By Reverse Osmosis, 2022-2032F |
6.1.4 Indonesia Water Desalination Equipment Market Revenues & Volume, By Multi-Stage Flash (MSF) Distillation, 2022-2032F |
6.1.5 Indonesia Water Desalination Equipment Market Revenues & Volume, By Multi-Effect Distillation (MED), 2022-2032F |
6.1.6 Indonesia Water Desalination Equipment Market Revenues & Volume, By Others, 2022-2032F |
6.2 Indonesia Water Desalination Equipment Market, By Source |
6.2.1 Overview and Analysis |
6.2.2 Indonesia Water Desalination Equipment Market Revenues & Volume, By Seawater, 2022-2032F |
6.2.3 Indonesia Water Desalination Equipment Market Revenues & Volume, By Brackish water, 2022-2032F |
6.2.4 Indonesia Water Desalination Equipment Market Revenues & Volume, By River water, 2022-2032F |
6.2.5 Indonesia Water Desalination Equipment Market Revenues & Volume, By Others, 2022-2032F |
6.3 Indonesia Water Desalination Equipment Market, By Application |
6.3.1 Overview and Analysis |
6.3.2 Indonesia Water Desalination Equipment Market Revenues & Volume, By Municipal, 2022-2032F |
6.3.3 Indonesia Water Desalination Equipment Market Revenues & Volume, By Industrial, 2022-2032F |
6.3.4 Indonesia Water Desalination Equipment Market Revenues & Volume, By Others, 2022-2032F |
7 Indonesia Water Desalination Equipment Market Import-Export Trade Statistics |
7.1 Indonesia Water Desalination Equipment Market Export to Major Countries |
7.2 Indonesia Water Desalination Equipment Market Imports from Major Countries |
8 Indonesia Water Desalination Equipment Market Key Performance Indicators |
8.1 Energy efficiency ratio of desalination equipment |
8.2 Percentage of water production capacity utilized |
8.3 Level of government subsidies or incentives for desalination projects |
8.4 Rate of technological advancements in desalination processes |
8.5 Percentage of water demand met through desalination technology |
9 Indonesia Water Desalination Equipment Market - Opportunity Assessment |
9.1 Indonesia Water Desalination Equipment Market Opportunity Assessment, By Technology, 2022 & 2032F |
9.2 Indonesia Water Desalination Equipment Market Opportunity Assessment, By Source, 2022 & 2032F |
9.3 Indonesia Water Desalination Equipment Market Opportunity Assessment, By Application, 2022 & 2032F |
10 Indonesia Water Desalination Equipment Market - Competitive Landscape |
10.1 Indonesia Water Desalination Equipment Market Revenue Share, By Companies, 2025 |
10.2 Indonesia Water Desalination Equipment Market Competitive Benchmarking, By Operating and Technical Parameters |
11 Company Profiles |
12 Recommendations |
13 Disclaimer |
Global Go To Market Strategy - 2030
Export potential enables firms to identify high-growth global markets with greater confidence by combining advanced trade intelligence with a structured quantitative methodology. The framework analyzes emerging demand trends and country-level import patterns while integrating macroeconomic and trade datasets such as GDP and population forecasts, bilateral import–export flows, tariff structures, elasticity differentials between developed and developing economies, geographic distance, and import demand projections. Using weighted trade values from 2020–2024 as the base period to project country-to-country export potential for 2030, these inputs are operationalized through calculated drivers such as gravity model parameters, tariff impact factors, and projected GDP per-capita growth. Through an analysis of hidden potentials, demand hotspots, and market conditions that are most favorable to success, this method enables firms to focus on target countries, maximize returns, and global expansion with data, backed by accuracy.
By factoring in the projected importer demand gap that is currently unmet and could be potential opportunity, it identifies the potential for the Exporter (Country) among 190 countries, against the general trade analysis, which identifies the biggest importer or exporter.
To discover high-growth global markets and optimize your business strategy:
Click Here
Pricing
- Single User License$ 1,995
- Department License$ 2,400
- Site License$ 3,120
- Global License$ 3,795

Leadership Perspectives from Industry Events
Search
Thought Leadership and Analyst Meet


Our Clients
6WResearch In News
- India Air Conditioner Market Set for Strong Rebound in 2026 After Weather-Led Correction and GST-Driven Recovery: 6Wresearch
- ADAS in India: How Automatic Emergency Braking, Blind Spot Detection & Driver Monitoring are Transforming Road Safety
- Doha a strategic location for EV manufacturing hub: IPA Qatar
- Demand for luxury TVs surging in the GCC, says Samsung
- Empowering Growth: The Thriving Journey of Bangladesh’s Cable Industry
- Demand for luxury TVs surging in the GCC, says Samsung
Latest Reports
- Nicaragua RPG Gaming Market (2026-2032)
- New Zealand RPG Gaming Market (2026-2032)
- Netherlands RPG Gaming Market (2026-2032)
- Nauru RPG Gaming Market (2026-2032)
- Namibia RPG Gaming Market (2026-2032)
- Mozambique RPG Gaming Market (2026-2032)
- Montenegro RPG Gaming Market (2026-2032)
- Mongolia RPG Gaming Market (2026-2032)
- Monaco RPG Gaming Market (2026-2032)
- Micronesia RPG Gaming Market (2026-2032)
Industry Events and Analyst Meet

EV India Expo 2026

HIMTEX 2026

India Refining Summit 2026

India EV Show 2026

EV tech India Expo 2026
Whitepaper
- Middle East & Africa Commercial Security Market Click here to view more.
- Middle East & Africa Fire Safety Systems & Equipment Market Click here to view more.
- GCC Drone Market Click here to view more.
- Middle East Lighting Fixture Market Click here to view more.
- GCC Physical & Perimeter Security Market Click here to view more.