Indonesia Wine production Machinery Market (2026-2032) | Revenue, Growth, Analysis, Trends, Value, Companies, Industry, Share, Forecast, Outlook & Size
Market Forecast By Type (Tanks & fermenters, Crushing & Pressing Equipment, Temperature Control Equipment, Filtration Equipment, Others) And Competitive Landscape
| Product Code: ETC030948 | Publication Date: Jul 2023 | Updated Date: Jun 2026 | Product Type: Report | |
| Publisher: 6Wresearch | Author: Ravi Bhandari | No. of Pages: 70 | No. of Figures: 35 | No. of Tables: 5 |
Indonesia Wine production Machinery Market Summary
The indonesia wine production machinery market was estimated at USD 264 Million in 2025 and is projected to reach USD 349 Million by 2032, growing at a CAGR of 5.7% from 2026 to 2032.
Indonesia Wine production Machinery Market Year-wise Growth Rate and Key Drivers
This graph highlights how the Indonesia Wine production Machinery Market has steadily grown over the past five years, supported by major growth factors.
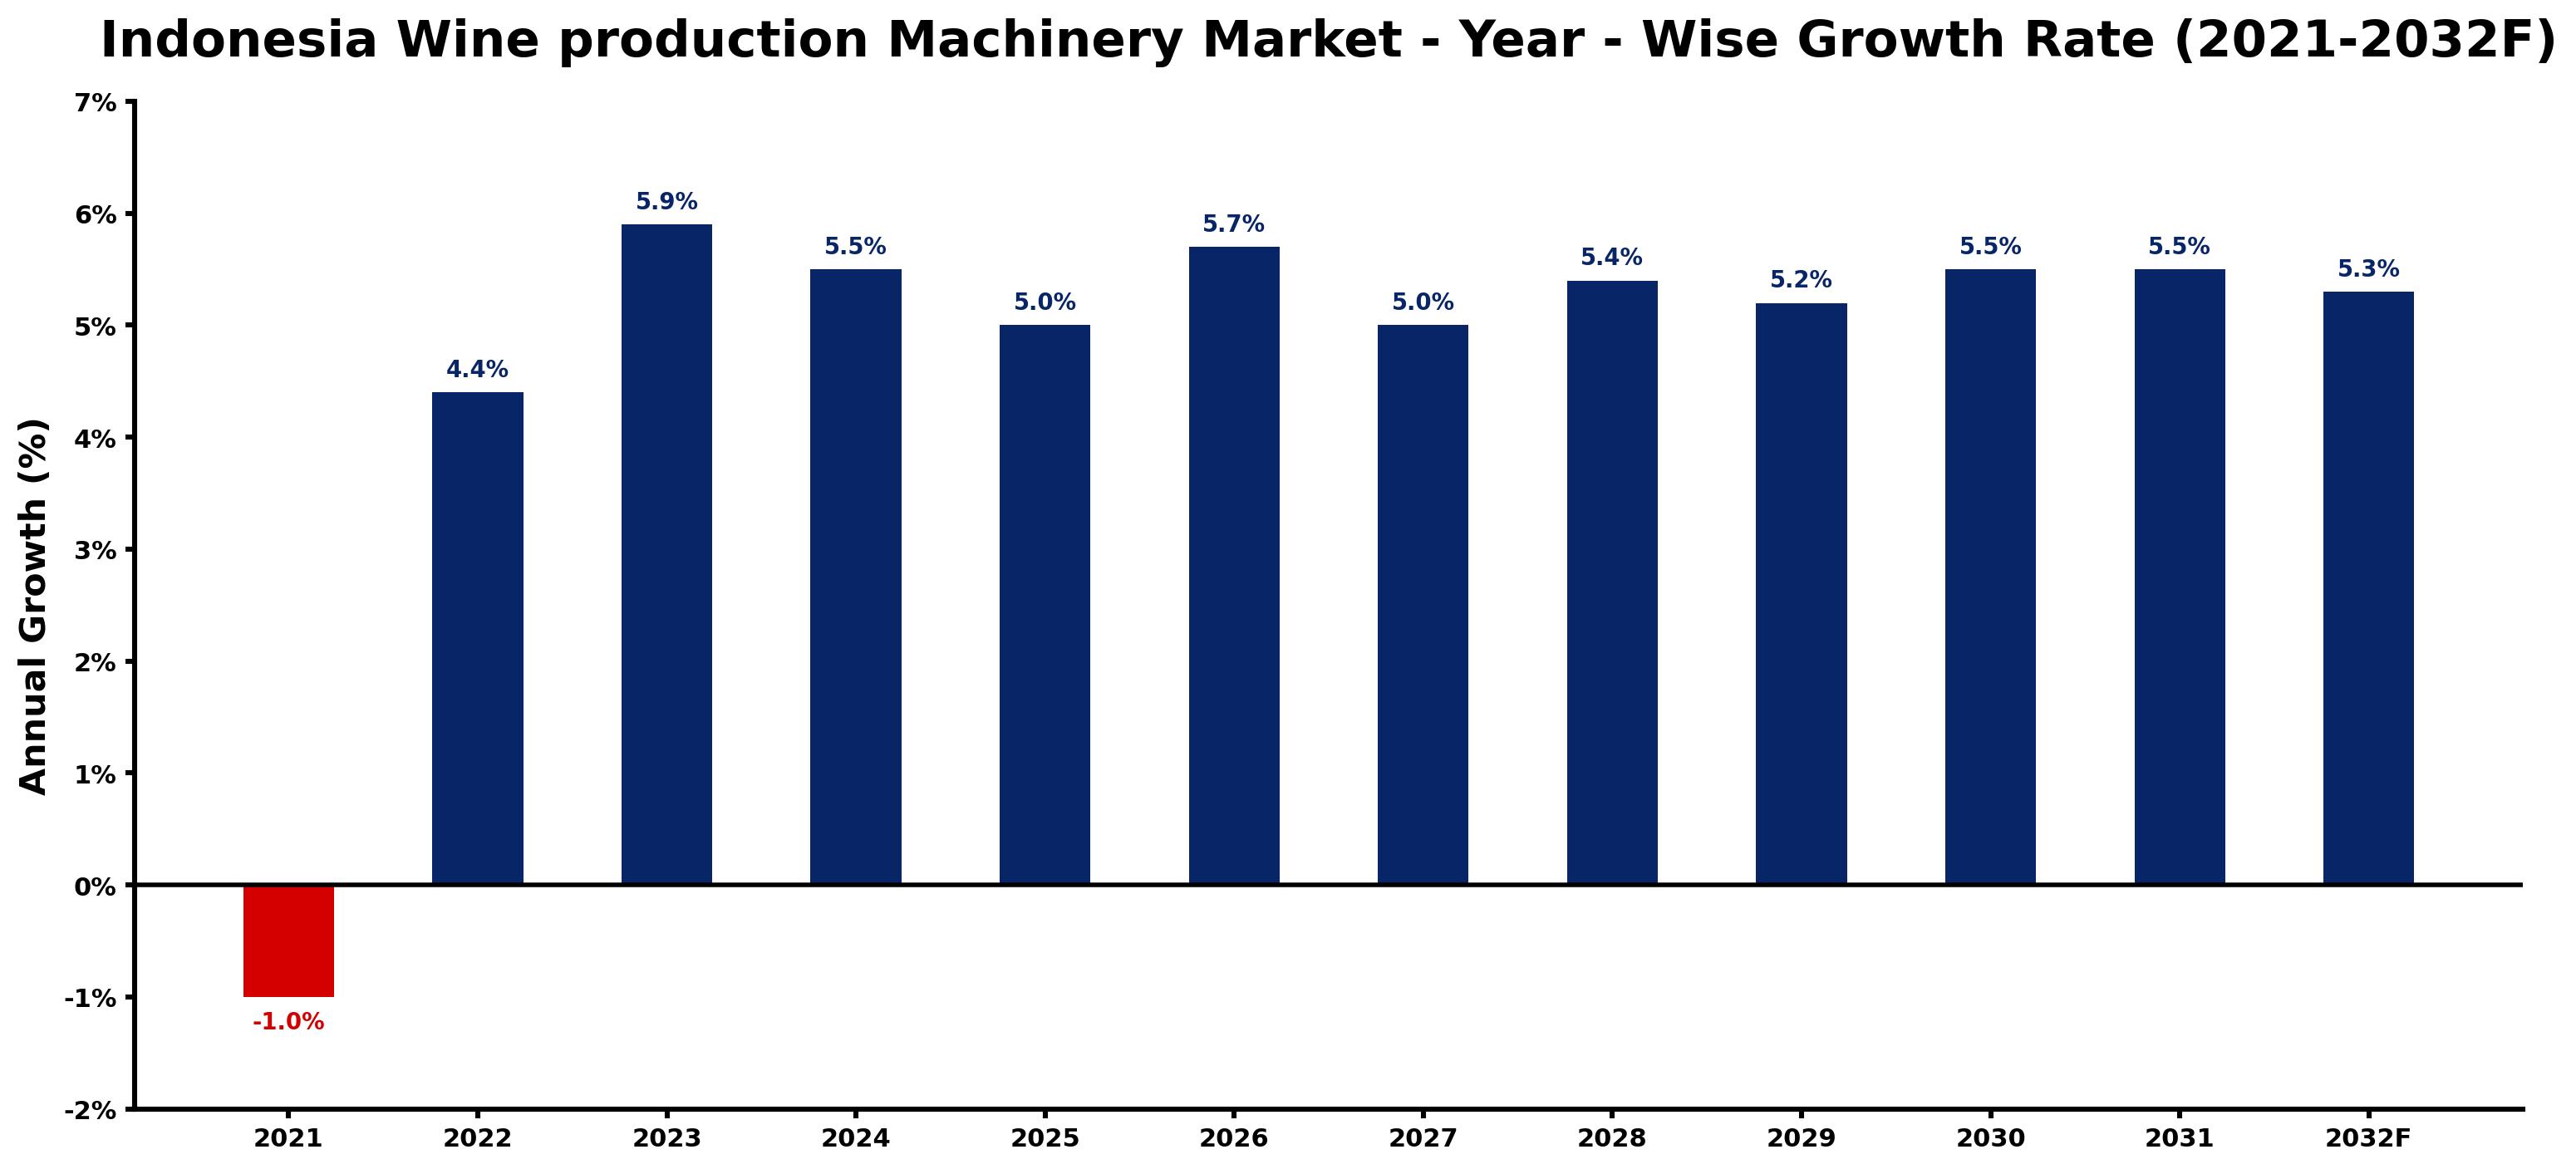
The table below presents the year wise growth rates along with the key drivers influencing the market
| Year | Growth Rate | Major Drivers |
| 2021 | -1.0% | Increased import tariffs on machinery hindered investment in local wine production infrastructure. |
| 2022 | 4.4% | Increased interest in viticulture sparks more investments in wine production facilities. |
| 2023 | 5.9% | Local manufacturers begin developing affordable machinery tailored for Indonesian producers. |
| 2024 | 5.5% | Expanding export opportunities encourage producers to modernize processing equipment. |
| 2025 | 5.0% | Consumer preference shifts towards premium wines elevates production standards and technology needs. |
| 2026 | 5.7% | Collaboration among growers and machinery suppliers leads to innovative production techniques. |
| 2027 | 5.0% | Technological advancements significantly reduce production costs and improve operational efficiency. |
| 2028 | 5.4% | Market players invest in sustainable machinery to align with global environmental trends. |
| 2029 | 5.2% | Growing popularity of wine tourism boosts local demand for quality production systems. |
| 2030 | 5.5% | Increased availability of financing options encourages smaller wineries to upgrade technology. |
| 2031 | 5.5% | Regional trade agreements facilitate easier access to advanced machinery from neighboring countries. |
| 2032 | 5.3% | Recognition of Indonesian wines on international platforms inspires further technological investments. |
Note - Market size estimations and growth projections presented in this report are based on 6Wresearch's advanced forecasting approach, validated with industry datasets as of June 2026.
Indonesia Wine production Machinery Market Synopsis
The Indonesia Wine production Machinery Market is projected to reach USD 4.49 million and witness significant growth during the forecast period (2026-2032). This expansion is primarily driven by the increasing demand for alcoholic beverages in the region, which has consequently heightened the need for advanced and efficient winemaking equipment. Key machinery types contributing to this demand include fermentation tanks, bottling lines, and packaging machines. The rising trend of personalized wines is also expected to play a pivotal role in propelling market growth in Indonesia over the coming years.
Indonesia Wine production Machinery Market Growth Drivers
Several key factors are fueling the growth of the Indonesia Wine production Machinery Market. Firstly, the consumption of alcohol in Indonesia has seen a notable increase in recent years, driven by evolving consumer preferences and a rise in disposable income among the population. This upsurge in consumption holds significant potential for wine manufacturers, prompting them to invest in state-of-the-art winemaking machinery that enhances efficiency and product quality.
- The modernization of winemaking processes allows producers to create high-quality wines at competitive prices, thus improving profit margins.
- Strategic investments in advanced technologies enable quicker production timelines, further amplifying market opportunities in established urban centers such as Jakarta and Bali.
- As consumer interest shifts towards personalized and unique wine offerings, manufacturers are increasingly adopting automated systems that facilitate custom wine production.
- By catering to specific consumer preferences regarding taste and flavor profiles, vendors can enhance customer satisfaction and loyalty within this burgeoning market.
- The combination of these factors is likely to lead to an expanded sales volume and a more vibrant Indonesia Wine production Machinery Market.
Indonesia Wine production Machinery Market Trends and Opportunities
In addition to growth drivers, emerging trends within the Indonesia Wine production Machinery Market present various opportunities for stakeholders. The ongoing shift towards organic and locally sourced ingredients has prompted winemakers to seek equipment capable of supporting sustainable production practices.
- Innovative technologies such as smart fermentation tanks are gaining traction, allowing winemakers to monitor and control fermentation processes with precision.
- The trend towards sustainability is leading manufacturers to invest in eco-friendly machinery that reduces waste and improves energy efficiency.
- Educational initiatives aimed at enhancing winemaking knowledge among local producers are contributing to the industry's overall development, fostering a culture of quality and innovation.
- Collaborations between equipment manufacturers and winemakers pave the way for tailored solutions that address specific challenges faced within the market.
- Overall, the alignment of industry trends with consumer preferences creates a fertile environment for growth in the Indonesia Wine production Machinery Market.
Indonesia Wine production Machinery Market Challenges and Restraints
Despite the optimistic outlook, several challenges hinder the progress of the Indonesia Wine production Machinery Market. A primary concern is the significant upfront investment required for the installation of advanced machinery at customer locations.
- Installation costs can vary widely based on the selected model, complicating investment decisions for manufacturers looking to upgrade existing technology.
- The complexity of new machinery can pose operational challenges, particularly for smaller producers who may lack the expertise to effectively utilize advanced systems.
- Additionally, the availability of cost-effective alternatives in the market sometimes restricts the potential for achieving targeted ROI figures, impacting long-term sustainability.
- Government regulations surrounding alcohol production and sales also present hurdles, with certain areas classified as sensitive resulting in restricted market access for producers.
- These barriers must be navigated effectively in order for stakeholders to fully capitalize on the market's growth potential.
Indonesia Wine production Machinery Market Government Investment and Initiatives
The Indonesian government has shown a growing interest in the alcoholic beverage sector, including the wine industry. Policies aimed at fostering local production and reducing reliance on imports are being implemented to enhance competitiveness.
- Public spending initiatives focused on supporting local agriculture benefit winemakers, particularly those sourcing domestically grown grapes.
- Government incentives aimed at promoting sustainable practices within the wine industry encourage investment in eco-friendly production technologies.
- Collaboration with industry stakeholders to provide training programs is designed to bolster skills in winemaking and equipment operation.
- Policy actions to streamline licensing processes are expected to facilitate easier market entry for new producers.
- Overall, these government investments and initiatives are designed to strengthen the infrastructure supporting the Indonesia Wine production Machinery Market.
Indonesia Wine production Machinery Market Latest Developments (May 2025 - June 2026)
Recent developments within the Indonesia Wine production Machinery Market indicate a period of transformation as stakeholders adapt to changing consumer preferences and market dynamics. Throughout this period, there has been a marked increase in the adoption of automated systems to streamline production processes.
- Industry trends reveal a rising emphasis on technology integration, as producers pursue innovative solutions for enhancing efficiency and product quality.
- Feedback from consumers regarding personalized wine offerings has prompted manufacturers to reconsider design and functionality in their machinery selections.
- The market has also witnessed a gradual shift towards digital marketing strategies to engage consumers, aligning with their preference for unique, locally-sourced products.
- In response to evolving regulations, key players in the market have been actively engaging with government bodies to navigate compliance issues effectively.
- Overall, these developments highlight a proactive approach among market participants to meet the demands of an increasingly discerning consumer base.
Indonesia Wine production Machinery Market - Key Attractiveness of the Report
- 10 Years of Market Numbers
- Historical Data Starting from 2022 to 2025
- Base Year: 2025
- Forecast Data until 2032
- Key Performance Indicators Impacting the Market
- Major Upcoming Developments and Projects
Key Highlights of the Report:
- Indonesia Wine production Machinery Market Outlook
- Market Size of Indonesia Wine production Machinery Market, 2025
- Forecast of Indonesia Wine production Machinery Market, 2032F
- Historical Data and Forecast of Indonesia Wine production Machinery Revenues & Volume for the Period 2022-2032F
- Indonesia Wine production Machinery Market Trend Evolution
- Indonesia Wine production Machinery Market Drivers and Challenges
- Indonesia Wine production Machinery Price Trends
- Indonesia Wine production Machinery Porter's Five Forces
- Indonesia Wine production Machinery Industry Life Cycle
- Historical Data and Forecast of Indonesia Wine production Machinery Market Revenues & Volume By Type for the Period 2022-2032F
- Historical Data and Forecast of Indonesia Wine production Machinery Market Revenues & Volume By Tanks & fermenters for the Period 2022-2032F
- Historical Data and Forecast of Indonesia Wine production Machinery Market Revenues & Volume By Crushing & Pressing Equipment for the Period 2022-2032F
- Historical Data and Forecast of Indonesia Wine production Machinery Market Revenues & Volume By Temperature Control Equipment for the Period 2022-2032F
- Historical Data and Forecast of Indonesia Wine production Machinery Market Revenues & Volume By Filtration Equipment for the Period 2022-2032F
- Historical Data and Forecast of Indonesia Wine production Machinery Market Revenues & Volume By Others for the Period 2022-2032F
- Indonesia Wine production Machinery Import Export Trade Statistics
- Market Opportunity Assessment By Type
- Indonesia Wine production Machinery Top Companies Market Share
- Indonesia Wine production Machinery Competitive Benchmarking By Technical and Operational Parameters
- Indonesia Wine production Machinery Company Profiles
- Indonesia Wine production Machinery Key Strategic Recommendations
Frequently Asked Questions About the Market Study (FAQs):
The growth is primarily driven by increasing demand for alcoholic beverages, rising disposable incomes, shifting consumer preferences towards personalized wines, and significant investments in modern winemaking technologies.
Challenges include high upfront installation costs for new machinery, complexity of advanced systems, availability of cost-effective alternatives, and stringent government regulations on alcohol production.
The government is implementing policies to foster local production, providing incentives for sustainable practices, investing in training programs for skills development, and streamlining licensing processes to facilitate market entry.
Emerging trends include increased automation in production, emphasis on sustainability, growing consumer preference for personalized wines, and a shift towards digital marketing strategies to attract a discerning consumer base.
6Wresearch actively monitors the Indonesia Wine production Machinery Market and publishes its comprehensive annual report, highlighting emerging trends, growth drivers, revenue analysis, and forecast outlook. Our insights help businesses to make data-backed strategic decisions with ongoing market dynamics. Our analysts track relevent industries related to the Indonesia Wine production Machinery Market, allowing our clients with actionable intelligence and reliable forecasts tailored to emerging regional needs.
Yes, we provide customisation as per your requirements. To learn more, feel free to contact us on sales@6wresearch.com
1 Executive Summary |
2 Introduction |
2.1 Key Highlights of the Report |
2.2 Report Description |
2.3 Market Scope & Segmentation |
2.4 Research Methodology |
2.5 Assumptions |
3 Indonesia Wine production Machinery Market Overview |
3.1 Indonesia Country Macro Economic Indicators |
3.2 Indonesia Wine production Machinery Market Revenues & Volume, 2022 & 2032F |
3.3 Indonesia Wine production Machinery Market - Industry Life Cycle |
3.4 Indonesia Wine production Machinery Market - Porter's Five Forces |
3.5 Indonesia Wine production Machinery Market Revenues & Volume Share, By Type, 2022 & 2032F |
4 Indonesia Wine production Machinery Market Dynamics |
4.1 Impact Analysis |
4.2 Market Drivers |
4.3 Market Restraints |
5 Indonesia Wine production Machinery Market Trends |
6 Indonesia Wine production Machinery Market, By Types |
6.1 Indonesia Wine production Machinery Market, By Type |
6.1.1 Overview and Analysis |
6.1.2 Indonesia Wine production Machinery Market Revenues & Volume, By Type, 2022-2032F |
6.1.3 Indonesia Wine production Machinery Market Revenues & Volume, By Tanks & fermenters, 2022-2032F |
6.1.4 Indonesia Wine production Machinery Market Revenues & Volume, By Crushing & Pressing Equipment, 2022-2032F |
6.1.5 Indonesia Wine production Machinery Market Revenues & Volume, By Temperature Control Equipment, 2022-2032F |
6.1.6 Indonesia Wine production Machinery Market Revenues & Volume, By Filtration Equipment, 2022-2032F |
6.1.7 Indonesia Wine production Machinery Market Revenues & Volume, By Others, 2022-2032F |
7 Indonesia Wine production Machinery Market Import-Export Trade Statistics |
7.1 Indonesia Wine production Machinery Market Export to Major Countries |
7.2 Indonesia Wine production Machinery Market Imports from Major Countries |
8 Indonesia Wine production Machinery Market Key Performance Indicators |
9 Indonesia Wine production Machinery Market - Opportunity Assessment |
9.1 Indonesia Wine production Machinery Market Opportunity Assessment, By Type, 2022 & 2032F |
10 Indonesia Wine production Machinery Market - Competitive Landscape |
10.1 Indonesia Wine production Machinery Market Revenue Share, By Companies, 2025 |
10.2 Indonesia Wine production Machinery Market Competitive Benchmarking, By Operating and Technical Parameters |
11 Company Profiles |
12 Recommendations |
13 Disclaimer |
Global Go To Market Strategy - 2030
Export potential enables firms to identify high-growth global markets with greater confidence by combining advanced trade intelligence with a structured quantitative methodology. The framework analyzes emerging demand trends and country-level import patterns while integrating macroeconomic and trade datasets such as GDP and population forecasts, bilateral import–export flows, tariff structures, elasticity differentials between developed and developing economies, geographic distance, and import demand projections. Using weighted trade values from 2020–2024 as the base period to project country-to-country export potential for 2030, these inputs are operationalized through calculated drivers such as gravity model parameters, tariff impact factors, and projected GDP per-capita growth. Through an analysis of hidden potentials, demand hotspots, and market conditions that are most favorable to success, this method enables firms to focus on target countries, maximize returns, and global expansion with data, backed by accuracy.
By factoring in the projected importer demand gap that is currently unmet and could be potential opportunity, it identifies the potential for the Exporter (Country) among 190 countries, against the general trade analysis, which identifies the biggest importer or exporter.
To discover high-growth global markets and optimize your business strategy:
Click Here
Pricing
- Single User License$ 1,995
- Department License$ 2,400
- Site License$ 3,120
- Global License$ 3,795

Leadership Perspectives from Industry Events
Search
Thought Leadership and Analyst Meet


Our Clients
6WResearch In News
- India Air Conditioner Market Set for Strong Rebound in 2026 After Weather-Led Correction and GST-Driven Recovery: 6Wresearch
- ADAS in India: How Automatic Emergency Braking, Blind Spot Detection & Driver Monitoring are Transforming Road Safety
- Doha a strategic location for EV manufacturing hub: IPA Qatar
- Demand for luxury TVs surging in the GCC, says Samsung
- Empowering Growth: The Thriving Journey of Bangladesh’s Cable Industry
- Demand for luxury TVs surging in the GCC, says Samsung
Latest Reports
- Nicaragua RPG Gaming Market (2026-2032)
- New Zealand RPG Gaming Market (2026-2032)
- Netherlands RPG Gaming Market (2026-2032)
- Nauru RPG Gaming Market (2026-2032)
- Namibia RPG Gaming Market (2026-2032)
- Mozambique RPG Gaming Market (2026-2032)
- Montenegro RPG Gaming Market (2026-2032)
- Mongolia RPG Gaming Market (2026-2032)
- Monaco RPG Gaming Market (2026-2032)
- Micronesia RPG Gaming Market (2026-2032)
Industry Events and Analyst Meet

EV India Expo 2026

HIMTEX 2026

India Refining Summit 2026

India EV Show 2026

EV tech India Expo 2026
Whitepaper
- Middle East & Africa Commercial Security Market Click here to view more.
- Middle East & Africa Fire Safety Systems & Equipment Market Click here to view more.
- GCC Drone Market Click here to view more.
- Middle East Lighting Fixture Market Click here to view more.
- GCC Physical & Perimeter Security Market Click here to view more.