Iraq Industrial Silica Sand Market (2026-2032) Outlook | Revenue, Industry, Share, Growth, Size, Value, Analysis, Companies, Forecast & Trends
Market Forecast By Classification (Less Than 40 Mesh, 40-70 Mesh, More Than 70 Mesh), By Application (Hydraulic Fracturing, Glassmaking, Foundry, Ceramics and Refractories, Others) And Competitive Landscape
| Product Code: ETC084364 | Publication Date: Jun 2021 | Updated Date: Jun 2026 | Product Type: Report | |
| Publisher: 6Wresearch | Author: Shubham Padhi | No. of Pages: 70 | No. of Figures: 35 | No. of Tables: 5 |
Iraq Industrial Silica Sand Market Size, Share & Growth Rate
The Iraq Industrial Silica Sand Market was estimated at USD 94 Million in 2025 and is projected to reach USD 102 Million by 2032, growing at a CAGR of 1.2% from 2026 to 2032. This growth trajectory is fueled primarily by the ongoing expansion of the construction and manufacturing sectors, which rely heavily on high-quality silica sand for various applications. As infrastructure development gains momentum and the automotive industry flourishes, demand for silica sand continues to rise, particularly in glassmaking and hydraulic fracturing processes in the oil and gas sector.
Iraq Industrial Silica Sand Market Year-wise Growth Rate and Key Drivers
This graph highlights how the Iraq Industrial Silica Sand Market has steadily grown over the years, supported by major growth factors.
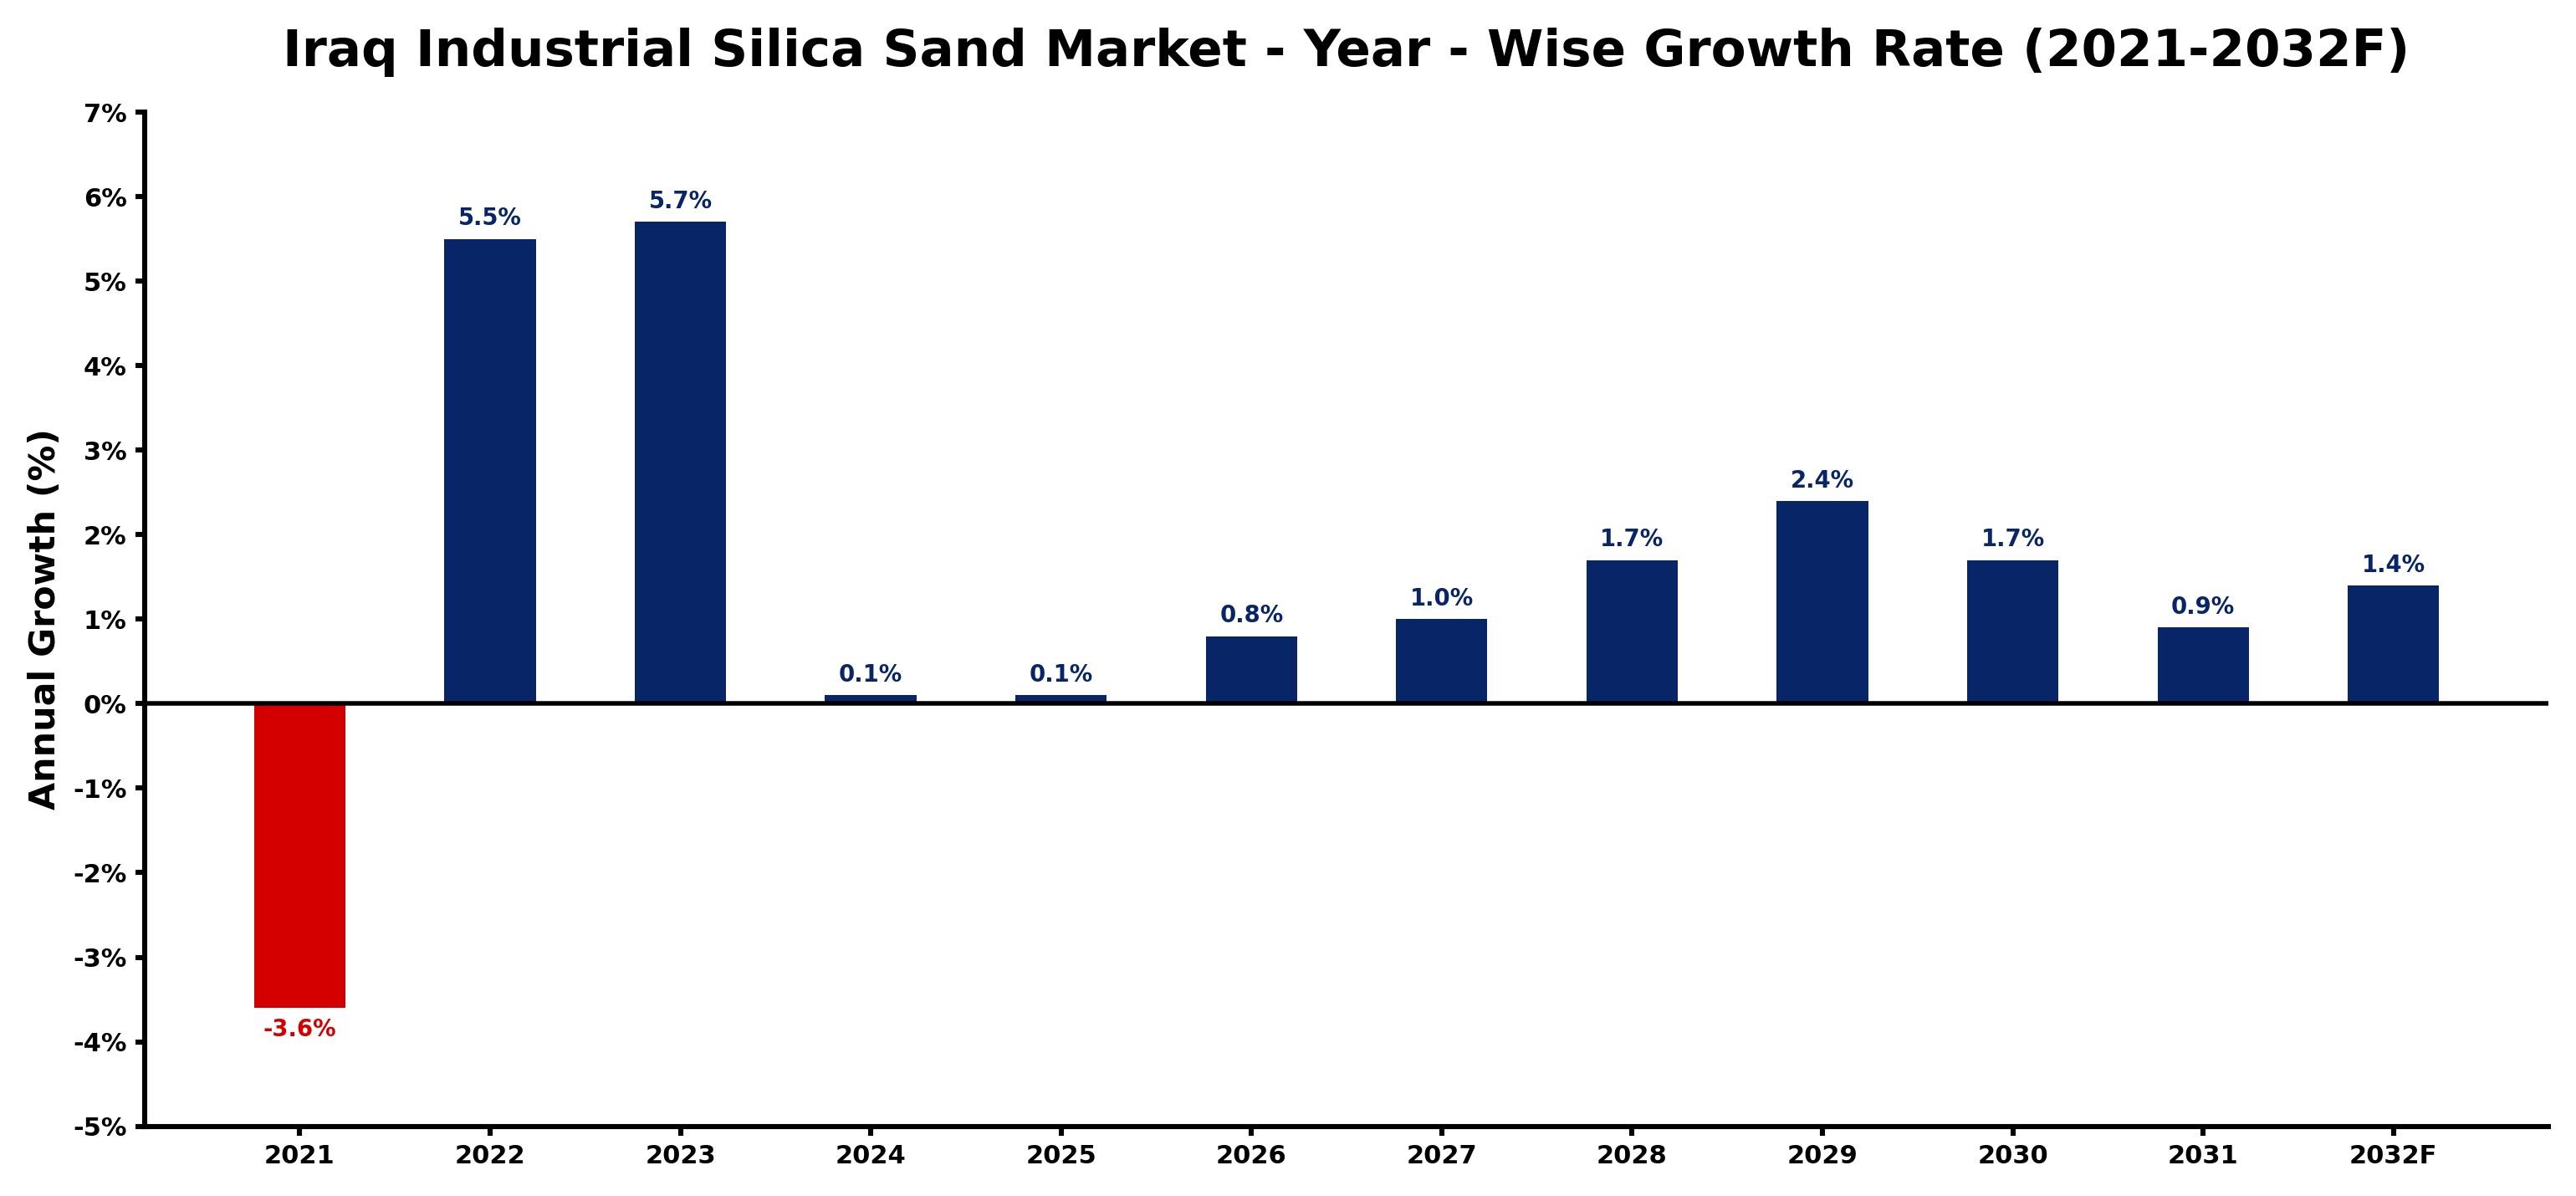
The table below presents the year‑wise growth rates along with the key drivers influencing the market
| Year | Growth Rate | Major Drivers |
| 2021 | -3.6% | Rising electricity demand across industries |
| 2022 | 5.5% | Growing urbanization and commercial development |
| 2023 | 5.7% | Rising electricity demand across industries |
| 2024 | 0.1% | Increasing smart city development projects |
| 2025 | 0.1% | Growing renewable energy integration projects |
| 2026 | 0.8% | Growing renewable energy integration projects |
| 2027 | 1.0% | Rising electricity demand across industries |
| 2028 | 1.7% | Rising electricity demand across industries |
| 2029 | 2.4% | Growing renewable energy integration projects |
| 2030 | 1.7% | Expansion of transportation and logistics networks |
| 2031 | 0.9% | Expansion of commercial construction activities |
| 2032 | 1.4% | Increasing industrial infrastructure investments |
Note - Market size estimations and growth projections presented in this report are based on 6Wresearch’s advanced forecasting approach, validated with industry datasets as of June 2026.
Iraq Industrial Silica Sand Market Synopsis
The strongest force shaping the Iraq Industrial Silica Sand Market today is the rapid growth of the construction industry. The burgeoning demand for concrete, mortar, and other building materials is driving the need for silica sand, providing a solid foundation for market expansion. Additionally, the oil and gas sector's increasing reliance on silica sand for hydraulic fracturing is further propelling growth in this market.
In light of these developments, companies are prioritizing sustainable extraction methods to address environmental concerns. Technological advancements in processing silica sand are also emerging, allowing for improved quality and efficiency, which in turn supports the evolving demands of the construction and manufacturing industries.
Iraq Industrial Silica Sand Market Key Takeaways
- The market is driven by significant demand from construction and oil & gas industries.
- Sustainable practices and technological advancements are becoming paramount in silica sand extraction.
- The Iraqi government is promoting domestic production to reduce import reliance.
- Challenges such as infrastructure limitations and political instability persist, impacting operations.
- Investment opportunities abound, spurred by the country’s rich natural resources and favorable government policies.
Evaluation of Restraints in Iraq Industrial Silica Sand Market
Despite the promising outlook, several restraints are holding back the Iraq Industrial Silica Sand Market. Limited infrastructure and logistics create barriers for efficient transportation and storage of silica sand, impacting the overall supply chain. Political instability and ongoing security concerns can complicate operations and deter investment. Additionally, the regulatory environment is often challenging, with complex bureaucratic processes that companies must navigate, which may delay project timelines and increase costs.
Iraq Industrial Silica Sand Market Trends
Current trends indicate a strong push towards sustainable sourcing practices within the Iraq Industrial Silica Sand Market. Businesses are increasingly adopting eco-friendly methodologies to mitigate the environmental impact associated with mining activities. Moreover, advancements in technology are enhancing processing techniques, allowing for higher quality silica sand that meets the rigorous demands of various applications, from construction to glass production.
Iraq Industrial Silica Sand Market Opportunities
The Iraq Industrial Silica Sand Market is ripe with investment opportunities, particularly due to the country’s abundant natural resources. The construction sector's burgeoning demand for silica sand is coupled with significant growth in the oil and gas industries, especially related to hydraulic fracturing. As the government seeks to attract foreign investment with favorable policies and incentives, stakeholders can capitalize on these dynamics by establishing silica sand mining and processing facilities to meet the growing domestic needs.
Government Initiatives in the Iraq Industrial Silica Sand Market
The Iraqi government has rolled out initiatives aimed at bolstering the industrial silica sand market. Policies designed to incentivize domestic production are in place, reducing the need for imports and promoting self-sufficiency. Regulations focused on ensuring environmentally sustainable mining practices are also a key component of the government's approach. Furthermore, efforts to improve infrastructure and logistical support are underway to enhance the transport of silica sand across the country, fostering a more efficient market.
Future Insights of the Iraq Industrial Silica Sand Market
Looking ahead to 2026-2032, the Iraq Industrial Silica Sand Market is set for moderate growth, primarily driven by escalating demands in construction, oil and gas, and manufacturing sectors. Infrastructure projects and increased investments in industrial activities will likely contribute to this upward trend. However, market participants must remain vigilant to regulatory constraints and environmental concerns that could influence market dynamics. Overall, the future appears bright, backed by diverse applications of silica sand and a commitment to sustainable practices.
Iraq Industrial Silica Sand Market Latest Developments (May 2025 - June 2026)
Recent developments in the Iraq Industrial Silica Sand Market highlight a shift towards more sustainable practices, with companies adopting innovative extraction and processing methods to minimize environmental impact. Additionally, there is growing collaboration between government and industry stakeholders aimed at enhancing the infrastructure necessary for effective silica sand production and transport. These developments signal a proactive approach to addressing both market demands and environmental concerns.
Iraq Industrial Silica Sand Market - Key Attractiveness of the Report
- 10 Years of Market Numbers
- Historical Data Starting from 2022 to 2025
- Base Year: 2025
- Forecast Data until 2032
- Key Performance Indicators Impacting the Market
- Major Upcoming Developments and Projects
Key Highlights of the Report:
- Iraq Industrial Silica Sand Market Outlook
- Market Size of Iraq Industrial Silica Sand Market, 2025
- Forecast of Iraq Industrial Silica Sand Market, 2032
- Historical Data and Forecast of Iraq Industrial Silica Sand Revenues & Volume for the Period 2022-2032F
- Iraq Industrial Silica Sand Market Trend Evolution
- Iraq Industrial Silica Sand Market Drivers and Challenges
- Iraq Industrial Silica Sand Price Trends
- Iraq Industrial Silica Sand Porter's Five Forces
- Iraq Industrial Silica Sand Industry Life Cycle
- Historical Data and Forecast of Iraq Industrial Silica Sand Market Revenues & Volume By Classification for the Period 2022-2032F
- Historical Data and Forecast of Iraq Industrial Silica Sand Market Revenues & Volume By Less Than 40 Mesh for the Period 2022-2032F
- Historical Data and Forecast of Iraq Industrial Silica Sand Market Revenues & Volume By 40-70 Mesh for the Period 2022-2032F
- Historical Data and Forecast of Iraq Industrial Silica Sand Market Revenues & Volume By More Than 70 Mesh for the Period 2022-2032F
- Historical Data and Forecast of Iraq Industrial Silica Sand Market Revenues & Volume By Application for the Period 2022-2032F
- Historical Data and Forecast of Iraq Industrial Silica Sand Market Revenues & Volume By Hydraulic Fracturing for the Period 2022-2032F
- Historical Data and Forecast of Iraq Industrial Silica Sand Market Revenues & Volume By Glassmaking for the Period 2022-2032F
- Historical Data and Forecast of Iraq Industrial Silica Sand Market Revenues & Volume By Foundry for the Period 2022-2032F
- Historical Data and Forecast of Iraq Industrial Silica Sand Market Revenues & Volume By Ceramics and Refractories for the Period 2022-2032F
- Historical Data and Forecast of Iraq Industrial Silica Sand Market Revenues & Volume By Others for the Period 2022-2032F
- Iraq Industrial Silica Sand Import Export Trade Statistics
- Market Opportunity Assessment By Classification
- Market Opportunity Assessment By Application
- Iraq Industrial Silica Sand Top Companies Market Share
- Iraq Industrial Silica Sand Competitive Benchmarking By Technical and Operational Parameters
- Iraq Industrial Silica Sand Company Profiles
- Iraq Industrial Silica Sand Key Strategic Recommendations
Iraq Industrial Silica Sand Market - Frequently Asked Questions
The growth is primarily driven by increasing demand from the construction and oil & gas sectors, particularly for applications such as concrete production and hydraulic fracturing.
The market is estimated to reach USD 102 Million by 2032, growing from USD 94 Million in 2025 at a CAGR of 1.2% from 2026 to 2032.
The Iraqi government is implementing policies to promote domestic production, improve infrastructure, and ensure sustainable mining practices, significantly impacting market growth.
The market encounters hurdles such as limited infrastructure, political instability, and complex regulatory frameworks that can complicate operations.
Yes, companies are focusing on sustainable extraction methods and investing in advanced processing technologies to enhance product quality and meet market demands.
Investors can capitalize on the burgeoning demand for silica sand in various sectors, especially with government incentives encouraging investments in mining and processing facilities.
6Wresearch actively monitors the Iraq Industrial Silica Sand Market and publishes its comprehensive annual report, highlighting emerging trends, growth drivers, revenue analysis, and forecast outlook. Our insights help businesses to make data-backed strategic decisions with ongoing market dynamics. Our analysts track relevent industries related to the Iraq Industrial Silica Sand Market, allowing our clients with actionable intelligence and reliable forecasts tailored to emerging regional needs.
Yes, we provide customisation as per your requirements. To learn more, feel free to contact us on sales@6wresearch.com
1 Executive Summary |
2 Introduction |
2.1 Key Highlights of the Report |
2.2 Report Description |
2.3 Market Scope & Segmentation |
2.4 Research Methodology |
2.5 Assumptions |
3 Iraq Industrial Silica Sand Market Overview |
3.1 Iraq Country Macro Economic Indicators |
3.2 Iraq Industrial Silica Sand Market Revenues & Volume, 2022 & 2032F |
3.3 Iraq Industrial Silica Sand Market - Industry Life Cycle |
3.4 Iraq Industrial Silica Sand Market - Porter's Five Forces |
3.5 Iraq Industrial Silica Sand Market Revenues & Volume Share, By Classification, 2022 & 2032F |
3.6 Iraq Industrial Silica Sand Market Revenues & Volume Share, By Form, 2022 & 2032F |
4 Iraq Industrial Silica Sand Market Dynamics |
4.1 Impact Analysis |
4.2 Market Drivers |
4.2.1 Growing construction industry in Iraq leading to increased demand for industrial silica sand |
4.2.2 Government initiatives promoting industrial development and infrastructure projects |
4.2.3 Expansion of oil and gas sector requiring industrial silica sand for hydraulic fracturing operations |
4.3 Market Restraints |
4.3.1 Environmental concerns and regulations related to industrial silica sand mining and processing |
4.3.2 Fluctuations in global oil prices affecting investment in oil and gas projects in Iraq |
5 Iraq Industrial Silica Sand Market Trends |
6 Iraq Industrial Silica Sand Market, By Types |
6.1 Iraq Industrial Silica Sand Market, By Classification |
6.1.1 Overview and Analysis |
6.1.2 Iraq Industrial Silica Sand Market Revenues & Volume, By Classification, 2022-2032F |
6.1.3 Iraq Industrial Silica Sand Market Revenues & Volume, By Less Than 40 Mesh, 2022-2032F |
6.1.4 Iraq Industrial Silica Sand Market Revenues & Volume, By 40-70 Mesh, 2022-2032F |
6.1.5 Iraq Industrial Silica Sand Market Revenues & Volume, By More Than 70 Mesh, 2022-2032F |
6.2 Iraq Industrial Silica Sand Market, By Application |
6.2.1 Overview and Analysis |
6.2.2 Iraq Industrial Silica Sand Market Revenues & Volume, By Hydraulic Fracturing, 2022-2032F |
6.2.3 Iraq Industrial Silica Sand Market Revenues & Volume, By Glassmaking, 2022-2032F |
6.2.4 Iraq Industrial Silica Sand Market Revenues & Volume, By Foundry, 2022-2032F |
6.2.5 Iraq Industrial Silica Sand Market Revenues & Volume, By Ceramics and Refractories, 2022-2032F |
6.2.6 Iraq Industrial Silica Sand Market Revenues & Volume, By Others, 2022-2032F |
7 Iraq Industrial Silica Sand Market Import-Export Trade Statistics |
7.1 Iraq Industrial Silica Sand Market Export to Major Countries |
7.2 Iraq Industrial Silica Sand Market Imports from Major Countries |
8 Iraq Industrial Silica Sand Market Key Performance Indicators |
8.1 Average selling price of industrial silica sand in Iraq |
8.2 Volume of industrial silica sand imported/exported in Iraq |
8.3 Number of new construction permits issued in Iraq |
8.4 Investment in oil and gas exploration and production projects in Iraq |
9 Iraq Industrial Silica Sand Market - Opportunity Assessment |
9.1 Iraq Industrial Silica Sand Market Opportunity Assessment, By Classification, 2022 & 2032F |
9.2 Iraq Industrial Silica Sand Market Opportunity Assessment, By Application, 2022 & 2032F |
10 Iraq Industrial Silica Sand Market - Competitive Landscape |
10.1 Iraq Industrial Silica Sand Market Revenue Share, By Companies, 2025 |
10.2 Iraq Industrial Silica Sand Market Competitive Benchmarking, By Operating and Technical Parameters |
11 Company Profiles |
12 Recommendations |
13 Disclaimer |
Global Go To Market Strategy - 2030
Export potential enables firms to identify high-growth global markets with greater confidence by combining advanced trade intelligence with a structured quantitative methodology. The framework analyzes emerging demand trends and country-level import patterns while integrating macroeconomic and trade datasets such as GDP and population forecasts, bilateral import–export flows, tariff structures, elasticity differentials between developed and developing economies, geographic distance, and import demand projections. Using weighted trade values from 2020–2024 as the base period to project country-to-country export potential for 2030, these inputs are operationalized through calculated drivers such as gravity model parameters, tariff impact factors, and projected GDP per-capita growth. Through an analysis of hidden potentials, demand hotspots, and market conditions that are most favorable to success, this method enables firms to focus on target countries, maximize returns, and global expansion with data, backed by accuracy.
By factoring in the projected importer demand gap that is currently unmet and could be potential opportunity, it identifies the potential for the Exporter (Country) among 190 countries, against the general trade analysis, which identifies the biggest importer or exporter.
To discover high-growth global markets and optimize your business strategy:
Click Here
Pricing
- Single User License$ 1,995
- Department License$ 2,400
- Site License$ 3,120
- Global License$ 3,795

Leadership Perspectives from Industry Events
Search
Thought Leadership and Analyst Meet


Our Clients
6WResearch In News
- India Air Conditioner Market Set for Strong Rebound in 2026 After Weather-Led Correction and GST-Driven Recovery: 6Wresearch
- ADAS in India: How Automatic Emergency Braking, Blind Spot Detection & Driver Monitoring are Transforming Road Safety
- Doha a strategic location for EV manufacturing hub: IPA Qatar
- Demand for luxury TVs surging in the GCC, says Samsung
- Empowering Growth: The Thriving Journey of Bangladesh’s Cable Industry
- Demand for luxury TVs surging in the GCC, says Samsung
Latest Reports
- Nicaragua RPG Gaming Market (2026-2032)
- New Zealand RPG Gaming Market (2026-2032)
- Netherlands RPG Gaming Market (2026-2032)
- Nauru RPG Gaming Market (2026-2032)
- Namibia RPG Gaming Market (2026-2032)
- Mozambique RPG Gaming Market (2026-2032)
- Montenegro RPG Gaming Market (2026-2032)
- Mongolia RPG Gaming Market (2026-2032)
- Monaco RPG Gaming Market (2026-2032)
- Micronesia RPG Gaming Market (2026-2032)
Industry Events and Analyst Meet

EV India Expo 2026

HIMTEX 2026

India Refining Summit 2026

India EV Show 2026

EV tech India Expo 2026
Whitepaper
- Middle East & Africa Commercial Security Market Click here to view more.
- Middle East & Africa Fire Safety Systems & Equipment Market Click here to view more.
- GCC Drone Market Click here to view more.
- Middle East Lighting Fixture Market Click here to view more.
- GCC Physical & Perimeter Security Market Click here to view more.