Italy 3D Holographic Display and Services Market (2026-2032) Outlook | Trends, Value, Forecast, Companies, Share, Industry, Revenue, Size, Growth & Analysis
Market Forecast By End-users (Media and Entertainment, Consumer Electronics, Healthcare, Automotive, Retail, Others) And Competitive Landscape
| Product Code: ETC066752 | Publication Date: Aug 2021 | Updated Date: Jun 2026 | Product Type: Report | |
| Publisher: 6Wresearch | Author: Sachin Kumar Rai | No. of Pages: 70 | No. of Figures: 35 | No. of Tables: 5 |
Italy 3D Holographic Display and Services Market Size, Share & Growth Rate
The Italy 3D Holographic Display and Services Market was estimated at USD 98 Million in 2025 and is projected to reach USD 108 Million by 2032, growing at a CAGR of 1.4% from 2026 to 2032. This growth trajectory is propelled by increasing technological advancements that enhance display capabilities, as well as a surge in demand for immersive advertising solutions across multiple sectors. The retail and healthcare industries, in particular, are investing heavily in holographic solutions to elevate customer engagement and enrich the overall consumer experience.
Italy 3D Holographic Display and Services Market Year-wise Growth Rate and Key Drivers
This graph highlights how the Italy 3D Holographic Display and Services Market has steadily grown over the years, supported by major growth factors.
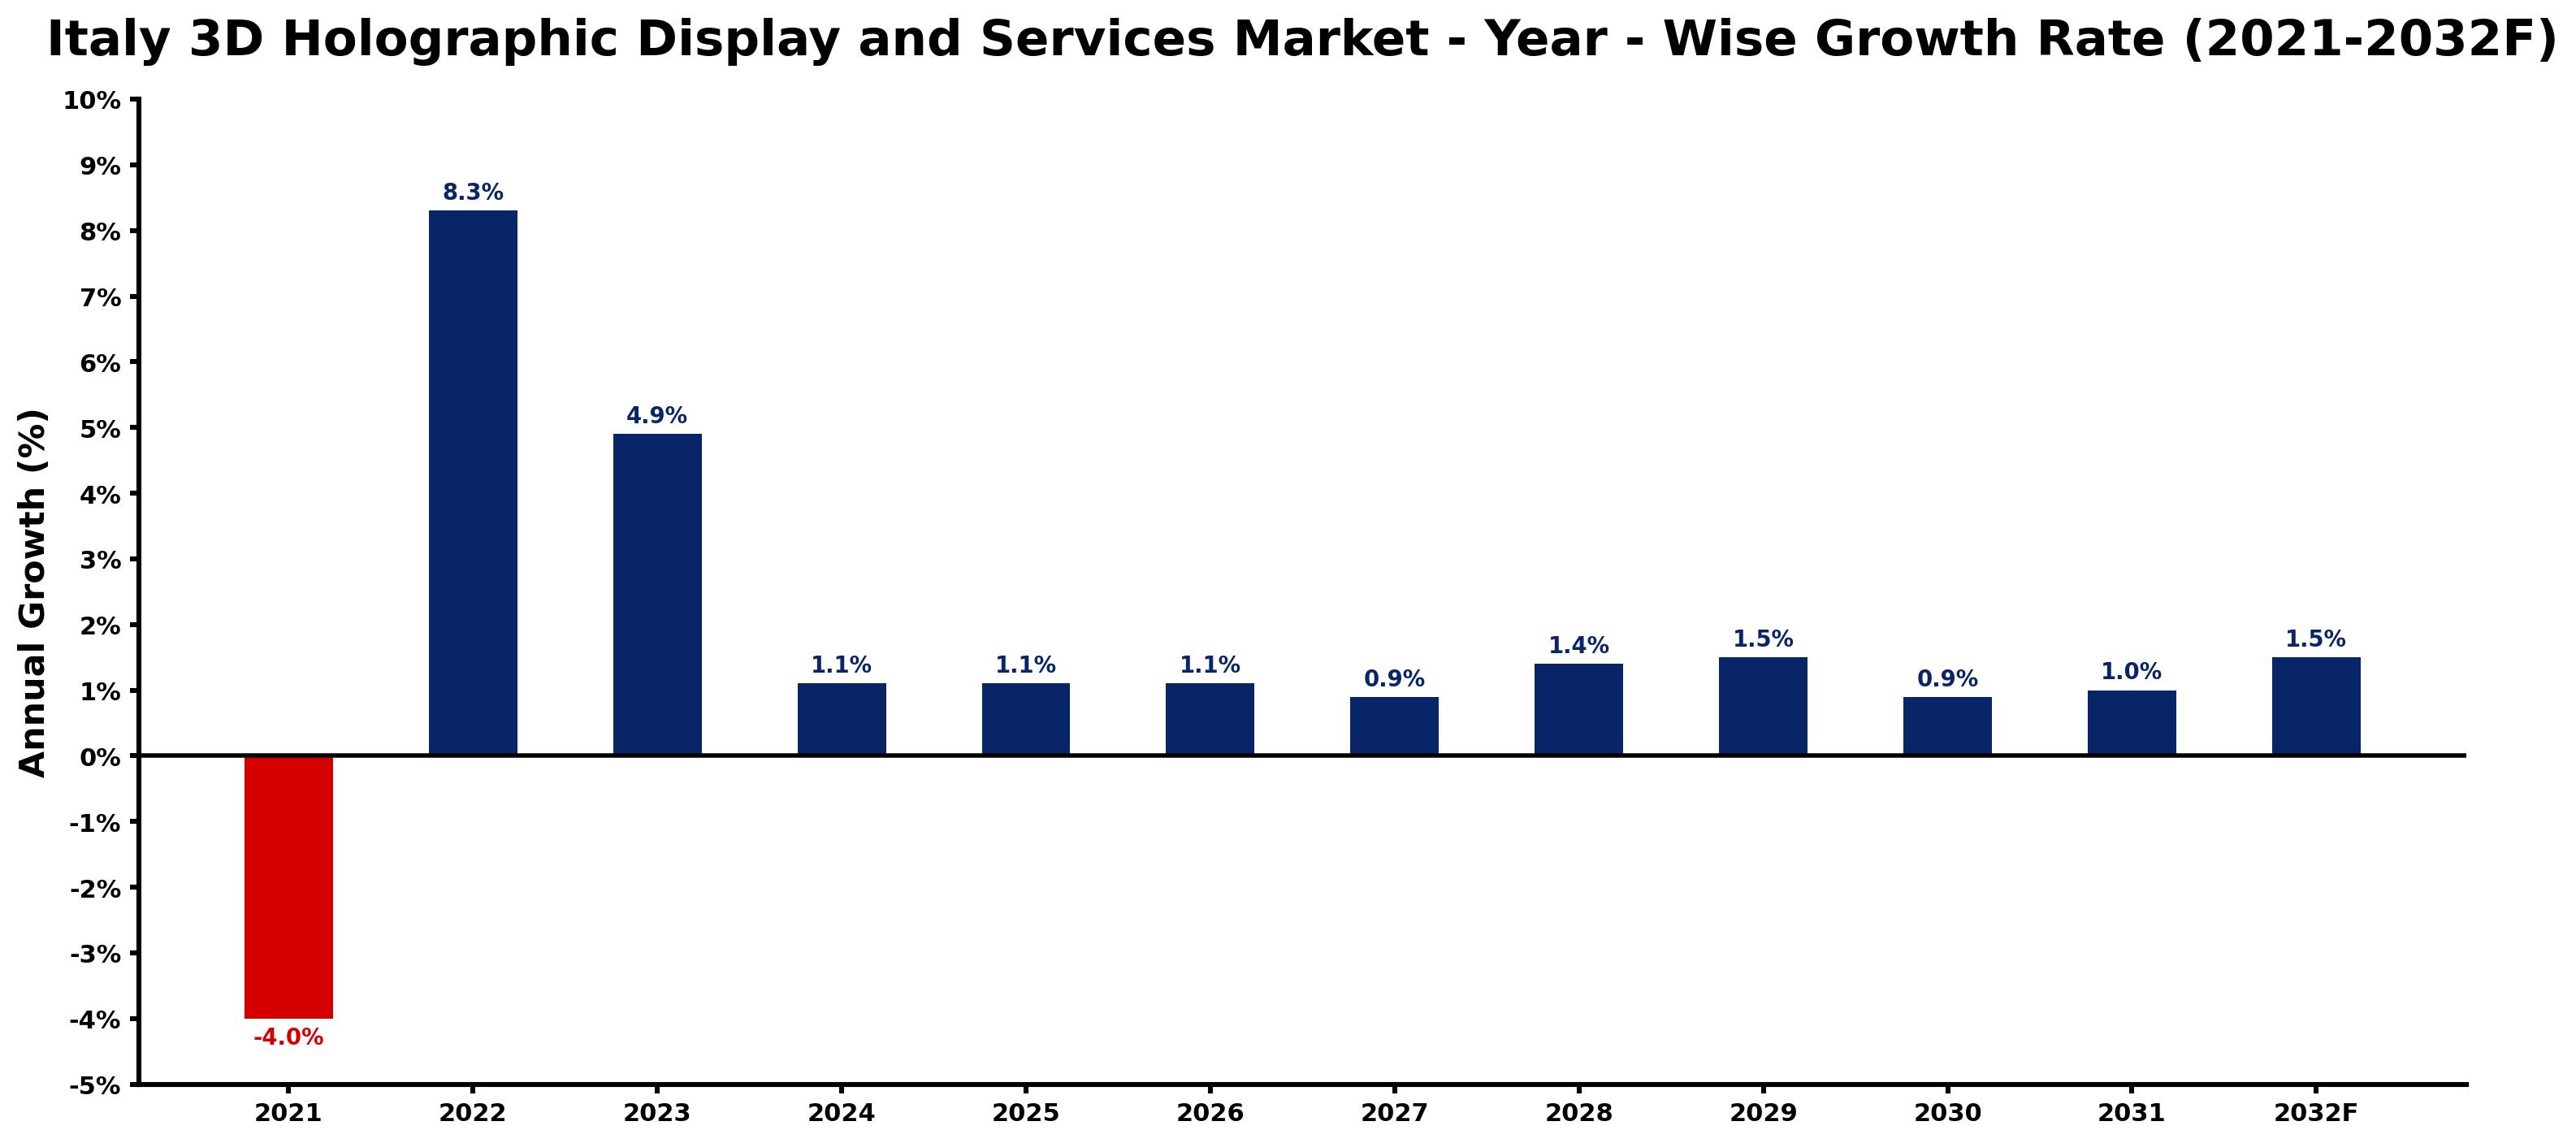
The table below presents the year‑wise growth rates along with the key drivers influencing the market
| Year | Growth Rate | Major Drivers |
| 2021 | -4.0% | Increasing industrial automation investments |
| 2022 | 8.3% | Expansion of commercial construction activities |
| 2023 | 4.9% | Government infrastructure modernization initiatives |
| 2024 | 1.1% | Increasing smart city development projects |
| 2025 | 1.1% | Growing renewable energy integration projects |
| 2026 | 1.1% | Growing urbanization and commercial development |
| 2027 | 0.9% | Rapid growth in telecom and data center sectors |
| 2028 | 1.4% | Expansion of commercial construction activities |
| 2029 | 1.5% | Rapid growth in telecom and data center sectors |
| 2030 | 0.9% | Growing urbanization and commercial development |
| 2031 | 1.0% | Rising electricity demand across industries |
| 2032 | 1.5% | Government infrastructure modernization initiatives |
Note - Market size estimations and growth projections presented in this report are based on 6Wresearch’s advanced forecasting approach, validated with industry datasets as of June 2026.
Italy 3D Holographic Display and Services Market Synopsis
Recent trends indicate a burgeoning interest in holographic displays for marketing and product visualization purposes. Businesses are increasingly employing these technologies to deliver compelling narratives that resonate with their target audiences, thereby enhancing brand visibility and consumer interaction.
Additionally, sectors like automotive and entertainment are harnessing 3D holographic displays to create unique experiences that captivate audiences. This not only showcases their products in innovative ways but also pushes the boundaries of traditional advertising and presentation methods.
Italy 3D Holographic Display and Services Market Key Takeaways
- The market is steadily expanding, fueled by increasing integration of advanced display technologies.
- Holographic displays are gaining traction particularly in retail, healthcare, and automotive sectors.
- Innovations in interactive features and resolution are enhancing the user experience.
- Investment in holographic solutions is becoming a strategic focus for companies looking to engage consumers more effectively.
- The future is poised for growth as artificial intelligence and augmented reality converge with holographic technologies.
Evaluation of Restraints in Italy 3D Holographic Display and Services Market
Despite its promising growth, the market faces notable challenges. A primary restraint is the high initial investment required for implementing cutting-edge holographic technologies. The costs associated with advanced hardware, specialized software, and content creation can be prohibitive for many businesses. Additionally, the absence of standardized formats for 3D holographic content complicates the consistency and quality of user experiences. Moreover, a general lack of consumer awareness can stifle widespread adoption, presenting a hurdle for companies eager to capitalize on this technology.
Italy 3D Holographic Display and Services Market Trends
Current trends show a shift towards the application of holographic displays for training and simulations, which enhances learning experiences across various sectors. Businesses are increasingly leveraging holographic technology in virtual events, allowing for more dynamic presentations that draw in audiences. The combination of artificial intelligence with holographic displays is another emerging trend, allowing for more personalized customer interactions and engagement strategies.
Italy 3D Holographic Display and Services Market Opportunities
Investment opportunities abound in the Italy 3D Holographic Display and Services Market, particularly in companies that focus on the development of advanced holographic technologies. There's a growing market for services related to content creation and software development that supports holographic displays. Additionally, sectors like education and healthcare show potential for growth, as organizations seek innovative solutions to improve training and patient engagement through immersive experiences.
Government Initiatives in the Italy 3D Holographic Display and Services Market
While there are no specific government policies targeting the 3D holographic display market in Italy, existing regulations on intellectual property rights and consumer protection indirectly influence the sector. Compliance with EU technology standards and trade policies also plays a significant role in shaping the landscape for businesses operating within this market.
Future Insights of the Italy 3D Holographic Display and Services Market
Looking ahead to 2026-2032, the Italy 3D Holographic Display and Services Market is set to flourish, driven by ongoing technological advancements and increasing adoption in various industries. As companies prioritize enhanced customer engagement and immersive user experiences, the market is expected to witness significant growth. The fusion of augmented reality and artificial intelligence with holographic displays will further accelerate this trend, making the future of this market bright.
Italy 3D Holographic Display and Services Market Latest Developments (May 2025 - June 2026)
The industry is witnessing notable advancements in technology, with companies unveiling innovative holographic display solutions that offer improved resolution and interactive capabilities. Furthermore, there has been a surge in collaborative efforts aimed at enhancing content creation tools for holographic displays. Businesses are also exploring new applications in virtual events and training modules, adapting to the evolving demands of the market.
Italy 3D Holographic Display and Services Market - Key Attractiveness of the Report
- 10 Years of Market Numbers
- Historical Data Starting from 2022 to 2025
- Base Year: 2025
- Forecast Data until 2032
- Key Performance Indicators Impacting the Market
- Major Upcoming Developments and Projects
Key Highlights of the Report:
- Italy 3D Holographic Display and Services Market Outlook
- Market Size of Italy 3D Holographic Display and Services Market, 2025
- Forecast of Italy 3D Holographic Display and Services Market, 2032
- Historical Data and Forecast of Italy 3D Holographic Display and Services Revenues & Volume for the Period 2022-2032F
- Italy 3D Holographic Display and Services Market Trend Evolution
- Italy 3D Holographic Display and Services Market Drivers and Challenges
- Italy 3D Holographic Display and Services Price Trends
- Italy 3D Holographic Display and Services Porter's Five Forces
- Italy 3D Holographic Display and Services Industry Life Cycle
- Historical Data and Forecast of Italy 3D Holographic Display and Services Market Revenues & Volume By End-users for the Period 2022-2032F
- Historical Data and Forecast of Italy 3D Holographic Display and Services Market Revenues & Volume By Media and Entertainment for the Period 2022-2032F
- Historical Data and Forecast of Italy 3D Holographic Display and Services Market Revenues & Volume By Consumer Electronics for the Period 2022-2032F
- Historical Data and Forecast of Italy 3D Holographic Display and Services Market Revenues & Volume By Healthcare for the Period 2022-2032F
- Historical Data and Forecast of Italy 3D Holographic Display and Services Market Revenues & Volume By Automotive for the Period 2022-2032F
- Historical Data and Forecast of Italy 3D Holographic Display and Services Market Revenues & Volume By Retail for the Period 2022-2032F
- Historical Data and Forecast of Italy 3D Holographic Display and Services Market Revenues & Volume By Others for the Period 2022-2032F
- Italy 3D Holographic Display and Services Import Export Trade Statistics
- Market Opportunity Assessment By End-users
- Italy 3D Holographic Display and Services Top Companies Market Share
- Italy 3D Holographic Display and Services Competitive Benchmarking By Technical and Operational Parameters
- Italy 3D Holographic Display and Services Company Profiles
- Italy 3D Holographic Display and Services Key Strategic Recommendations
Italy 3D Holographic Display and Services Market - Frequently Asked Questions
The Italy 3D Holographic Display and Services Market is projected to grow at a CAGR of 1.4% from 2026 to 2032, reaching USD 108 Million by 2032.
The retail and healthcare sectors are leading the charge, as businesses seek innovative ways to engage consumers and enhance their service offerings.
Continuous advancements in technology, particularly in resolution and interactivity, significantly enhance user experiences and drive adoption across various sectors.
Yes, companies grapple with high initial investment costs and a lack of standardized content formats, which can hinder consistent quality and delivery.
While there are no specific policies aimed directly at the holographic display market, existing regulations on intellectual property and consumer rights affect market operations.
6Wresearch actively monitors the Italy 3D Holographic Display and Services Market and publishes its comprehensive annual report, highlighting emerging trends, growth drivers, revenue analysis, and forecast outlook. Our insights help businesses to make data-backed strategic decisions with ongoing market dynamics. Our analysts track relevent industries related to the Italy 3D Holographic Display and Services Market, allowing our clients with actionable intelligence and reliable forecasts tailored to emerging regional needs.
Yes, we provide customisation as per your requirements. To learn more, feel free to contact us on sales@6wresearch.com
1 Executive Summary |
2 Introduction |
2.1 Key Highlights of the Report |
2.2 Report Description |
2.3 Market Scope & Segmentation |
2.4 Research Methodology |
2.5 Assumptions |
3 Italy 3D Holographic Display and Services Market Overview |
3.1 Italy Country Macro Economic Indicators |
3.2 Italy 3D Holographic Display and Services Market Revenues & Volume, 2022 & 2032F |
3.3 Italy 3D Holographic Display and Services Market - Industry Life Cycle |
3.4 Italy 3D Holographic Display and Services Market - Porter's Five Forces |
3.5 Italy 3D Holographic Display and Services Market Revenues & Volume Share, By End-users, 2022 & 2032F |
4 Italy 3D Holographic Display and Services Market Dynamics |
4.1 Impact Analysis |
4.2 Market Drivers |
4.2.1 Increasing demand for innovative display technologies |
4.2.2 Growing adoption of 3D technology in various industries such as entertainment, healthcare, and advertising |
4.2.3 Technological advancements leading to enhanced capabilities and functionalities of 3D holographic displays |
4.3 Market Restraints |
4.3.1 High initial costs associated with implementing 3D holographic display systems |
4.3.2 Limited awareness and understanding of 3D holographic technology among potential end-users |
4.3.3 Challenges related to compatibility and integration with existing infrastructure and systems |
5 Italy 3D Holographic Display and Services Market Trends |
6 Italy 3D Holographic Display and Services Market, By Types |
6.1 Italy 3D Holographic Display and Services Market, By End-users |
6.1.1 Overview and Analysis |
6.1.2 Italy 3D Holographic Display and Services Market Revenues & Volume, By End-users, 2022-2032F |
6.1.3 Italy 3D Holographic Display and Services Market Revenues & Volume, By Media and Entertainment, 2022-2032F |
6.1.4 Italy 3D Holographic Display and Services Market Revenues & Volume, By Consumer Electronics, 2022-2032F |
6.1.5 Italy 3D Holographic Display and Services Market Revenues & Volume, By Healthcare, 2022-2032F |
6.1.6 Italy 3D Holographic Display and Services Market Revenues & Volume, By Automotive, 2022-2032F |
6.1.7 Italy 3D Holographic Display and Services Market Revenues & Volume, By Retail, 2022-2032F |
6.1.8 Italy 3D Holographic Display and Services Market Revenues & Volume, By Others, 2022-2032F |
7 Italy 3D Holographic Display and Services Market Import-Export Trade Statistics |
7.1 Italy 3D Holographic Display and Services Market Export to Major Countries |
7.2 Italy 3D Holographic Display and Services Market Imports from Major Countries |
8 Italy 3D Holographic Display and Services Market Key Performance Indicators |
8.1 Rate of adoption of 3D holographic display technology across different industries |
8.2 Number of partnerships and collaborations between technology providers and end-users |
8.3 Level of investment in research and development activities focused on improving 3D holographic display technology |
8.4 Customer satisfaction and feedback on the usability and effectiveness of 3D holographic displays |
8.5 Percentage increase in the use of interactive features and applications in 3D holographic displays |
9 Italy 3D Holographic Display and Services Market - Opportunity Assessment |
9.1 Italy 3D Holographic Display and Services Market Opportunity Assessment, By End-users, 2022 & 2032F |
10 Italy 3D Holographic Display and Services Market - Competitive Landscape |
10.1 Italy 3D Holographic Display and Services Market Revenue Share, By Companies, 2025 |
10.2 Italy 3D Holographic Display and Services Market Competitive Benchmarking, By Operating and Technical Parameters |
11 Company Profiles |
12 Recommendations |
13 Disclaimer |
Global Go To Market Strategy - 2030
Export potential enables firms to identify high-growth global markets with greater confidence by combining advanced trade intelligence with a structured quantitative methodology. The framework analyzes emerging demand trends and country-level import patterns while integrating macroeconomic and trade datasets such as GDP and population forecasts, bilateral import–export flows, tariff structures, elasticity differentials between developed and developing economies, geographic distance, and import demand projections. Using weighted trade values from 2020–2024 as the base period to project country-to-country export potential for 2030, these inputs are operationalized through calculated drivers such as gravity model parameters, tariff impact factors, and projected GDP per-capita growth. Through an analysis of hidden potentials, demand hotspots, and market conditions that are most favorable to success, this method enables firms to focus on target countries, maximize returns, and global expansion with data, backed by accuracy.
By factoring in the projected importer demand gap that is currently unmet and could be potential opportunity, it identifies the potential for the Exporter (Country) among 190 countries, against the general trade analysis, which identifies the biggest importer or exporter.
To discover high-growth global markets and optimize your business strategy:
Click Here
Pricing
- Single User License$ 1,995
- Department License$ 2,400
- Site License$ 3,120
- Global License$ 3,795

Leadership Perspectives from Industry Events
Search
Thought Leadership and Analyst Meet


Our Clients
6WResearch In News
- India Air Conditioner Market Set for Strong Rebound in 2026 After Weather-Led Correction and GST-Driven Recovery: 6Wresearch
- ADAS in India: How Automatic Emergency Braking, Blind Spot Detection & Driver Monitoring are Transforming Road Safety
- Doha a strategic location for EV manufacturing hub: IPA Qatar
- Demand for luxury TVs surging in the GCC, says Samsung
- Empowering Growth: The Thriving Journey of Bangladesh’s Cable Industry
- Demand for luxury TVs surging in the GCC, says Samsung
Latest Reports
- Nicaragua RPG Gaming Market (2026-2032)
- New Zealand RPG Gaming Market (2026-2032)
- Netherlands RPG Gaming Market (2026-2032)
- Nauru RPG Gaming Market (2026-2032)
- Namibia RPG Gaming Market (2026-2032)
- Mozambique RPG Gaming Market (2026-2032)
- Montenegro RPG Gaming Market (2026-2032)
- Mongolia RPG Gaming Market (2026-2032)
- Monaco RPG Gaming Market (2026-2032)
- Micronesia RPG Gaming Market (2026-2032)
Industry Events and Analyst Meet

EV India Expo 2026

HIMTEX 2026

India Refining Summit 2026

India EV Show 2026

EV tech India Expo 2026
Whitepaper
- Middle East & Africa Commercial Security Market Click here to view more.
- Middle East & Africa Fire Safety Systems & Equipment Market Click here to view more.
- GCC Drone Market Click here to view more.
- Middle East Lighting Fixture Market Click here to view more.
- GCC Physical & Perimeter Security Market Click here to view more.