Italy Stannic Chloride Market (2026-2032) | Segmentation, Industry, Competitive Landscape, Companies, Outlook, Value, Analysis, Forecast, Growth, Trends, Size & Revenue, Share
Market Forecast By Product Form (Liquid, Solid), By Purity of Product (0.99, Others), By Applications (Electronics, Tinplate, Float Glass, Brass & Bronze), By End-User Industry (Polymers, Agriculture, Pharmaceuticals, Electrical & Electronics, Chemical, Other Industrial), By Product (Stannic Chloride Anhydrate, Stannic Chloride Pentahydrate) And Competitive Landscape
| Product Code: ETC7684342 | Publication Date: Sep 2024 | Updated Date: Apr 2026 | Product Type: Market Research Report | |
| Publisher: 6Wresearch | Author: Summon Dutta | No. of Pages: 75 | No. of Figures: 35 | No. of Tables: 20 |
Italy Stannic Chloride Market Size (2020-2030)
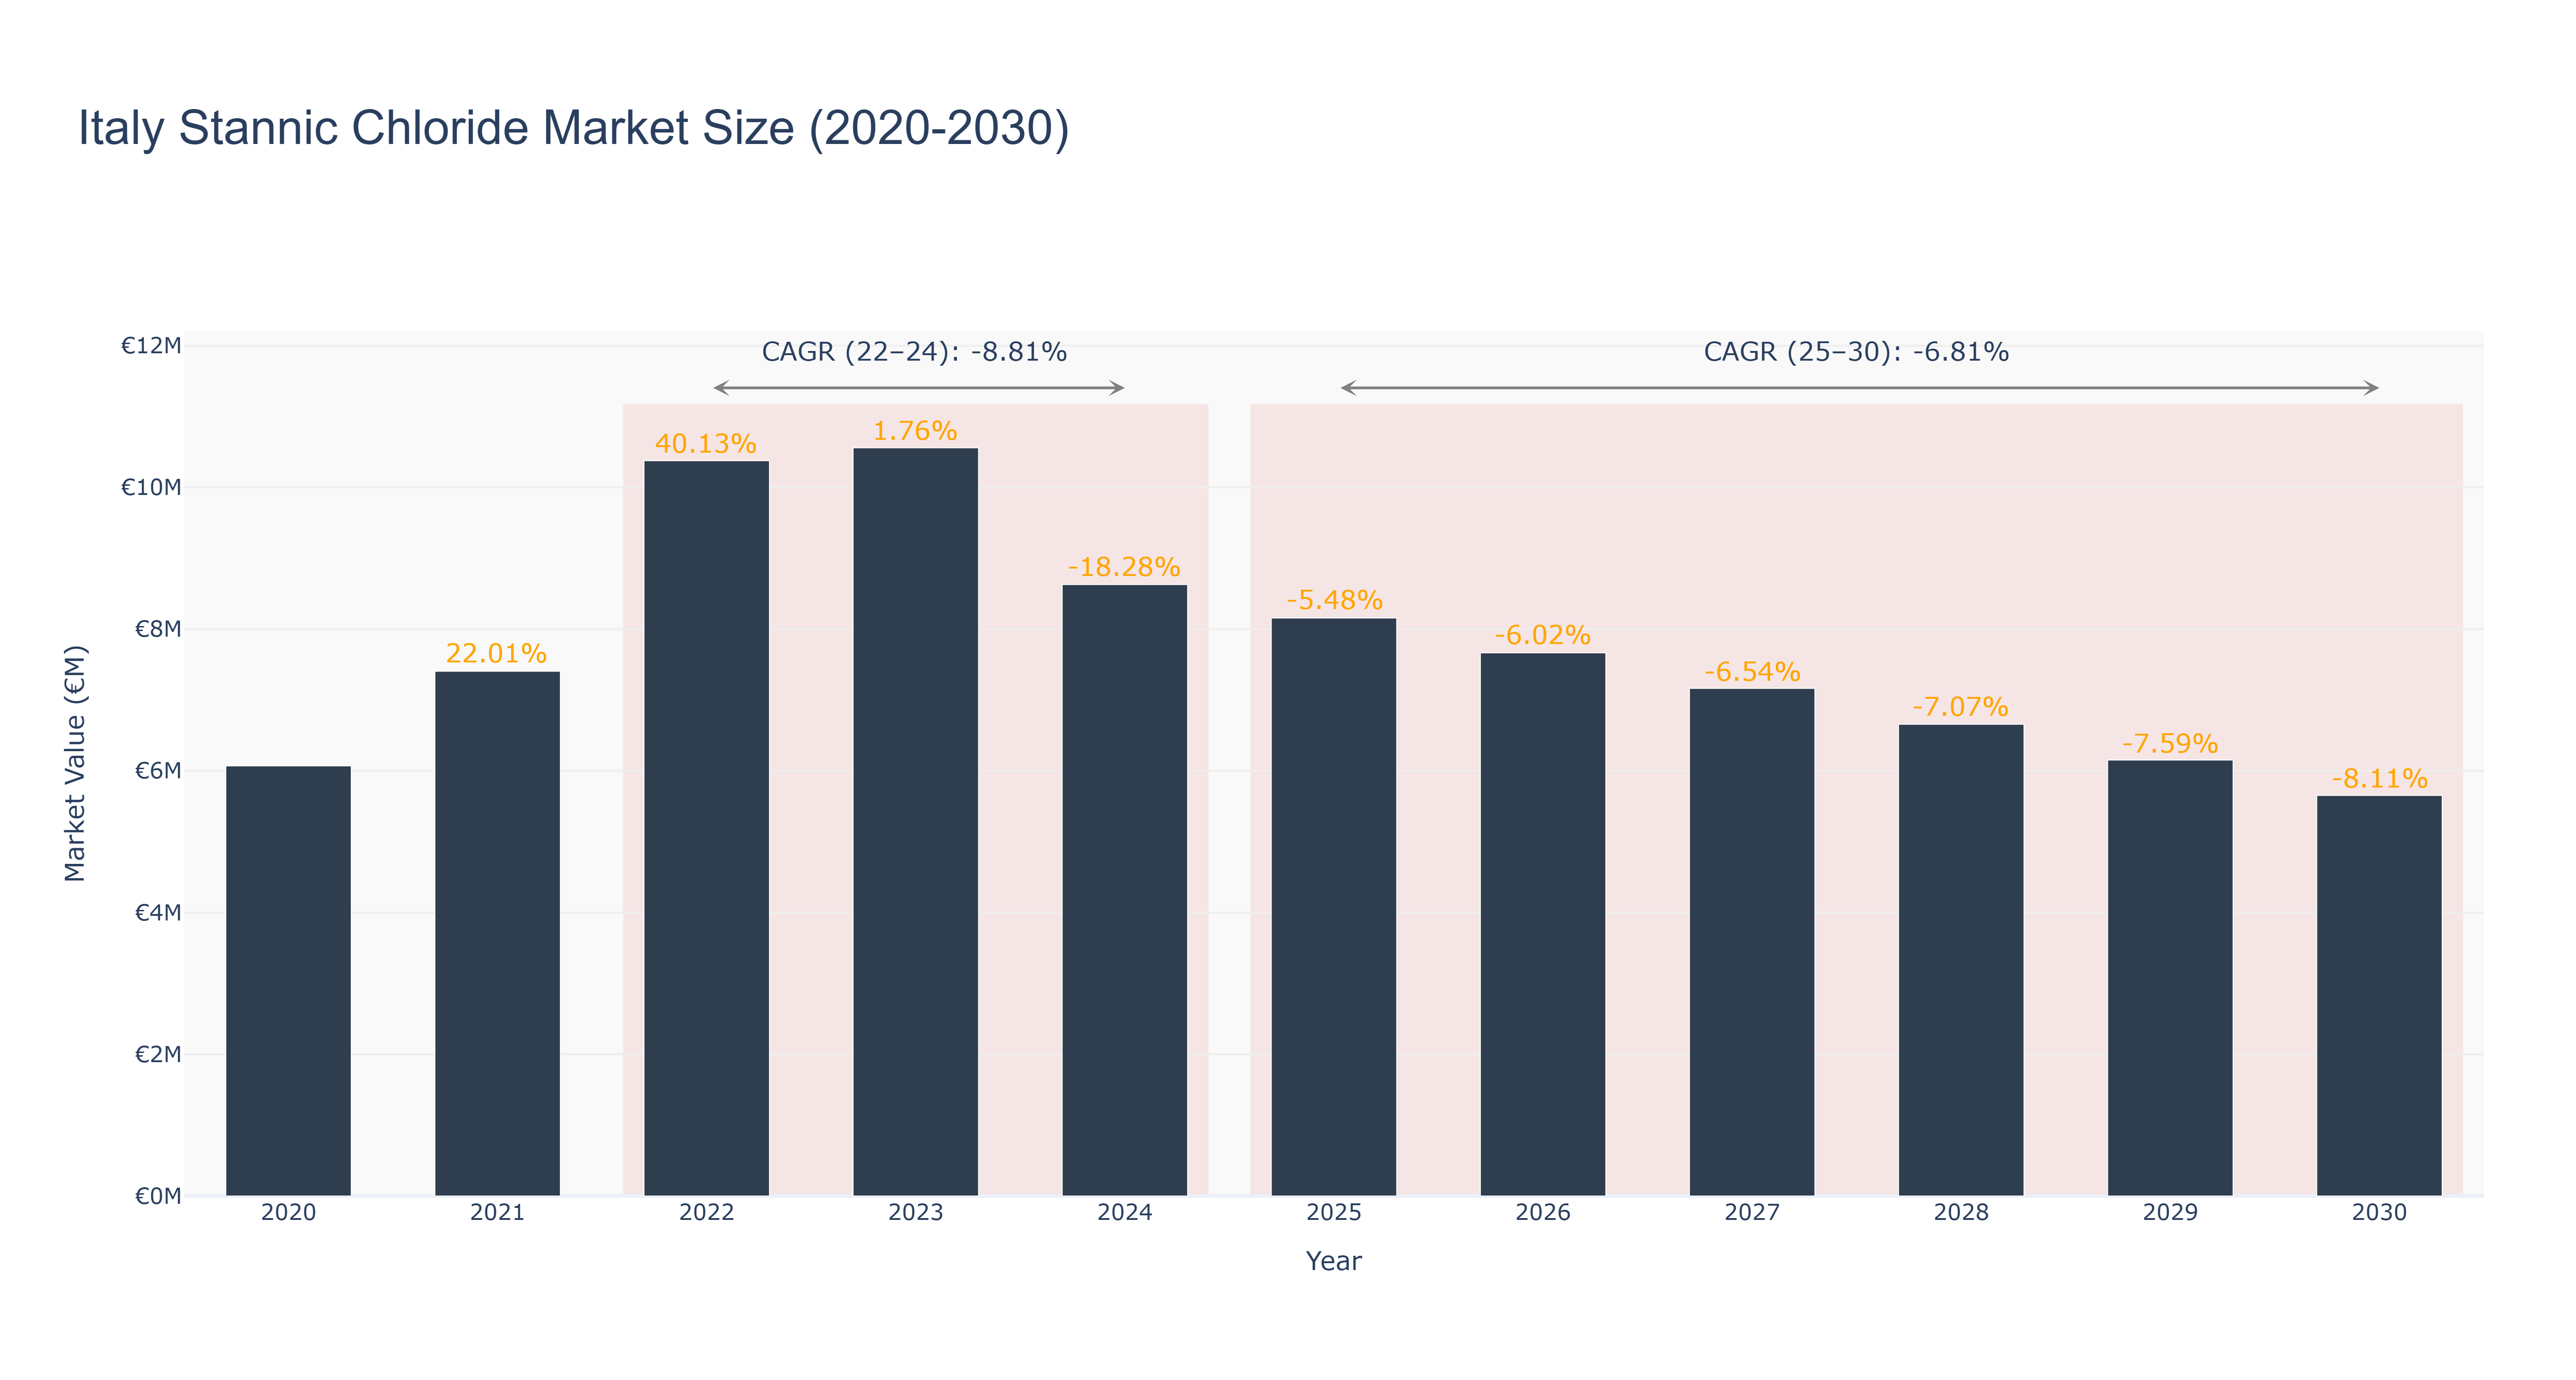
Italy Stannic Chloride Market has shown a fluctuating trend over the years. The peak market size of €10.56 million was recorded in 2023, followed by a decline to €8.63 million in 2024. The market is forecasted to further decrease to €5.65 million by 2030, with a CAGR of -6.81% from 2025 to 2030. The recent negative growth rates can be attributed to various factors such as economic slowdown, changing consumer preferences, and increased competition. Despite the current challenges, the market is expected to witness new projects focusing on sustainability and technological advancements in the near future. These developments aim to enhance product quality and efficiency, potentially driving market growth in the long term. Overall, industry drivers such as environmental regulations and innovation will play a crucial role in shaping the future trajectory of the Italy Stannic Chloride Market.
Italy Stannic Chloride Market: Production & Trade Performance (2019-2025)
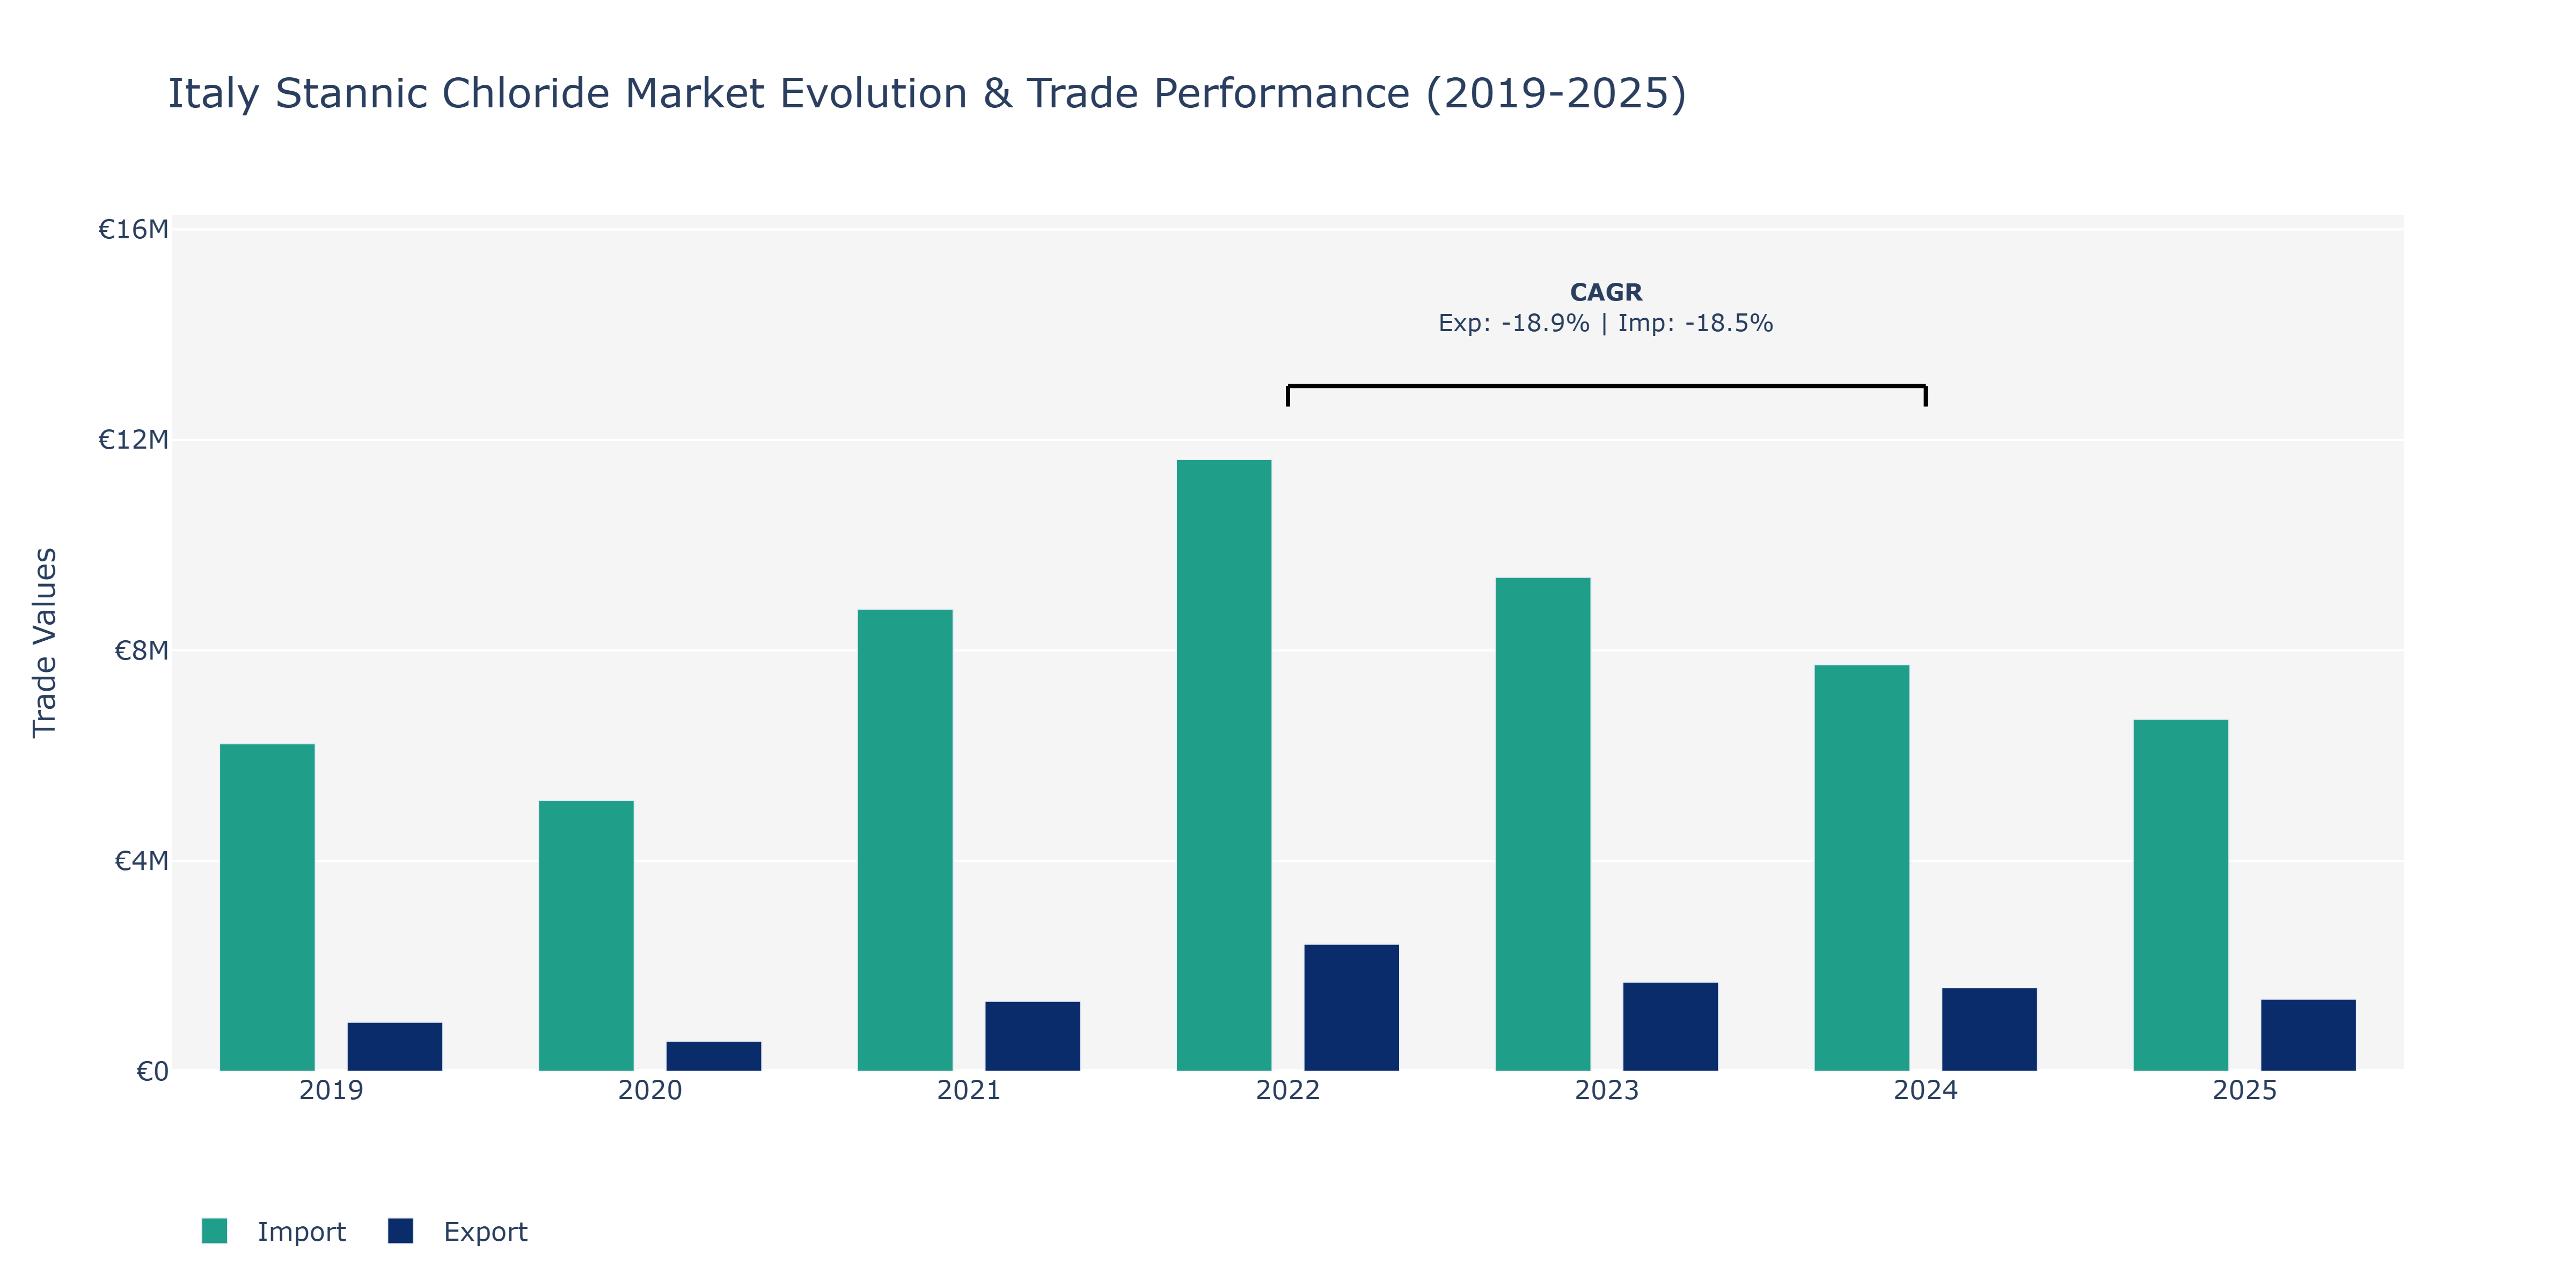
In the Italy Stannic Chloride Market, exports exhibited a fluctuating trend from 2019 to 2025, with a peak value of €2.41 million in 2022. However, the exports declined to €1.58 million in 2024 before showing a slight increase in 2025 to €1.37 million. Imports, on the other hand, consistently increased from €6.22 million in 2019 to €11.63 million in 2022, marking a peak point. Subsequently, imports saw a decline to €7.73 million in 2024 and further decreased to €6.69 million in 2025. The fluctuations in exports and imports can be attributed to various factors such as changes in global demand for stannic chloride, shifts in manufacturing locations, price fluctuations in raw materials, and regulatory changes impacting trade agreements. The negative export and import CAGRs of around -18% from 2022 to 2024 reflect the market's challenges in adapting to evolving trade dynamics and economic conditions in the industry.
Key Highlights of the Report:
- Italy Stannic Chloride Market Outlook
- Market Size of Italy Stannic Chloride Market, 2025
- Forecast of Italy Stannic Chloride Market, 2032
- Historical Data and Forecast of Italy Stannic Chloride Revenues & Volume for the Period 2022-2032F
- Italy Stannic Chloride Market Trend Evolution
- Italy Stannic Chloride Market Drivers and Challenges
- Italy Stannic Chloride Price Trends
- Italy Stannic Chloride Porter's Five Forces
- Italy Stannic Chloride Industry Life Cycle
- Historical Data and Forecast of Italy Stannic Chloride Market Revenues & Volume By Product Form for the Period 2022-2032F
- Historical Data and Forecast of Italy Stannic Chloride Market Revenues & Volume By Liquid for the Period 2022-2032F
- Historical Data and Forecast of Italy Stannic Chloride Market Revenues & Volume By Solid for the Period 2022-2032F
- Historical Data and Forecast of Italy Stannic Chloride Market Revenues & Volume By Purity of Product for the Period 2022-2032F
- Historical Data and Forecast of Italy Stannic Chloride Market Revenues & Volume By 0.99 for the Period 2022-2032F
- Historical Data and Forecast of Italy Stannic Chloride Market Revenues & Volume By Others for the Period 2022-2032F
- Historical Data and Forecast of Italy Stannic Chloride Market Revenues & Volume By Applications for the Period 2022-2032F
- Historical Data and Forecast of Italy Stannic Chloride Market Revenues & Volume By Electronics for the Period 2022-2032F
- Historical Data and Forecast of Italy Stannic Chloride Market Revenues & Volume By Tinplate for the Period 2022-2032F
- Historical Data and Forecast of Italy Stannic Chloride Market Revenues & Volume By Float Glass for the Period 2022-2032F
- Historical Data and Forecast of Italy Stannic Chloride Market Revenues & Volume By Brass & Bronze for the Period 2022-2032F
- Historical Data and Forecast of Italy Stannic Chloride Market Revenues & Volume By End-User Industry for the Period 2022-2032F
- Historical Data and Forecast of Italy Stannic Chloride Market Revenues & Volume By Polymers for the Period 2022-2032F
- Historical Data and Forecast of Italy Stannic Chloride Market Revenues & Volume By Agriculture for the Period 2022-2032F
- Historical Data and Forecast of Italy Stannic Chloride Market Revenues & Volume By Pharmaceuticals for the Period 2022-2032F
- Historical Data and Forecast of Italy Stannic Chloride Market Revenues & Volume By Electrical & Electronics for the Period 2022-2032F
- Historical Data and Forecast of Italy Stannic Chloride Market Revenues & Volume By Chemical for the Period 2022-2032F
- Historical Data and Forecast of Italy Stannic Chloride Market Revenues & Volume By Other Industrial for the Period 2022-2032F
- Historical Data and Forecast of Italy Stannic Chloride Market Revenues & Volume By Product for the Period 2022-2032F
- Historical Data and Forecast of Italy Stannic Chloride Market Revenues & Volume By Stannic Chloride Anhydrate for the Period 2022-2032F
- Historical Data and Forecast of Italy Stannic Chloride Market Revenues & Volume By Stannic Chloride Pentahydrate for the Period 2022-2032F
- Italy Stannic Chloride Import Export Trade Statistics
- Market Opportunity Assessment By Product Form
- Market Opportunity Assessment By Purity of Product
- Market Opportunity Assessment By Applications
- Market Opportunity Assessment By End-User Industry
- Market Opportunity Assessment By Product
- Italy Stannic Chloride Top Companies Market Share
- Italy Stannic Chloride Competitive Benchmarking By Technical and Operational Parameters
- Italy Stannic Chloride Company Profiles
- Italy Stannic Chloride Key Strategic Recommendations
Frequently Asked Questions About the Market Study (FAQs):
6Wresearch actively monitors the Italy Stannic Chloride Market and publishes its comprehensive annual report, highlighting emerging trends, growth drivers, revenue analysis, and forecast outlook. Our insights help businesses to make data-backed strategic decisions with ongoing market dynamics. Our analysts track relevent industries related to the Italy Stannic Chloride Market, allowing our clients with actionable intelligence and reliable forecasts tailored to emerging regional needs.
Yes, we provide customisation as per your requirements. To learn more, feel free to contact us on sales@6wresearch.com
1 Executive Summary |
2 Introduction |
2.1 Key Highlights of the Report |
2.2 Report Description |
2.3 Market Scope & Segmentation |
2.4 Research Methodology |
2.5 Assumptions |
3 Italy Stannic Chloride Market Overview |
3.1 Italy Country Macro Economic Indicators |
3.2 Italy Stannic Chloride Market Revenues & Volume, 2022 & 2032F |
3.3 Italy Stannic Chloride Market - Industry Life Cycle |
3.4 Italy Stannic Chloride Market - Porter's Five Forces |
3.5 Italy Stannic Chloride Market Revenues & Volume Share, By Product Form, 2022 & 2032F |
3.6 Italy Stannic Chloride Market Revenues & Volume Share, By Purity of Product, 2022 & 2032F |
3.7 Italy Stannic Chloride Market Revenues & Volume Share, By Applications, 2022 & 2032F |
3.8 Italy Stannic Chloride Market Revenues & Volume Share, By End-User Industry, 2022 & 2032F |
3.9 Italy Stannic Chloride Market Revenues & Volume Share, By Product, 2022 & 2032F |
4 Italy Stannic Chloride Market Dynamics |
4.1 Impact Analysis |
4.2 Market Drivers |
4.2.1 Increasing demand for stannic chloride in the electronics industry for manufacturing semiconductors and electronic components. |
4.2.2 Growth in the chemical industry in Italy, leading to higher consumption of stannic chloride in the production of various chemicals. |
4.2.3 Rising focus on sustainable practices and environmentally friendly solutions, driving the adoption of stannic chloride in green technologies. |
4.3 Market Restraints |
4.3.1 Fluctuating prices of raw materials used in the production of stannic chloride impacting profit margins. |
4.3.2 Stringent regulations and compliance standards related to chemical manufacturing and handling, increasing operational costs for stannic chloride producers. |
5 Italy Stannic Chloride Market Trends |
6 Italy Stannic Chloride Market, By Types |
6.1 Italy Stannic Chloride Market, By Product Form |
6.1.1 Overview and Analysis |
6.1.2 Italy Stannic Chloride Market Revenues & Volume, By Product Form, 2022-2032F |
6.1.3 Italy Stannic Chloride Market Revenues & Volume, By Liquid, 2022-2032F |
6.1.4 Italy Stannic Chloride Market Revenues & Volume, By Solid, 2022-2032F |
6.2 Italy Stannic Chloride Market, By Purity of Product |
6.2.1 Overview and Analysis |
6.2.2 Italy Stannic Chloride Market Revenues & Volume, By 0.99, 2022-2032F |
6.2.3 Italy Stannic Chloride Market Revenues & Volume, By Others, 2022-2032F |
6.3 Italy Stannic Chloride Market, By Applications |
6.3.1 Overview and Analysis |
6.3.2 Italy Stannic Chloride Market Revenues & Volume, By Electronics, 2022-2032F |
6.3.3 Italy Stannic Chloride Market Revenues & Volume, By Tinplate, 2022-2032F |
6.3.4 Italy Stannic Chloride Market Revenues & Volume, By Float Glass, 2022-2032F |
6.3.5 Italy Stannic Chloride Market Revenues & Volume, By Brass & Bronze, 2022-2032F |
6.4 Italy Stannic Chloride Market, By End-User Industry |
6.4.1 Overview and Analysis |
6.4.2 Italy Stannic Chloride Market Revenues & Volume, By Polymers, 2022-2032F |
6.4.3 Italy Stannic Chloride Market Revenues & Volume, By Agriculture, 2022-2032F |
6.4.4 Italy Stannic Chloride Market Revenues & Volume, By Pharmaceuticals, 2022-2032F |
6.4.5 Italy Stannic Chloride Market Revenues & Volume, By Electrical & Electronics, 2022-2032F |
6.4.6 Italy Stannic Chloride Market Revenues & Volume, By Chemical, 2022-2032F |
6.4.7 Italy Stannic Chloride Market Revenues & Volume, By Other Industrial, 2022-2032F |
6.5 Italy Stannic Chloride Market, By Product |
6.5.1 Overview and Analysis |
6.5.2 Italy Stannic Chloride Market Revenues & Volume, By Stannic Chloride Anhydrate, 2022-2032F |
6.5.3 Italy Stannic Chloride Market Revenues & Volume, By Stannic Chloride Pentahydrate, 2022-2032F |
7 Italy Stannic Chloride Market Import-Export Trade Statistics |
7.1 Italy Stannic Chloride Market Export to Major Countries |
7.2 Italy Stannic Chloride Market Imports from Major Countries |
8 Italy Stannic Chloride Market Key Performance Indicators |
8.1 Percentage of stannic chloride used in the production of advanced electronic devices. |
8.2 Number of new applications of stannic chloride in different industries. |
8.3 Rate of adoption of stannic chloride in eco-friendly products and technologies. |
8.4 Research and development investment in innovative stannic chloride production processes. |
9 Italy Stannic Chloride Market - Opportunity Assessment |
9.1 Italy Stannic Chloride Market Opportunity Assessment, By Product Form, 2022 & 2032F |
9.2 Italy Stannic Chloride Market Opportunity Assessment, By Purity of Product, 2022 & 2032F |
9.3 Italy Stannic Chloride Market Opportunity Assessment, By Applications, 2022 & 2032F |
9.4 Italy Stannic Chloride Market Opportunity Assessment, By End-User Industry, 2022 & 2032F |
9.5 Italy Stannic Chloride Market Opportunity Assessment, By Product, 2022 & 2032F |
10 Italy Stannic Chloride Market - Competitive Landscape |
10.1 Italy Stannic Chloride Market Revenue Share, By Companies, 2025 |
10.2 Italy Stannic Chloride Market Competitive Benchmarking, By Operating and Technical Parameters |
11 Company Profiles |
12 Recommendations |
13 Disclaimer |
Export potential assessment - trade Analytics for 2030
Export potential enables firms to identify high-growth global markets with greater confidence by combining advanced trade intelligence with a structured quantitative methodology. The framework analyzes emerging demand trends and country-level import patterns while integrating macroeconomic and trade datasets such as GDP and population forecasts, bilateral import–export flows, tariff structures, elasticity differentials between developed and developing economies, geographic distance, and import demand projections. Using weighted trade values from 2020–2024 as the base period to project country-to-country export potential for 2030, these inputs are operationalized through calculated drivers such as gravity model parameters, tariff impact factors, and projected GDP per-capita growth. Through an analysis of hidden potentials, demand hotspots, and market conditions that are most favorable to success, this method enables firms to focus on target countries, maximize returns, and global expansion with data, backed by accuracy.
By factoring in the projected importer demand gap that is currently unmet and could be potential opportunity, it identifies the potential for the Exporter (Country) among 190 countries, against the general trade analysis, which identifies the biggest importer or exporter.
To discover high-growth global markets and optimize your business strategy:
Click Here
Pricing
- Single User License$ 1,995
- Department License$ 2,400
- Site License$ 3,120
- Global License$ 3,795

Search
Thought Leadership and Analyst Meet


Our Clients
Latest Reports
- India Ultrasonic Smart Water Meter Market (2026-2032) | Outlook, Competition, Drivers, Trends, Demand, Competitive, Strategic Insights, Companies, Challenges, Strategy, Consumer Insights, Analysis, Opportunities, Growth, Size, Share, Industry, Revenue, Segments, Value, Segmentation, Supply, Forecast, Restraints,
- India Electromagnetic Bulk Flow Meter Market (2026-2032) | Analysis, Challenges, Strategic Insights, Supply, Forecast, Growth, Share, Consumer Insights, Competitive, Value, Outlook, Size & Demand,
- India Battery Powered Bulk Flow Meter Market (2026-2032) | Outlook, Analysis, Competitive Landscape, Growth, Size, Trends, Value, Revenue, Companies, Segmentation, Share & Forecast
- Bosnia and Herzegovina Fuel-Efficient Winglets Market (2026-2032) | Growth, Competition, Strategy, Restraints, Trends, Challenges, segmentation, Value, Outlook, Investment Opportunities, Analysis, Revenue, Companies, Insights, Pricing, Size, Drivers, Demand, Share, Forecast
- Canada Cloud CFD Market (2026-2032) | Size & Revenue, Industry, Growth, Competitive Landscape, Forecast, Segmentation, Value, Outlook, Trends, Share, Analysis, Companies
- Taiwan Food Delivery Platform Market (2026-2032) | Companies, Outlook, Analysis, Trends, Value, Revenue, Segmentation, Share, Forecast, Competitive Landscape, Growth, Size & Forecast
- United Kingdom (UK) Long-term Care Insurance Market (2026-2032) | Growth, Share, Consumer Insights, Drivers, Opportunities, Competition, Pricing Analysis, Segments, Restraints, Companies, Competitive, Value, Outlook, Size, Demand, Analysis, Challenges, Strategic Insights, Investment Trends, Revenue, Trends, Supply, Forecast
- United Kingdom (UK) Long Term Care Market (2026-2032) | Companies, Outlook, Analysis, Trends, Value, Revenue, Segmentation, Share, Forecast, Competitive Landscape, Growth, Size & Forecast
- Iraq Insulation and Waterproofing Market (2026-2032) | Outlook, Drivers, Growth, Size, Share, Industry, Revenue, Trends, Demand, Competitive, Strategic Insights, Opportunities, Segments, Companies, Challenges, Strategy, Consumer Insights, Analysis, Investment Trends, Value, Segmentation, Forecast, Restraints
- India Switchgear Market Outlook (2026-2032) | Size, Share, Trends, Growth, Revenue, Forecast, Analysis, Value, Outlook
Industry Events and Analyst Meet

India EV Show 2026

EV tech India Expo 2026

Auto Tech Asia 2026

Battery Tech India 2026

Smart Production Solutions Guangzhou 2026
Whitepaper
- Middle East & Africa Commercial Security Market Click here to view more.
- Middle East & Africa Fire Safety Systems & Equipment Market Click here to view more.
- GCC Drone Market Click here to view more.
- Middle East Lighting Fixture Market Click here to view more.
- GCC Physical & Perimeter Security Market Click here to view more.
6WResearch In News
- Doha a strategic location for EV manufacturing hub: IPA Qatar
- Demand for luxury TVs surging in the GCC, says Samsung
- Empowering Growth: The Thriving Journey of Bangladesh’s Cable Industry
- Demand for luxury TVs surging in the GCC, says Samsung
- Video call with a traditional healer? Once unthinkable, it’s now common in South Africa
- Intelligent Buildings To Smooth GCC’s Path To Net Zero