Japan Family Entertainment Center Market Size & Growth Rate
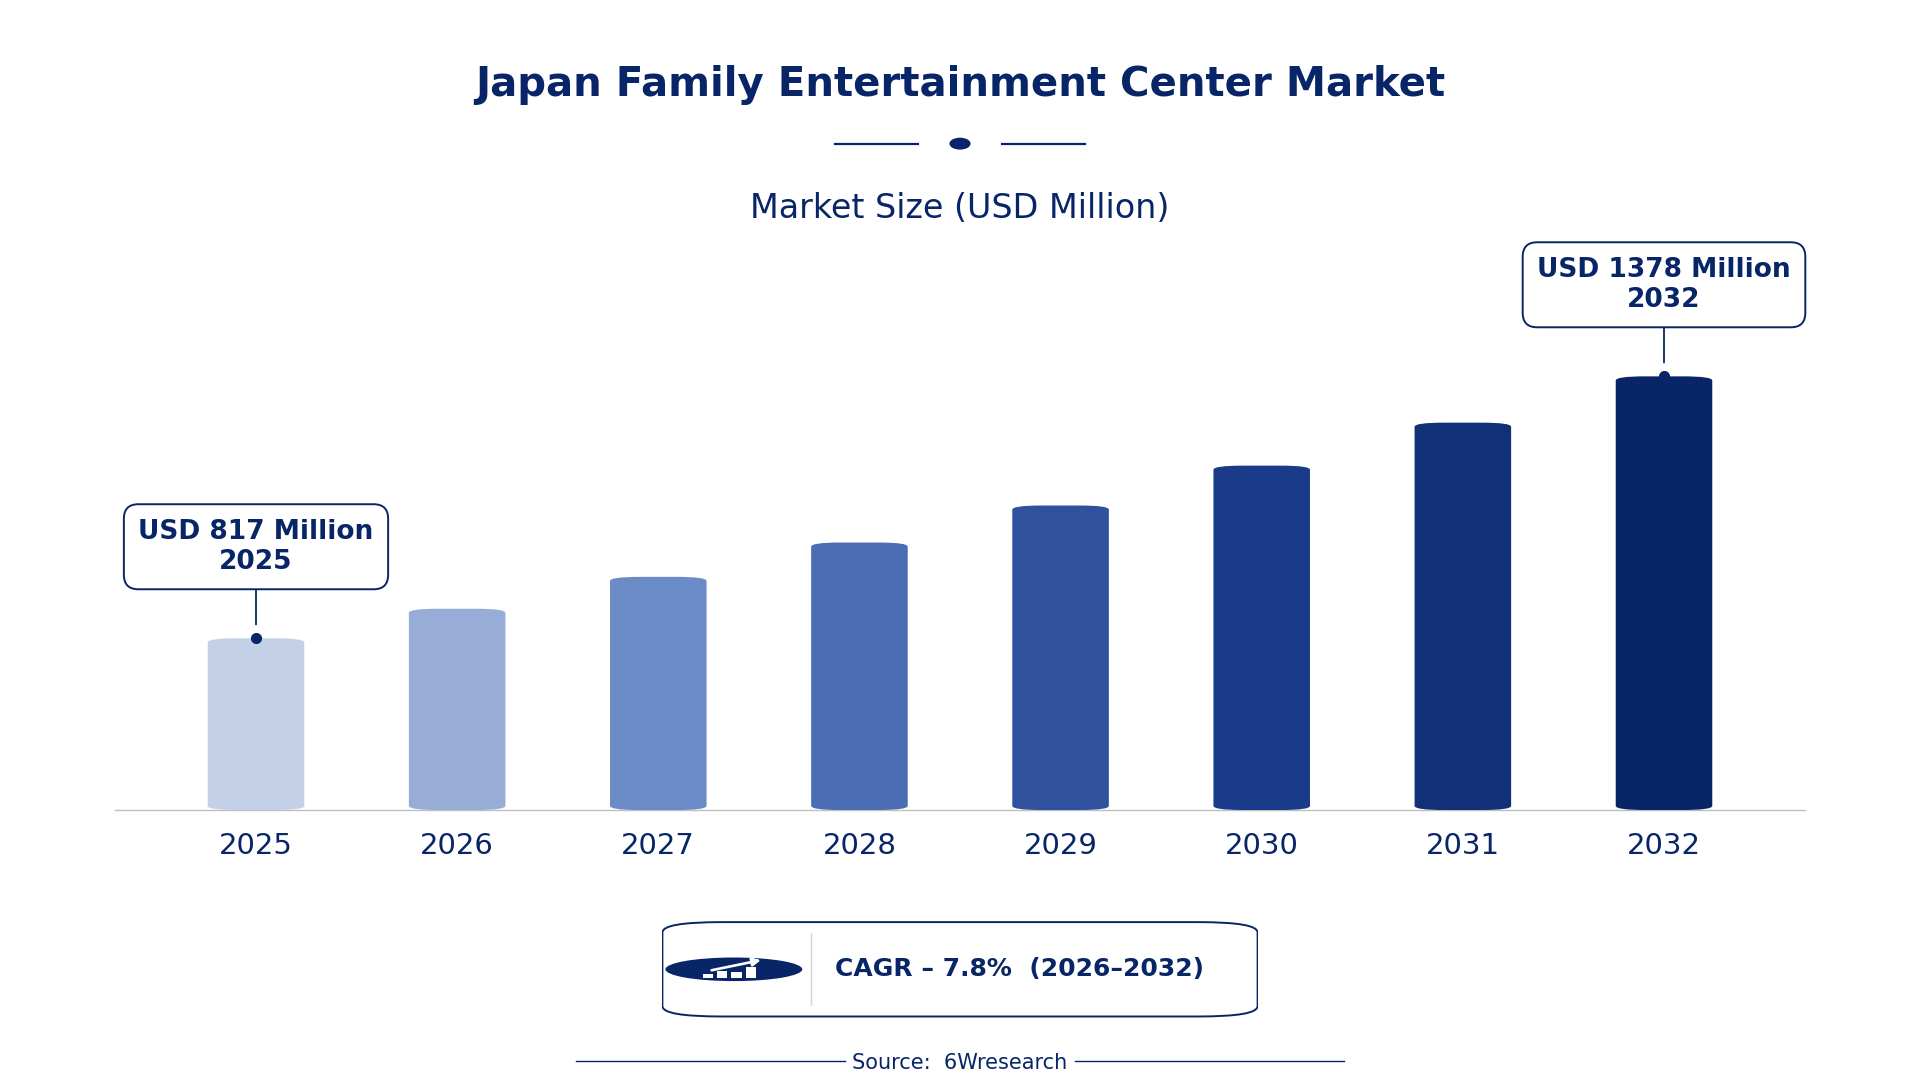
According to 6Wresearch internal database and industry insights, the Japan Family Entertainment Center Market was valued at USD 817 Million in 2025 and is projected to reach USD 1,378 Million by 2032, growing at a CAGR of approximately 7.8% during 2026–2032.
Japan Family Entertainment Center Market Highlights
| Report Metric | Details |
| Report Name | Japan Family Entertainment Center Market (2026-2032) |
| Market Size 2025 | USD 817 Million |
| Market Size 2032 | USD 1,378 Million |
| Absolute Growth 2025–2032 | USD 561 Million |
| CAGR 2026–2032 | 7.8% |
| Peak Annual Growth | 8.4% in 2032 |
| Forecast Period | 2026–2032 |
| Historical Data | 2022–2025 |
| Base Year | 2025 |
| Leading Product Type, 2025 | Arcade Games (40% share) |
| Leading Technology Type, 2025 | Digital Scoring Systems (42% share) |
| Leading End User, 2025 | Families with Children (35% share) |
| Leading Application, 2025 | Interactive Entertainment (40% share) |
| Fastest-Growing Product Type | Laser Tag (10.9% CAGR) |
| Fastest-Growing Technology Type | VR/AR Technology (11.4% CAGR) |
| Fastest-Growing End User | Parents with Toddlers (10.2% CAGR) |
| Fastest-Growing Application | Social and Competitive Activities (10.8% CAGR) |
| Growing Sector | family entertainment |
| Key End Users | families with children, parents with toddlers, family visitors, teenagers and young adults |
Japan Family Entertainment Center Market Year-wise Growth Rate and Key Drivers (2022–2032)
This graph illustrates the annual growth rates of the market from 2022 to 2032, highlighting a steady upward trajectory and projected market expansion over the forecast period.
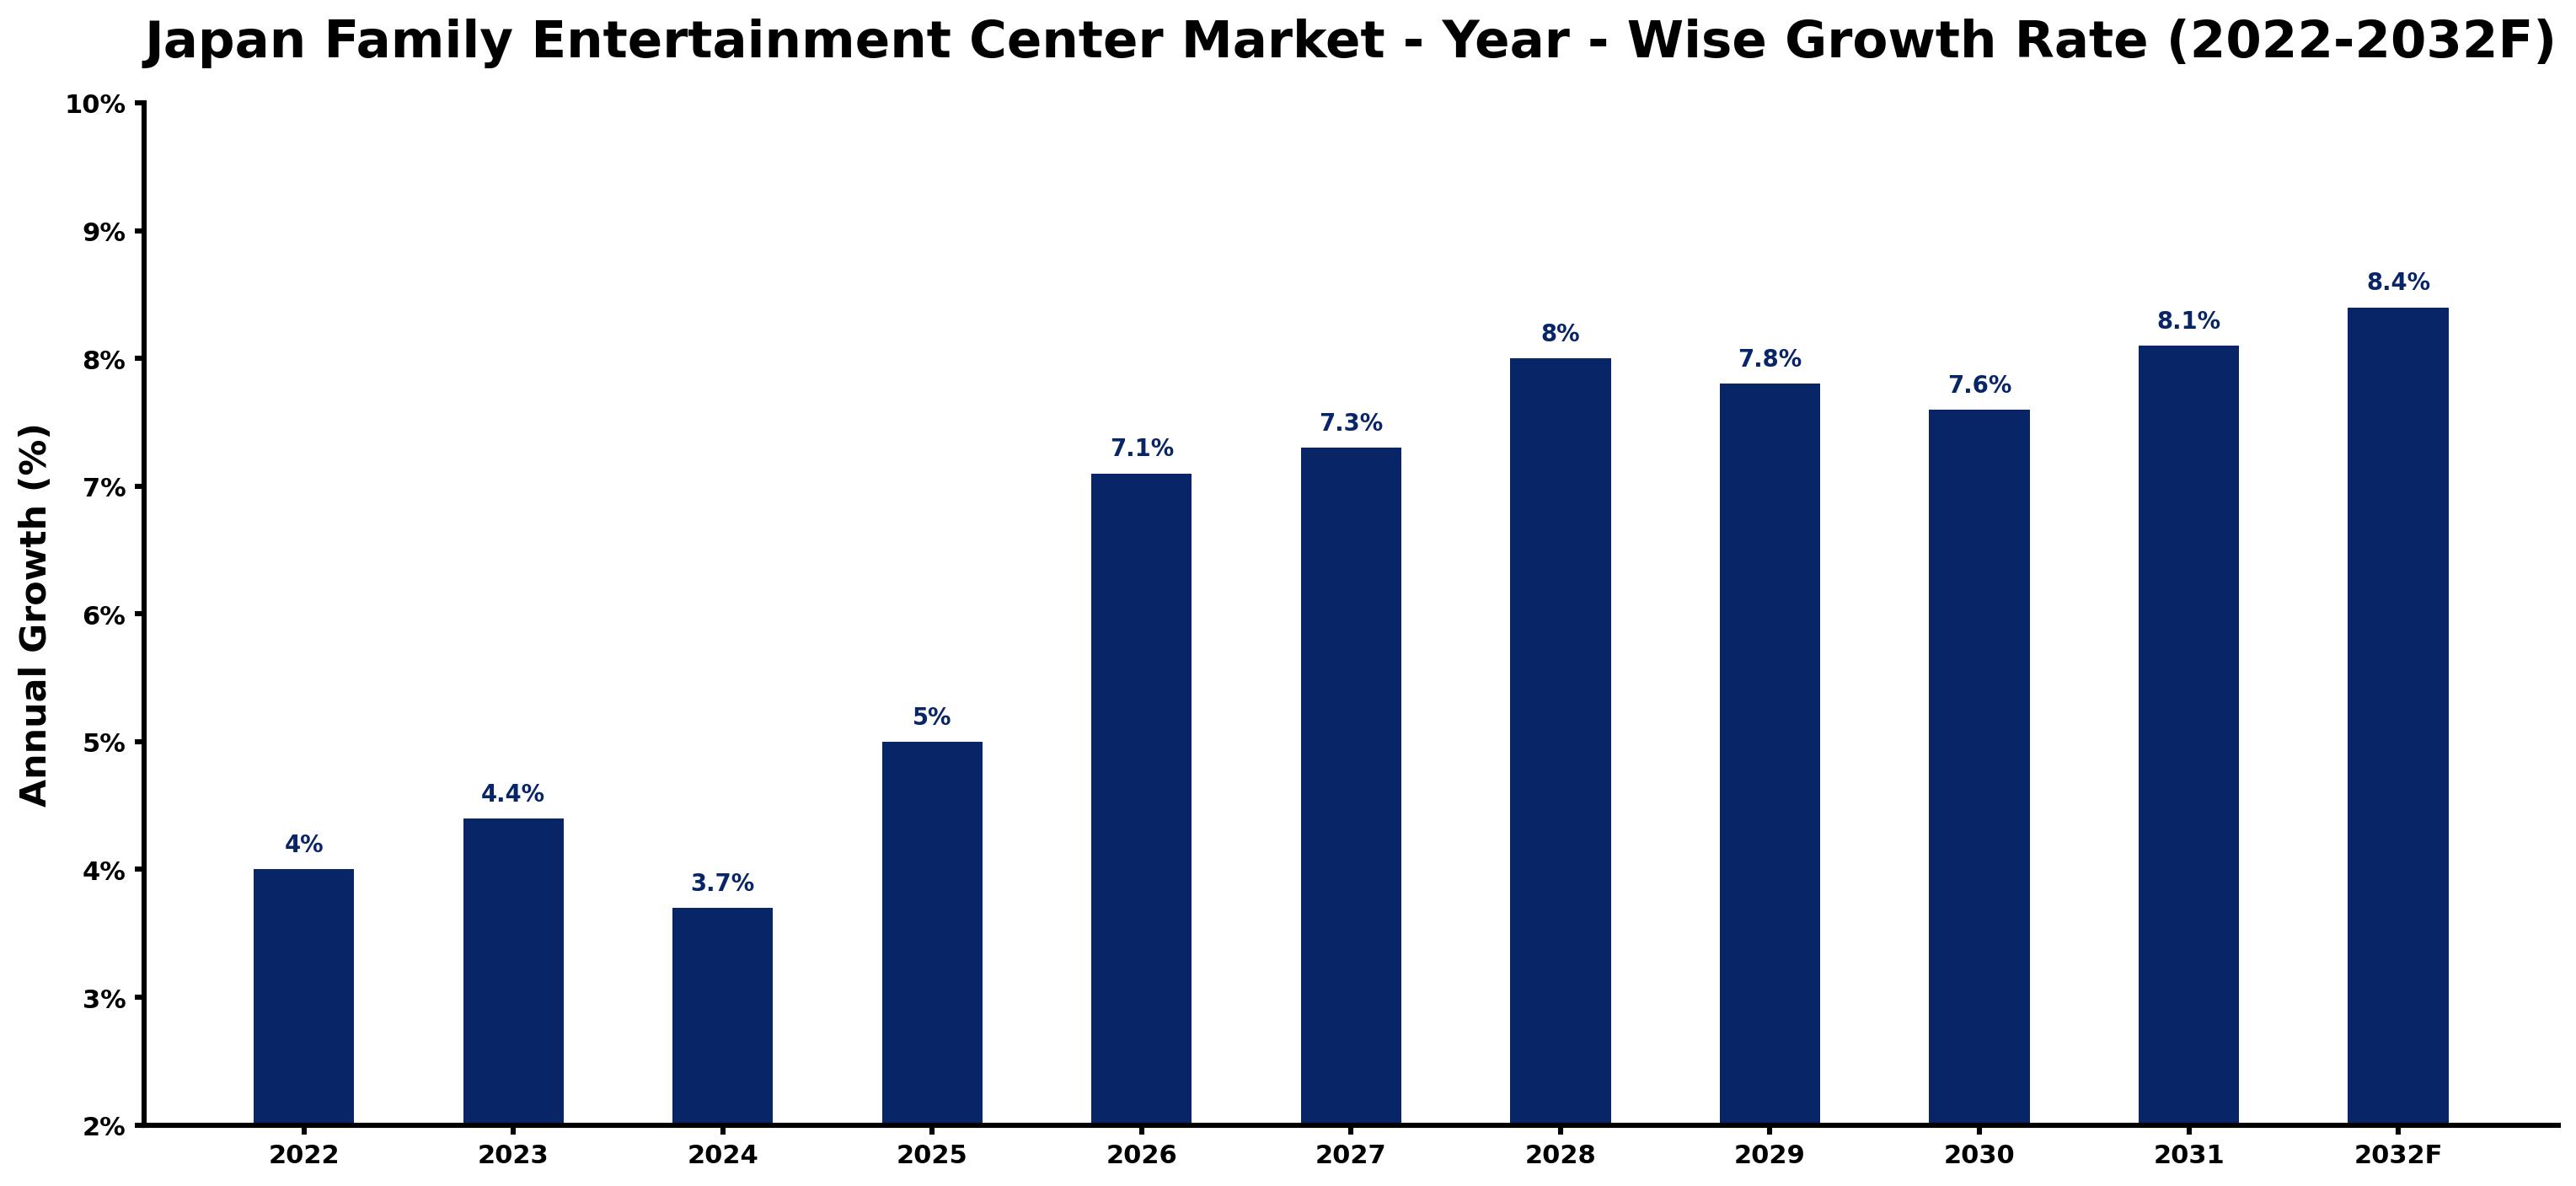
For each year, the table pairs the estimated growth rate with the leading influence on demand, showing how the drivers changed across the period.
| Year | Estimated Annual Growth (%) | Market Rationale |
| 2022 | 4.0 | The market experienced steady growth, reflecting ongoing interest in family entertainment options. |
| 2023 | 4.4 | Growth accelerated as families sought leisure activities, boosting visitor numbers. |
| 2024 | 3.7 | The growth rate slowed slightly as competition increased among entertainment venues. |
| 2025 | 5.0 | A resurgence in family outings contributed to a faster growth rate compared to the previous year. |
| 2026 | 7.1 | Demand is expected to rise sharply as new attractions and technologies are introduced in Family Entertainment Centers. |
| 2027 | 7.3 | The market will continue to expand with increasing family participation in recreational activities. |
| 2028 | 8.0 | Growth is projected to accelerate again, driven by innovations in interactive entertainment offerings. |
| 2029 | 7.8 | The growth rate will slow as market saturation begins to affect new visitor numbers. |
| 2030 | 7.6 | A slight slowdown is expected as economic factors influence discretionary spending. |
| 2031 | 8.1 | The market is projected to rebound with renewed interest in family-friendly entertainment options. |
| 2032 | 8.4 | The peak growth rate will be achieved as demand for immersive experiences surges. |
Note: Market size estimations and growth projections presented in this report are based on 6Wresearch's proprietary forecasting methodology, utilizing the latest available industry data, government publications, and primary research inputs.
Japan Family Entertainment Center Market Synopsis
Family Entertainment Centers (FECs) in Japan provide diverse recreational options, including arcade games, bowling alleys, and indoor playgrounds, designed for family enjoyment. The Tokyo region, with its high concentration of FECs, showcases the sector's growth, driven by approximately 12 million children aged 0-14. Factors such as the introduction of digital scoring systems and the popularity of laser tag facilities are stimulating investments and increasing visitor engagement, making this market a vibrant sector within Japan's leisure industry.
Market Dynamics Impact Analysis (2026–2032)
| Factor | Type | Impact | Primary Segment Affected |
| The rise in family participation in leisure activities drives demand for FECs. | Driver | High | Families with Children |
| The growing popularity of interactive entertainment options creates new attractions. | Driver | High | Interactive Entertainment |
| The increasing number of children aged 0-14 presents a significant market opportunity. | Opportunity | High | Indoor Playgrounds |
| Urban areas are seeing a rise in demand for eco-friendly entertainment options. | Opportunity | Medium | Bowling Alleys |
| High operational costs can limit the profitability of new FECs. | Restraint | High | Arcade Games |
| Intense competition among FECs can lead to price wars, affecting margins. | Restraint | Medium | Laser Tag |
| High initial investment costs deter new entrants into the market. | Challenge | High | Indoor Playgrounds |
| Technological advancements require continuous upgrades, increasing operational complexity. | Challenge | Medium | Digital Scoring Systems |
Evaluation of Drivers in Japan Family Entertainment Center Market (2026–2032)
The main growth drivers and the segments they affect most are set out below.
| Drivers | Primary Segment Affected | Why It Matters (Evidence) |
| Increased family outings to FECs are driving demand for recreational activities. | Families with Children | Japan's population of children aged 0-14 is approximately 12 million, leading families to seek leisure options. |
| The incorporation of digital scoring systems attracts more visitors to FECs. | Digital Scoring Systems | These systems are standard in bowling alleys, drawing families looking for engaging experiences. |
| The popularity of laser tag facilities is rising in urban areas. | Laser Tag | Urban Family Entertainment Centers are increasingly integrating laser tag, appealing to families seeking competitive fun. |
| Indoor playgrounds cater to the needs of parents with toddlers. | Indoor Playgrounds | Designed for children aged 2-12 years, these areas attract families looking for safe play environments. |
| Innovations in VR/AR technology are appealing to tech-savvy families. | VR/AR Technology | These technologies are being integrated into FECs, drawing families eager for immersive entertainment. |
The strongest pull on demand comes from the Tokyo region, where the population of children aged 0-14 is approximately 12 million. This demographic drives families to seek engaging recreational activities, leading to increased visits to Family Entertainment Centers. Digital scoring systems are standard in bowling alleys, attracting more visitors and improving the gaming experience. The popularity of laser tag facilities is rising, particularly in urban centers, as families look for competitive fun. Indoor playgrounds designed for children aged 2-12 years cater to parents seeking safe environments for play. Innovations in VR/AR technology are also being integrated into FECs, appealing to families eager for immersive experiences.
Evaluation of Restraints in Japan Family Entertainment Center Market
These restraints slow adoption and weigh on supplier margins.
| Market Restraint | Primary Segment Affected | Why It Matters (Evidence) |
| High operational costs can limit the profitability of new FECs. | Arcade Games | Operational costs in urban areas can exceed 30% of revenue, impacting new FEC viability. |
| Intense competition among FECs can lead to price wars, affecting margins. | Laser Tag | With numerous venues competing, price reductions can squeeze profit margins. |
| Regulatory compliance can increase operational costs for FECs. | Indoor Playgrounds | Safety-Centric Design standards mandate significant investments in child safety features. |
| Market saturation may hinder new visitor growth. | Families with Children | An abundance of FECs in urban areas can limit unique offerings, reducing appeal. |
| Supply chain disruptions can delay technology installations. | VR/AR Technology | Shortages in semiconductor components can postpone the rollout of advanced gaming systems. |
Japan Family Entertainment Center Market Challenges
Family visitors face stiff competition among over 500 Family Entertainment Centers in major cities, particularly in Tokyo, leading operators to reduce prices and squeezing profit margins. Compliance with JIS standards for safety features raises operational costs for suppliers, which can delay the opening of new facilities and restrict the variety of attractions. Increasing costs for eco-friendly materials add to the burden on suppliers, resulting in higher prices for FECs and raising the average spend per family to 5,000 yen per visit. Supply chain disruptions for advanced technology components can further impede timely installations, limiting the offerings available to families.
Trends in the Japan Family Entertainment Center Market
The following changes are redrawing the Japan Family Entertainment Center Market.
- Shift Towards Eco-Friendly Practices: In 2023, Family Entertainment Centers are increasingly incorporating eco-friendly practices, responding to consumer demand for sustainability. Approximately 30% of new FECs are adopting green technologies, such as energy-efficient lighting and waste reduction strategies.
- Growing Popularity of Laser Tag: Laser tag facilities are becoming increasingly popular in urban Family Entertainment Centers, with a 15% rise in installations in 2023. This trend reflects families' desire for competitive and engaging activities.
- Expansion of Indoor Playgrounds: Indoor playgrounds are being designed with advanced safety features, catering to children aged 2-12 years. In 2023, over 500 such playgrounds are operational across Japan, highlighting their importance in FEC offerings.
- Adoption of Digital Scoring Systems: Digital scoring systems are becoming standard in bowling alleys within FECs, attracting more family visitors. Approximately 80% of bowling alleys now feature these systems, improving the gaming experience.
Investment Opportunities in the Japan Family Entertainment Center Market
Investors looking at the Japan Family Entertainment Center Market should consider the following areas.
- Ideal Timing for New FEC Investments: With the growing number of children aged 0-14, this is an optimal time to invest in new Family Entertainment Centers. Urban areas, particularly Tokyo, exhibit high demand for family-friendly venues, with potential returns on investment exceeding 20%.
- Expansion of Indoor Playgrounds: The need for safe play areas for young children opens up opportunities for new indoor playgrounds. Family visitors in urban regions are actively seeking these facilities, making it a promising investment area.
- Integration of VR/AR Technology: The rising interest in immersive experiences offers Family Entertainment Centers the chance to incorporate VR/AR technology. Urban FECs can attract tech-savvy families by providing unique entertainment options.
- Development of Themed Bowling Alleys: Themed bowling alleys are becoming popular, appealing to families in search of unique experiences. Urban areas are well-suited for these developments, with potential to significantly boost visitor engagement.
Government Initiatives in the Japan Family Entertainment Center Market
The Semiconductor and Digital Industry Strategy launched in June 2021 aims to secure domestic semiconductor manufacturing, impacting Family Entertainment Centers by ensuring reliable technology supply. This strategy supports the integration of advanced gaming technologies, improving visitor experiences.
In 2023, the Tokyo Metropolitan Government initiated a subsidy program for new Family Entertainment Centers, administered by the Tokyo Metropolitan Bureau of Economy and Industry. This program provides financial support for up to 50% of initial setup costs, encouraging the development of family-friendly venues.
Future Insight of the Japan Family Entertainment Center Market
New indoor playgrounds are expected to emerge by 2032, improving family experiences in Family Entertainment Centers. The government's 2023 initiative to promote family-friendly entertainment venues is likely to stimulate investment in diverse attractions, benefiting both buyers and suppliers. As the average visit duration for families remains around 2-3 hours, FECs will concentrate on creating engaging experiences during this time. By 2032, the average spend per family at FECs is projected to reach 6,000 yen per visit, reflecting the growing demand for varied entertainment options.
Market Segmentation Analysis
Japan Family Entertainment Center Market report covers a detailed analysis of the following market segments:
By Product Type – Arcade Games Lead, Laser Tag Expected to Grow Fastest
According to Vasudha, AM at 6Wresearch, Arcade Games held 40% of the Japan Family Entertainment Center Market by product type in 2025. Arcade games serve as the main draw in Family Entertainment Centers, appealing to families looking for enjoyable recreational options. With over 500 arcade game machines in major cities, they cater to diverse interests, ensuring steady visitor numbers. Laser Tag is projected to grow fastest, at a CAGR of 10.9% during 2026–2032. Laser tag is quickly becoming a favourite among families seeking competitive fun, with urban areas increasingly adding these attractions. This growth indicates a shift towards more interactive leisure experiences. Suppliers should focus on creating a variety of engaging arcade games to maintain their leading position.
By Technology Type – Digital Scoring Systems Lead, VR/AR Technology Expected to Grow Fastest
With 42% of technology type revenue in 2025, Digital Scoring Systems was the largest category. Digital scoring systems play a vital role in tracking scores during games, making them a standard component in Family Entertainment Centers. Their extensive implementation enhances the competitive atmosphere for families participating in various activities. VR/AR Technology is set to record the highest CAGR in this split, 11.4% over 2026–2032. VR/AR technology is being rapidly adopted to improve the gaming experience, attracting families who desire immersive entertainment. This trend highlights a rising demand for advanced technological features in leisure facilities. Buyers ought to invest in venues that incorporate cutting-edge technology to draw in more visitors.
By End User – Families with Children Leads, Parents with Toddlers Expected to Grow Fastest
Families with Children took 35% of end user revenue in 2025, more than any other category. Families with children represent the primary target audience for Family Entertainment Centers, as they seek recreational activities suitable for all ages. This demographic drives the demand for safe and engaging environments tailored to family needs. Over 2026–2032, Parents with Toddlers are expected to post the fastest growth, at a CAGR of 10.2%. Parents with toddlers are increasingly looking for safe play areas, leading to a rise in demand for facilities that cater specifically to this age group. This focus on safety and age-appropriate activities is likely to accelerate growth in this segment. Suppliers should consider developing tailored offerings that address the specific needs of parents with toddlers.
By Application – Interactive Entertainment Leads, Social and Competitive Activities Expected to Grow Fastest
Interactive Entertainment accounted for 40% of the market by application in 2025. Interactive entertainment is the core offering of Family Entertainment Centers, engaging visitors through various activities that promote family bonding. This focus on interaction ensures a consistent influx of families seeking enjoyable experiences. The quickest growth will come from Social and Competitive Activities, forecast to expand at a CAGR of 10.8% between 2026 and 2032. Social and competitive activities are becoming main attractions for visitors, as families seek engaging ways to spend time together. The increasing popularity of these activities suggests a shift towards more dynamic offerings in FECs. Suppliers should prioritise the development of social and competitive activities to meet the evolving preferences of family visitors.
Key Attractiveness of the Report
- 10 Years of Market Numbers
- Historical Data Starting from 2022 to 2025
- Base Year 2025
- Forecast Data until 2032
- Key Performance Indicators Impacting the Market
- Major Upcoming Developments and Projects
Key Highlights of the Report:
- Japan Family Entertainment Center Market Outlook
- Market Size of Japan Family Entertainment Center Market,2025
- Forecast of Japan Family Entertainment Center Market, 2032
- Historical Data and Forecast of Japan Family Entertainment Center Revenues & Volume for the Period 2022-2032
- Japan Family Entertainment Center Market Trend Evolution
- Japan Family Entertainment Center Market Drivers and Challenges
- Japan Family Entertainment Center Price Trends
- Japan Family Entertainment Center Porter's Five Forces
- Japan Family Entertainment Center Industry Life Cycle
- Historical Data and Forecast of Japan Family Entertainment Center Market Revenues & Volume By Product Type for the Period 2022-2032
- Historical Data and Forecast of Japan Family Entertainment Center Market Revenues & Volume By Arcade Games for the Period 2022-2032
- Historical Data and Forecast of Japan Family Entertainment Center Market Revenues & Volume By Bowling Alleys for the Period 2022-2032
- Historical Data and Forecast of Japan Family Entertainment Center Market Revenues & Volume By Laser Tag for the Period 2022-2032
- Historical Data and Forecast of Japan Family Entertainment Center Market Revenues & Volume By Indoor Playgrounds for the Period 2022-2032
- Historical Data and Forecast of Japan Family Entertainment Center Market Revenues & Volume By Technology Type for the Period 2022-2032
- Historical Data and Forecast of Japan Family Entertainment Center Market Revenues & Volume By VR/AR Technology for the Period 2022-2032
- Historical Data and Forecast of Japan Family Entertainment Center Market Revenues & Volume By Digital Scoring Systems for the Period 2022-2032
- Historical Data and Forecast of Japan Family Entertainment Center Market Revenues & Volume By Laser Technology for the Period 2022-2032
- Historical Data and Forecast of Japan Family Entertainment Center Market Revenues & Volume By Safety-Centric Design for the Period 2022-2032
- Historical Data and Forecast of Japan Family Entertainment Center Market Revenues & Volume By End User for the Period 2022-2032
- Historical Data and Forecast of Japan Family Entertainment Center Market Revenues & Volume By Families with Children for the Period 2022-2032
- Historical Data and Forecast of Japan Family Entertainment Center Market Revenues & Volume By Family Visitors for the Period 2022-2032
- Historical Data and Forecast of Japan Family Entertainment Center Market Revenues & Volume By Teenagers and Young Adults for the Period 2022-2032
- Historical Data and Forecast of Japan Family Entertainment Center Market Revenues & Volume By Parents with Toddlers for the Period 2022-2032
- Historical Data and Forecast of Japan Family Entertainment Center Market Revenues & Volume By Application for the Period 2022-2032
- Historical Data and Forecast of Japan Family Entertainment Center Market Revenues & Volume By Interactive Entertainment for the Period 2022-2032
- Historical Data and Forecast of Japan Family Entertainment Center Market Revenues & Volume By Social and Competitive Activities for the Period 2022-2032
- Historical Data and Forecast of Japan Family Entertainment Center Market Revenues & Volume By Family-Friendly Competitive Games for the Period 2022-2032
- Historical Data and Forecast of Japan Family Entertainment Center Market Revenues & Volume By Children's Play and Fun Activities for the Period 2022-2032
- Japan Family Entertainment Center Import Export Trade Statistics
- Market Opportunity Assessment By Product Type
- Market Opportunity Assessment By Technology Type
- Market Opportunity Assessment By End User
- Market Opportunity Assessment By Application
- Japan Family Entertainment Center Top Companies Market Share
- Japan Family Entertainment Center Competitive Benchmarking By Technical and Operational Parameters
- Japan Family Entertainment Center Company Profiles
- Japan Family Entertainment Center Key Strategic Recommendations
Market Covered
The report covers the following segments.
By Product Type
- Arcade Games
- Bowling Alleys
- Laser Tag
- Indoor Playgrounds
By Technology Type
- VR/AR Technology
- Digital Scoring Systems
- Laser Technology
- Safety-Centric Design
By End User
- Families with Children
- Family Visitors
- Teenagers and Young Adults
- Parents with Toddlers
By Application
- Interactive Entertainment
- Social and Competitive Activities
- Family-Friendly Competitive Games
- Children™s Play and Fun Activities































