Japan Organic Chemicals Market | Size, Companies, Forecast, Revenue, Industry, COVID-19 IMPACT, Share, Growth, Trends, Analysis, Value & Outlook
Market Forecast By Source (Natural, Synthetic), By Product Type (Acetic acid, Ethyl alcohol, Methanol, Formaldehyde, Aldehydes, Citric acid, Ketones, Others), By End-use (Pharmaceuticals, Pesticides, Agrochemicals, Plastics and polymers, Cosmetics, Food & Beverages, Others) And Competitive Landscape
| Product Code: ETC171041 | Publication Date: Jan 2022 | Updated Date: Oct 2025 | Product Type: Market Research Report | |
| Publisher: 6Wresearch | Author: Ravi Bhandari | No. of Pages: 70 | No. of Figures: 35 | No. of Tables: 5 |
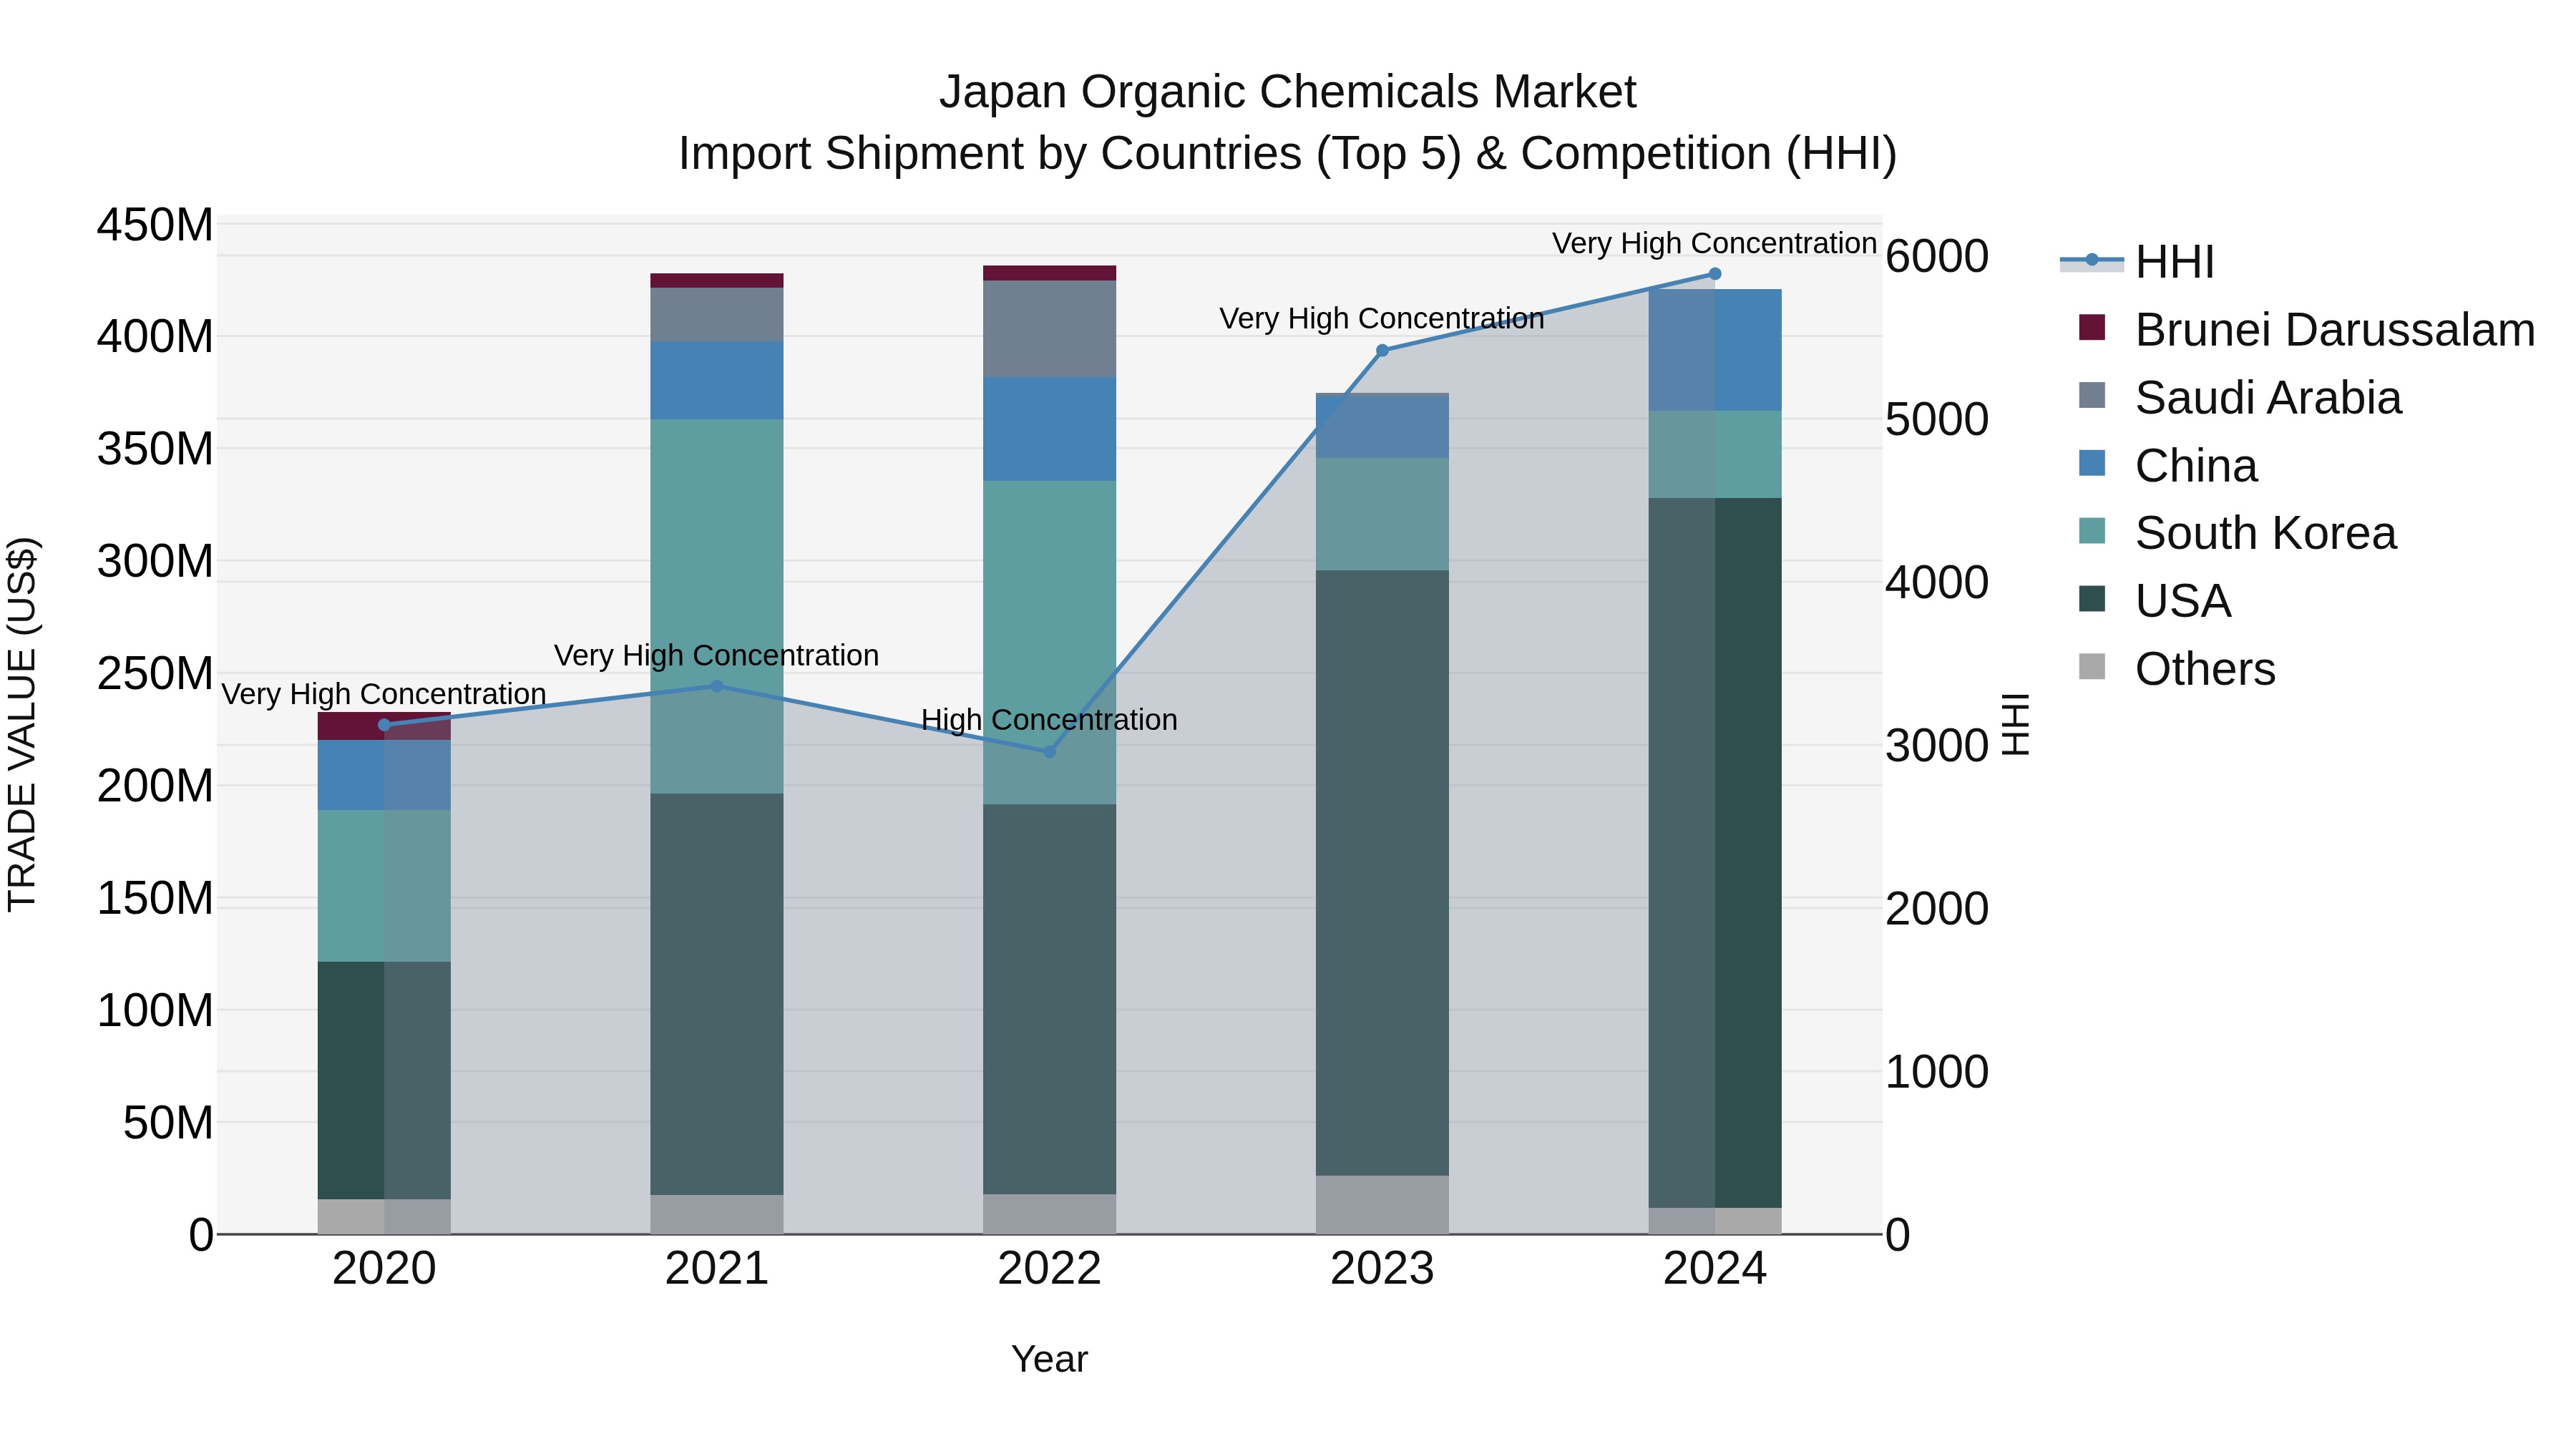
Japan Organic Chemicals Market Import Shipment by Countries (Top 5) & Competition (HHI)
In 2024, Japan's organic chemicals import market continued to show strong growth, with a high Herfindahl-Hirschman Index (HHI) indicating significant market concentration. The top exporting countries to Japan, including the USA, China, South Korea, Germany, and New Zealand, played a key role in supplying organic chemicals. The compound annual growth rate (CAGR) from 2020 to 2024 stood at an impressive 15.98%, with a notable growth rate of 12.25% from 2023 to 2024, reflecting sustained demand and ongoing trade relationships in the organic chemicals sector.
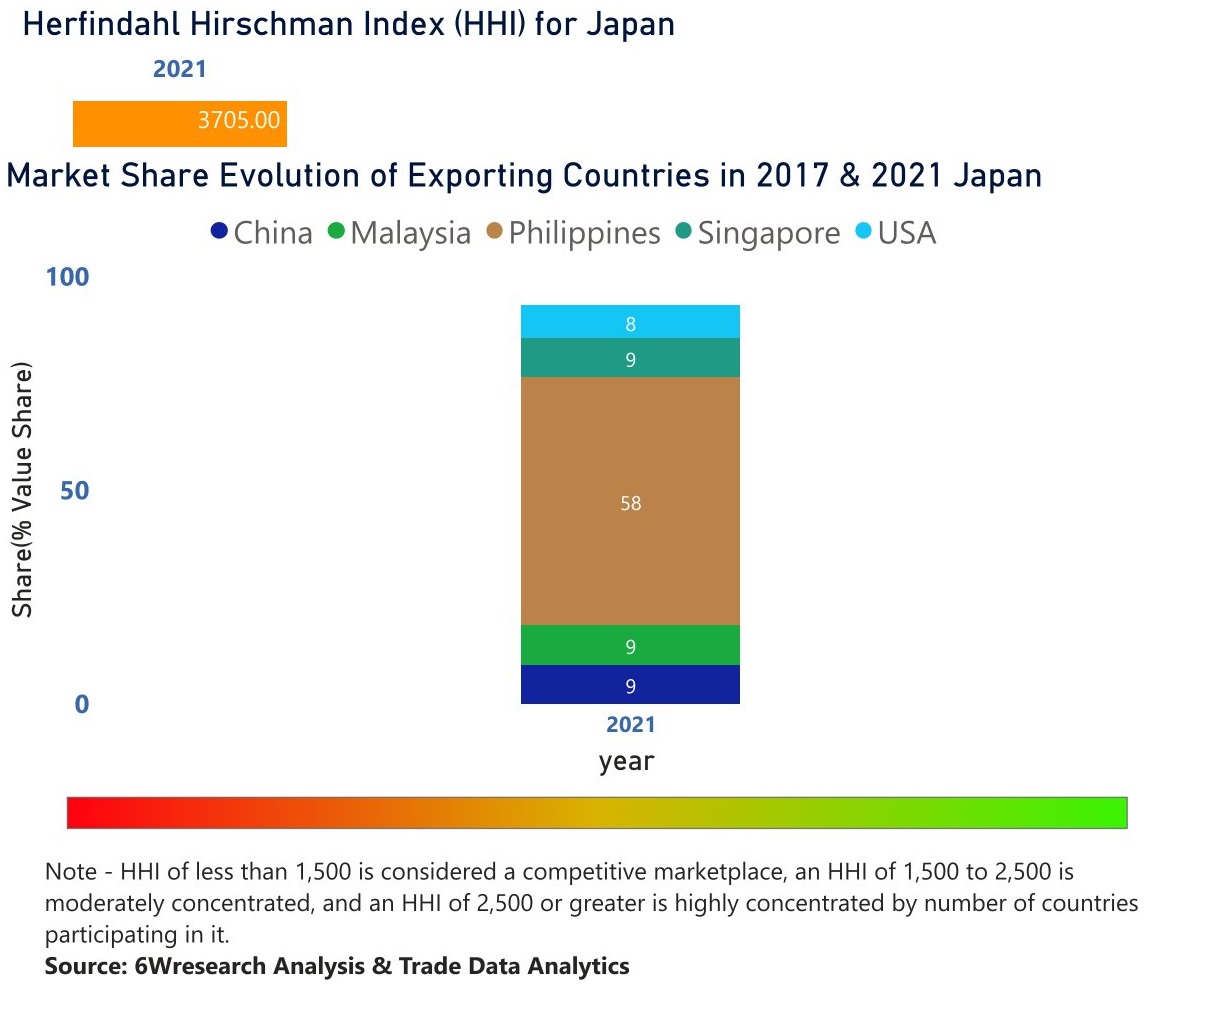
Japan Organic Chemicals Market | Country-Wise Share and Competition Analysis
In the year 2021, Philippines was the largest exporter in terms of value, followed by Malaysia. It has registered a growth of 12.28% over the previous year. While Malaysia registered a decline of -73.48% as compare to the previous year. In the year 2017 Philippines was the largest exporter followed by USA. In term of Herfindahl Index, which measures the competitiveness of countries exporting, Japan has the Herfindahl index of 4522 in 2017 which signifies high concentration also in 2021 it registered a Herfindahl index of 3705 which signifies high concentration in the market.
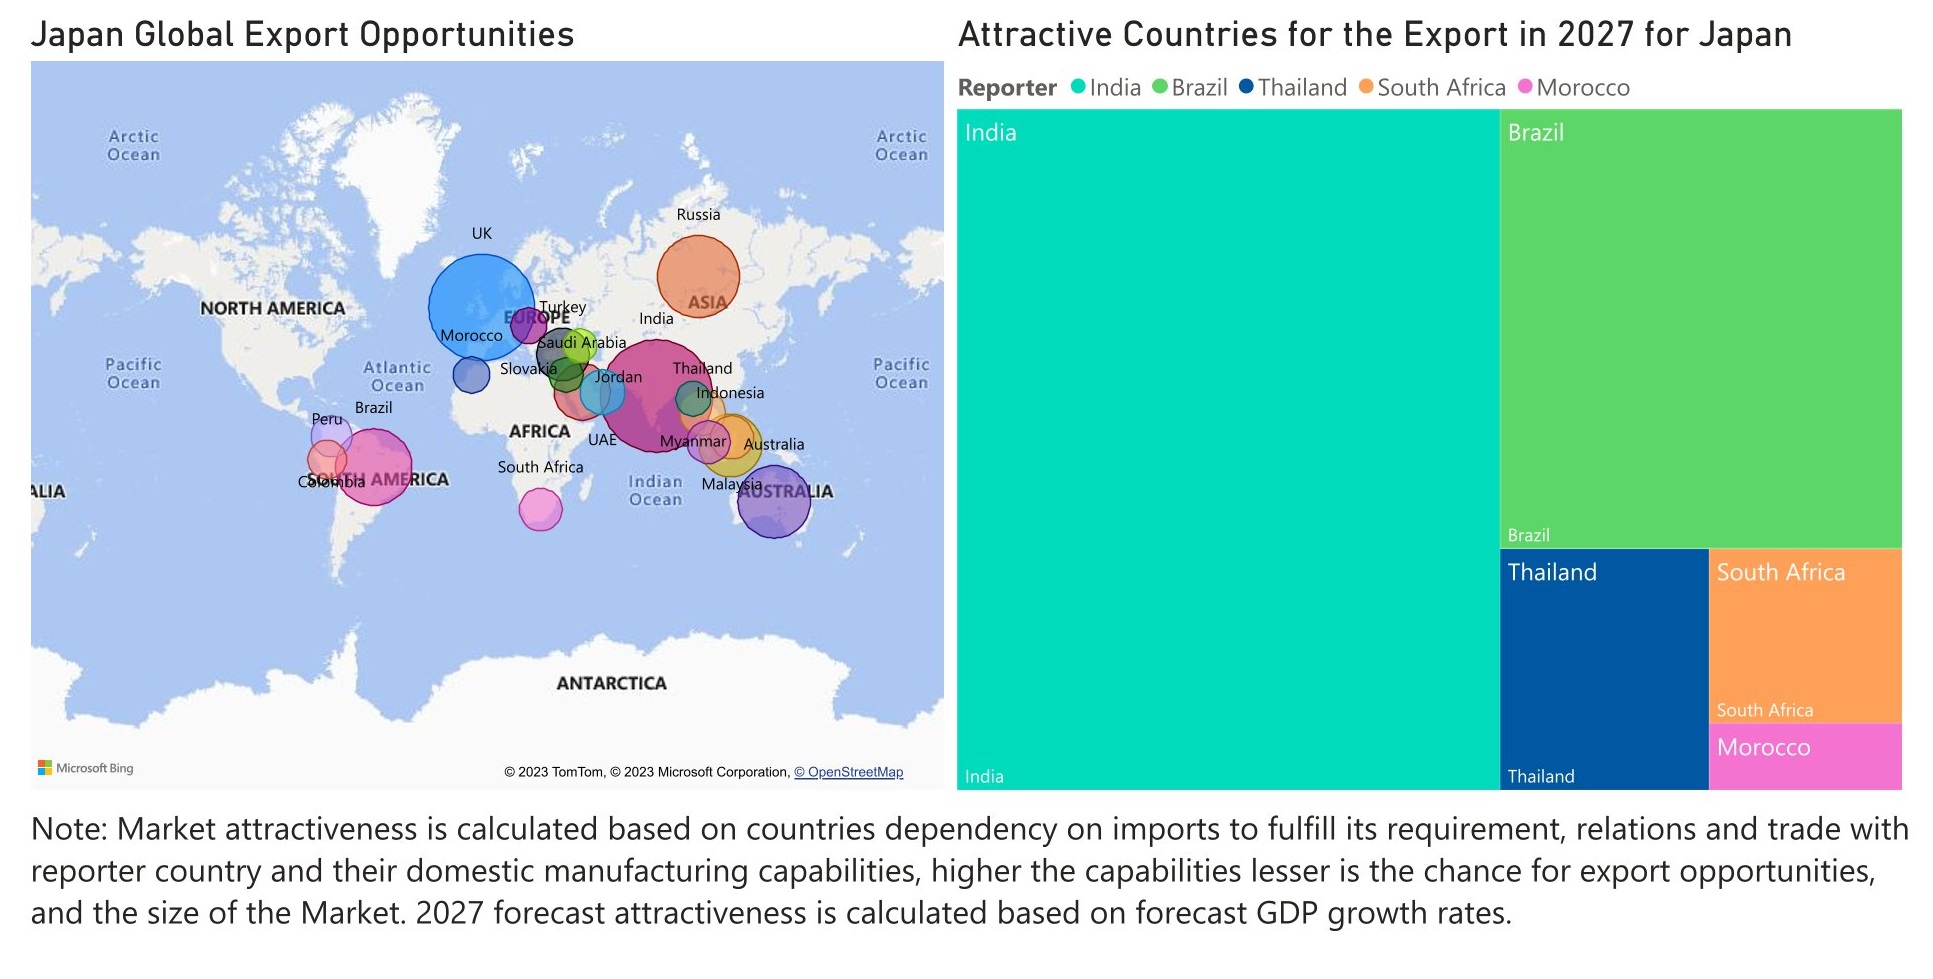
Japan Organic Chemicals Market - Export Market Opportunities
Key Highlights of the Report:
- Japan Organic Chemicals Market Outlook
- Market Size of Japan Organic Chemicals Market, 2021
- Forecast of Japan Organic Chemicals Market, 2028
- Historical Data and Forecast of Japan Organic Chemicals Revenues & Volume for the Period 2018 - 2028
- Japan Organic Chemicals Market Trend Evolution
- Japan Organic Chemicals Market Drivers and Challenges
- Japan Organic Chemicals Price Trends
- Japan Organic Chemicals Porter's Five Forces
- Japan Organic Chemicals Industry Life Cycle
- Historical Data and Forecast of Japan Organic Chemicals Market Revenues & Volume By Source for the Period 2018 - 2028
- Historical Data and Forecast of Japan Organic Chemicals Market Revenues & Volume By Natural for the Period 2018 - 2028
- Historical Data and Forecast of Japan Organic Chemicals Market Revenues & Volume By Synthetic for the Period 2018 - 2028
- Historical Data and Forecast of Japan Organic Chemicals Market Revenues & Volume By Product Type for the Period 2018 - 2028
- Historical Data and Forecast of Japan Organic Chemicals Market Revenues & Volume By Acetic acid for the Period 2018 - 2028
- Historical Data and Forecast of Japan Organic Chemicals Market Revenues & Volume By Ethyl alcohol for the Period 2018 - 2028
- Historical Data and Forecast of Japan Organic Chemicals Market Revenues & Volume By Methanol for the Period 2018 - 2028
- Historical Data and Forecast of Japan Organic Chemicals Market Revenues & Volume By Formaldehyde for the Period 2018 - 2028
- Historical Data and Forecast of Japan Organic Chemicals Market Revenues & Volume By Aldehydes for the Period 2018 - 2028
- Historical Data and Forecast of Japan Organic Chemicals Market Revenues & Volume By Citric acid for the Period 2018 - 2028
- Historical Data and Forecast of Japan Organic Chemicals Market Revenues & Volume By Ketones for the Period 2018 - 2028
- Historical Data and Forecast of Japan Organic Chemicals Market Revenues & Volume By Others for the Period 2018 - 2028
- Historical Data and Forecast of Japan Organic Chemicals Market Revenues & Volume By End-use for the Period 2018 - 2028
- Historical Data and Forecast of Japan Organic Chemicals Market Revenues & Volume By Pharmaceuticals for the Period 2018 - 2028
- Historical Data and Forecast of Japan Organic Chemicals Market Revenues & Volume By Pesticides for the Period 2018 - 2028
- Historical Data and Forecast of Japan Organic Chemicals Market Revenues & Volume By Agrochemicals for the Period 2018 - 2028
- Historical Data and Forecast of Japan Organic Chemicals Market Revenues & Volume By Plastics and polymers for the Period 2018 - 2028
- Historical Data and Forecast of Japan Organic Chemicals Market Revenues & Volume By Cosmetics for the Period 2018 - 2028
- Historical Data and Forecast of Japan Organic Chemicals Market Revenues & Volume By Food & Beverages for the Period 2018 - 2028
- Historical Data and Forecast of Japan Organic Chemicals Market Revenues & Volume By Others for the Period 2018 - 2028
- Japan Organic Chemicals Import Export Trade Statistics
- Market Opportunity Assessment By Source
- Market Opportunity Assessment By Product Type
- Market Opportunity Assessment By End-use
- Japan Organic Chemicals Top Companies Market Share
- Japan Organic Chemicals Competitive Benchmarking By Technical and Operational Parameters
- Japan Organic Chemicals Company Profiles
- Japan Organic Chemicals Key Strategic Recommendations
Frequently Asked Questions About the Market Study (FAQs):
6Wresearch actively monitors the Japan Organic Chemicals Market and publishes its comprehensive annual report, highlighting emerging trends, growth drivers, revenue analysis, and forecast outlook. Our insights help businesses to make data-backed strategic decisions with ongoing market dynamics. Our analysts track relevent industries related to the Japan Organic Chemicals Market, allowing our clients with actionable intelligence and reliable forecasts tailored to emerging regional needs.
Yes, we provide customisation as per your requirements. To learn more, feel free to contact us on sales@6wresearch.com
|
1 Executive Summary |
|
2 Introduction |
|
2.1 Key Highlights of the Report |
|
2.2 Report Description |
|
2.3 Market Scope & Segmentation |
|
2.4 Research Methodology |
|
2.5 Assumptions |
|
3 Japan Organic Chemicals Market Overview |
|
3.1 Japan Country Macro Economic Indicators |
|
3.2 Japan Organic Chemicals Market Revenues & Volume, 2021 & 2028F |
|
3.3 Japan Organic Chemicals Market - Industry Life Cycle |
|
3.4 Japan Organic Chemicals Market - Porter's Five Forces |
|
3.5 Japan Organic Chemicals Market Revenues & Volume Share, By Source, 2021 & 2028F |
|
3.6 Japan Organic Chemicals Market Revenues & Volume Share, By Product Type, 2021 & 2028F |
|
3.7 Japan Organic Chemicals Market Revenues & Volume Share, By End-use, 2021 & 2028F |
|
4 Japan Organic Chemicals Market Dynamics |
|
4.1 Impact Analysis |
|
4.2 Market Drivers |
|
4.2.1 Increasing awareness and demand for eco-friendly and sustainable products |
|
4.2.2 Growth in end-user industries such as pharmaceuticals, agriculture, and cosmetics |
|
4.2.3 Government initiatives promoting the use of organic chemicals in manufacturing processes |
|
4.3 Market Restraints |
|
4.3.1 High production costs associated with organic chemicals |
|
4.3.2 Stringent regulations and compliance standards for manufacturing and usage |
|
4.3.3 Limited availability of raw materials for organic chemical production |
|
5 Japan Organic Chemicals Market Trends |
|
6 Japan Organic Chemicals Market, By Types |
|
6.1 Japan Organic Chemicals Market, By Source |
|
6.1.1 Overview and Analysis |
|
6.1.2 Japan Organic Chemicals Market Revenues & Volume, By Source, 2018 - 2028F |
|
6.1.3 Japan Organic Chemicals Market Revenues & Volume, By Natural, 2018 - 2028F |
|
6.1.4 Japan Organic Chemicals Market Revenues & Volume, By Synthetic, 2018 - 2028F |
|
6.2 Japan Organic Chemicals Market, By Product Type |
|
6.2.1 Overview and Analysis |
|
6.2.2 Japan Organic Chemicals Market Revenues & Volume, By Acetic acid, 2018 - 2028F |
|
6.2.3 Japan Organic Chemicals Market Revenues & Volume, By Ethyl alcohol, 2018 - 2028F |
|
6.2.4 Japan Organic Chemicals Market Revenues & Volume, By Methanol, 2018 - 2028F |
|
6.2.5 Japan Organic Chemicals Market Revenues & Volume, By Formaldehyde, 2018 - 2028F |
|
6.2.6 Japan Organic Chemicals Market Revenues & Volume, By Aldehydes, 2018 - 2028F |
|
6.2.7 Japan Organic Chemicals Market Revenues & Volume, By Citric acid, 2018 - 2028F |
|
6.2.8 Japan Organic Chemicals Market Revenues & Volume, By Others, 2018 - 2028F |
|
6.2.9 Japan Organic Chemicals Market Revenues & Volume, By Others, 2018 - 2028F |
|
6.3 Japan Organic Chemicals Market, By End-use |
|
6.3.1 Overview and Analysis |
|
6.3.2 Japan Organic Chemicals Market Revenues & Volume, By Pharmaceuticals, 2018 - 2028F |
|
6.3.3 Japan Organic Chemicals Market Revenues & Volume, By Pesticides, 2018 - 2028F |
|
6.3.4 Japan Organic Chemicals Market Revenues & Volume, By Agrochemicals, 2018 - 2028F |
|
6.3.5 Japan Organic Chemicals Market Revenues & Volume, By Plastics and polymers, 2018 - 2028F |
|
6.3.6 Japan Organic Chemicals Market Revenues & Volume, By Cosmetics, 2018 - 2028F |
|
6.3.7 Japan Organic Chemicals Market Revenues & Volume, By Food & Beverages, 2018 - 2028F |
|
7 Japan Organic Chemicals Market Import-Export Trade Statistics |
|
7.1 Japan Organic Chemicals Market Export to Major Countries |
|
7.2 Japan Organic Chemicals Market Imports from Major Countries |
|
8 Japan Organic Chemicals Market Key Performance Indicators |
8.1 Percentage of organic chemical usage in key industries (e.g., pharmaceuticals, agriculture) |
8.2 Number of new product launches using organic chemicals |
8.3 Research and development investment in organic chemical innovations |
|
9 Japan Organic Chemicals Market - Opportunity Assessment |
|
9.1 Japan Organic Chemicals Market Opportunity Assessment, By Source, 2021 & 2028F |
|
9.2 Japan Organic Chemicals Market Opportunity Assessment, By Product Type, 2021 & 2028F |
|
9.3 Japan Organic Chemicals Market Opportunity Assessment, By End-use, 2021 & 2028F |
|
10 Japan Organic Chemicals Market - Competitive Landscape |
|
10.1 Japan Organic Chemicals Market Revenue Share, By Companies, 2021 |
|
10.2 Japan Organic Chemicals Market Competitive Benchmarking, By Operating and Technical Parameters |
|
11 Company Profiles |
|
12 Recommendations |
|
13 Disclaimer |
Global Go To Market Strategy - 2030
Export potential enables firms to identify high-growth global markets with greater confidence by combining advanced trade intelligence with a structured quantitative methodology. The framework analyzes emerging demand trends and country-level import patterns while integrating macroeconomic and trade datasets such as GDP and population forecasts, bilateral import–export flows, tariff structures, elasticity differentials between developed and developing economies, geographic distance, and import demand projections. Using weighted trade values from 2020–2024 as the base period to project country-to-country export potential for 2030, these inputs are operationalized through calculated drivers such as gravity model parameters, tariff impact factors, and projected GDP per-capita growth. Through an analysis of hidden potentials, demand hotspots, and market conditions that are most favorable to success, this method enables firms to focus on target countries, maximize returns, and global expansion with data, backed by accuracy.
By factoring in the projected importer demand gap that is currently unmet and could be potential opportunity, it identifies the potential for the Exporter (Country) among 190 countries, against the general trade analysis, which identifies the biggest importer or exporter.
To discover high-growth global markets and optimize your business strategy:
Click Here
Pricing
- Single User License$ 1,995
- Department License$ 2,400
- Site License$ 3,120
- Global License$ 3,795

Leadership Perspectives from Industry Events
Search
Thought Leadership and Analyst Meet


Our Clients
6WResearch In News
- Doha a strategic location for EV manufacturing hub: IPA Qatar
- Demand for luxury TVs surging in the GCC, says Samsung
- Empowering Growth: The Thriving Journey of Bangladesh’s Cable Industry
- Demand for luxury TVs surging in the GCC, says Samsung
- Video call with a traditional healer? Once unthinkable, it’s now common in South Africa
- Intelligent Buildings To Smooth GCC’s Path To Net Zero
Latest Reports
- New Zealand Aseptic Manufacturing Market (2026-2032)
- Netherlands Aseptic Manufacturing Market (2026-2032)
- Nauru Aseptic Manufacturing Market (2026-2032)
- Namibia Aseptic Manufacturing Market (2026-2032)
- Mozambique Aseptic Manufacturing Market (2026-2032)
- Montenegro Aseptic Manufacturing Market (2026-2032)
- Mongolia Aseptic Manufacturing Market (2026-2032)
- Monaco Aseptic Manufacturing Market (2026-2032)
- Micronesia Aseptic Manufacturing Market (2026-2032)
- Mauritius Aseptic Manufacturing Market (2026-2032)
Industry Events and Analyst Meet

HIMTEX 2026

India Refining Summit 2026

India EV Show 2026

EV tech India Expo 2026

Auto Tech Asia 2026
Whitepaper
- Middle East & Africa Commercial Security Market Click here to view more.
- Middle East & Africa Fire Safety Systems & Equipment Market Click here to view more.
- GCC Drone Market Click here to view more.
- Middle East Lighting Fixture Market Click here to view more.
- GCC Physical & Perimeter Security Market Click here to view more.