Japan Soft Drinks Packaging Market (2026-2032) Outlook | Size, Share, Revenue, Growth, Companies, Forecast, Analysis, Trends, Industry & Value
Market Forecast By Material (Paper, Plastic, Metal, Glass), By Product Type (Cans, Boxes, Bottles, Cartons), By Capacity (Up to 100 ml, 100 to 250 ml, 250 to 500 ml, 500 to 1000 ml, 1000 to 2000 ml, Above 2000 ml), By Application (Carbonated soft drinks, Functional Drinks, Sport Drinks, Energy Drinks, Others, Juices) And Competitive Landscape
| Product Code: ETC189874 | Publication Date: May 2022 | Updated Date: Jun 2026 | Product Type: Market Research Report | |
| Publisher: 6Wresearch | Author: Sumit Sagar | No. of Pages: 60 | No. of Figures: 40 | No. of Tables: 7 |
Japan Soft Drinks Packaging Market Size, Share & Growth Rate
The Japan Soft Drinks Packaging Market was estimated at USD 140 Million in 2025 and is projected to reach USD 150 Million by 2032, growing at a CAGR of 1.0% from 2026 to 2032. This growth trajectory is primarily driven by a surge in demand for sustainable packaging solutions, reflecting heightened consumer awareness of environmental issues. Additionally, the trend toward convenience packaging formats aligns perfectly with evolving consumer lifestyles, ensuring that manufacturers remain competitive in this dynamic landscape.
Japan Soft Drinks Packaging Market Year-wise Growth Rate and Key Drivers
This graph highlights how the Japan Soft Drinks Packaging Market has steadily grown over the years, supported by major growth factors.
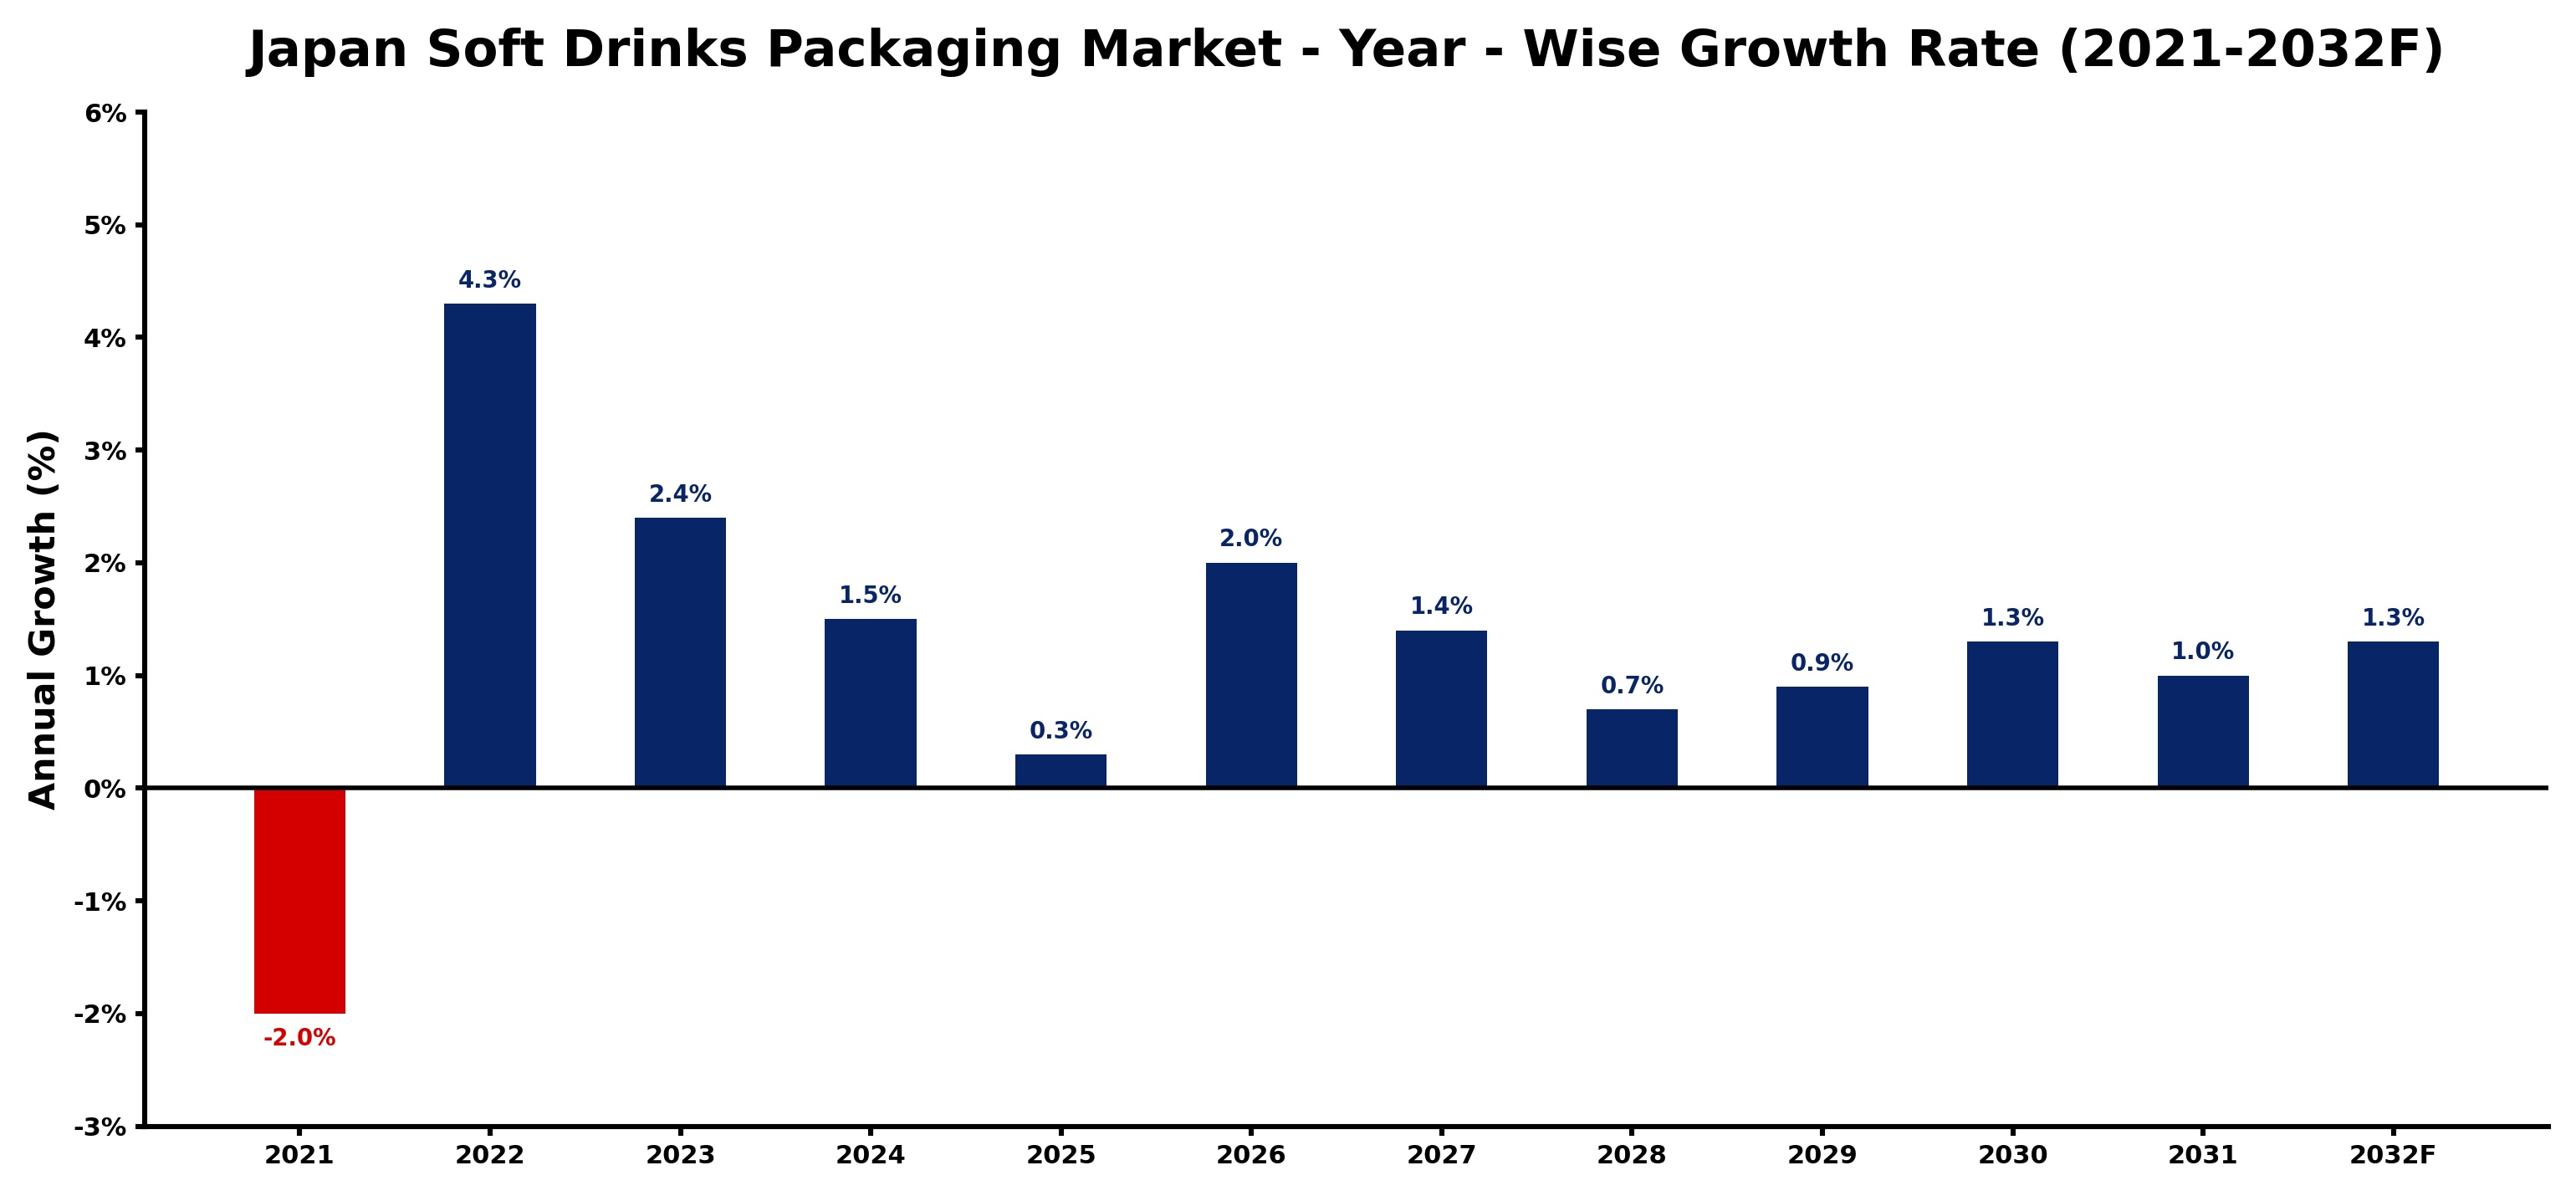
The table below presents the year‑wise growth rates along with the key drivers influencing the market
| Year | Growth Rate | Major Drivers |
| 2021 | -2.0% | Consumer spending decreased significantly |
| 2022 | 4.3% | Sustainability trends enhanced packaging |
| 2023 | 2.4% | Innovative designs attracted consumers |
| 2024 | 1.5% | Health-conscious choices drove demand |
| 2025 | 0.3% | E-commerce growth expanded reach |
| 2026 | 2.0% | Functional beverages gained popularity |
| 2027 | 1.4% | Local sourcing improved brand loyalty |
| 2028 | 0.7% | Convenience packaging attracted consumers |
| 2029 | 0.9% | Customization options increased sales |
| 2030 | 1.3% | Collaborations enhanced product offerings |
| 2031 | 1.0% | Technology integration improved efficiency |
| 2032 | 1.3% | Brand storytelling engaged customers |
Note - Market size estimations and growth projections presented in this report are based on 6Wresearch’s advanced forecasting approach, validated with industry datasets as of June 2026.
Japan Soft Drinks Packaging Market Synopsis
Sustainability is the most significant force reshaping the Japan Soft Drinks Packaging Market. As public awareness of environmental challenges grows, both consumers and companies are increasingly prioritizing eco-friendly packaging solutions. This shift is prompting soft drink manufacturers to innovate their packaging strategies to minimize plastic waste and utilize more sustainable materials.
Furthermore, the market is experiencing a noticeable increase in demand for portable packaging options. With the rise of on-the-go consumption habits, packaging formats like smaller cans and lightweight pouches are gaining traction among consumers, reinforcing the need for manufacturers to adapt quickly to these evolving preferences.
Japan Soft Drinks Packaging Market Key Takeaways
- The Japan Soft Drinks Packaging Market is projected to grow steadily due to rising consumer demand for convenience and sustainability.
- Innovations in packaging technologies are driving new solutions that enhance product freshness and consumer engagement.
- Government policies encouraging eco-friendly practices are further influencing market dynamics.
- Companies are increasingly investing in research and development to create attractive, functional packaging designs.
- Collaboration with soft drink manufacturers is key to developing customized solutions that enhance brand visibility.
Evaluation of Restraints in Japan Soft Drinks Packaging Market
While the Japan Soft Drinks Packaging Market is poised for growth, several restraints could impede its full potential. The urgent need for sustainable packaging options is placing significant pressure on manufacturers to revise their current practices. Balancing the demand for eco-friendly materials with the challenges of maintaining product integrity, cost-effectiveness, and compliance with regulatory standards is no easy feat. Additionally, the competitive nature of the market necessitates that companies continuously innovate, further complicating their ability to meet changing consumer demands without incurring additional costs.
Japan Soft Drinks Packaging Market Trends
The market is increasingly leaning towards sustainable packaging solutions, with a noticeable uptick in the use of recyclable PET bottles and biodegradable materials. This transition is a direct response to rising consumer awareness and regulatory pressures aimed at reducing plastic waste. Additionally, smaller, single-serve packaging formats are on the rise, driven by consumer lifestyles favoring convenience. Innovations in smart packaging technology are also coming to the forefront, enhancing product preservation and consumer interaction.
Japan Soft Drinks Packaging Market Opportunities
A wealth of investment opportunities exists in the Japan Soft Drinks Packaging Market, particularly in sustainable packaging solutions. Companies that prioritize the development of biodegradable and recyclable materials are well-positioned to capture the market's evolving landscape. The demand for on-the-go packaging formats further offers avenues for growth, with potential for innovations that focus on functionality and consumer appeal. Strategic partnerships with manufacturers to develop customized packaging can also provide significant competitive advantages.
Government Initiatives in the Japan Soft Drinks Packaging Market
The Japanese government has implemented several policies aimed at enhancing sustainability within the soft drinks packaging sector. Initiatives such as the Plastic Resource Recycling Strategy emphasize innovation in recycling technologies and encourage the use of recycled materials in packaging. The government has also set ambitious targets for increasing PET bottle collection and recycling rates, alongside regulatory measures promoting the adoption of eco-friendly packaging materials. These initiatives reflect a robust commitment to mitigating environmental impact and fostering sustainable practices in the industry.
Future Insights of the Japan Soft Drinks Packaging Market
Looking ahead to 2026-2032, the Japan Soft Drinks Packaging Market is expected to continue its steady growth trajectory. The focus will likely remain on developing sustainable and convenient packaging options, with manufacturers investing in recyclable and lightweight designs to minimize environmental impact. Innovations such as smart packaging will further enhance consumer engagement and product preservation. With increasing emphasis on health and wellness, the demand for functional packaging that extends shelf life is also expected to rise, shaping the future direction of the market.
Japan Soft Drinks Packaging Market Latest Developments (May 2025 - June 2026)
In recent months, the Japan Soft Drinks Packaging Market has witnessed a wave of innovations aimed at sustainability and convenience. Companies are exploring novel materials and designs to enhance product functionality while reducing environmental impact. Collaboration among manufacturers and packaging suppliers is becoming more common as stakeholders seek to meet regulatory standards and consumer expectations efficiently. These developments signal a promising trajectory for the market as it adapts to evolving demands.
Japan Soft Drinks Packaging Market - Key Attractiveness of the Report
- 10 Years of Market Numbers
- Historical Data Starting from 2022 to 2025
- Base Year: 2025
- Forecast Data until 2032
- Key Performance Indicators Impacting the Market
- Major Upcoming Developments and Projects
Key Highlights of the Report:
- Japan Soft Drinks Packaging Market Outlook
- Market Size of Japan Soft Drinks Packaging Market, 2025
- Forecast of Japan Soft Drinks Packaging Market, 2032
- Historical Data and Forecast of Japan Soft Drinks Packaging Revenues & Volume for the Period 2022-2032F
- Japan Soft Drinks Packaging Market Trend Evolution
- Japan Soft Drinks Packaging Market Drivers and Challenges
- Japan Soft Drinks Packaging Price Trends
- Japan Soft Drinks Packaging Porter's Five Forces
- Japan Soft Drinks Packaging Industry Life Cycle
- Historical Data and Forecast of Japan Soft Drinks Packaging Market Revenues & Volume By Material for the Period 2022-2032F
- Historical Data and Forecast of Japan Soft Drinks Packaging Market Revenues & Volume By Paper for the Period 2022-2032F
- Historical Data and Forecast of Japan Soft Drinks Packaging Market Revenues & Volume By Plastic for the Period 2022-2032F
- Historical Data and Forecast of Japan Soft Drinks Packaging Market Revenues & Volume By Metal for the Period 2022-2032F
- Historical Data and Forecast of Japan Soft Drinks Packaging Market Revenues & Volume By Glass for the Period 2022-2032F
- Historical Data and Forecast of Japan Soft Drinks Packaging Market Revenues & Volume By for the Period 2022-2032F
- Historical Data and Forecast of Japan Soft Drinks Packaging Market Revenues & Volume By for the Period 2022-2032F
- Historical Data and Forecast of Japan Soft Drinks Packaging Market Revenues & Volume By Product Type for the Period 2022-2032F
- Historical Data and Forecast of Japan Soft Drinks Packaging Market Revenues & Volume By Cans for the Period 2022-2032F
- Historical Data and Forecast of Japan Soft Drinks Packaging Market Revenues & Volume By Boxes for the Period 2022-2032F
- Historical Data and Forecast of Japan Soft Drinks Packaging Market Revenues & Volume By Bottles for the Period 2022-2032F
- Historical Data and Forecast of Japan Soft Drinks Packaging Market Revenues & Volume By Cartons for the Period 2022-2032F
- Historical Data and Forecast of Japan Soft Drinks Packaging Market Revenues & Volume By for the Period 2022-2032F
- Historical Data and Forecast of Japan Soft Drinks Packaging Market Revenues & Volume By for the Period 2022-2032F
- Historical Data and Forecast of Japan Soft Drinks Packaging Market Revenues & Volume By Capacity for the Period 2022-2032F
- Historical Data and Forecast of Japan Soft Drinks Packaging Market Revenues & Volume By Up to 100 ml for the Period 2022-2032F
- Historical Data and Forecast of Japan Soft Drinks Packaging Market Revenues & Volume By 100 to 250 ml for the Period 2022-2032F
- Historical Data and Forecast of Japan Soft Drinks Packaging Market Revenues & Volume By 250 to 500 ml for the Period 2022-2032F
- Historical Data and Forecast of Japan Soft Drinks Packaging Market Revenues & Volume By 500 to 1000 ml for the Period 2022-2032F
- Historical Data and Forecast of Japan Soft Drinks Packaging Market Revenues & Volume By 1000 to 2000 ml for the Period 2022-2032F
- Historical Data and Forecast of Japan Soft Drinks Packaging Market Revenues & Volume By Above 2000 ml for the Period 2022-2032F
- Historical Data and Forecast of Japan Soft Drinks Packaging Market Revenues & Volume By Application for the Period 2022-2032F
- Historical Data and Forecast of Japan Soft Drinks Packaging Market Revenues & Volume By Carbonated soft drinks for the Period 2022-2032F
- Historical Data and Forecast of Japan Soft Drinks Packaging Market Revenues & Volume By Functional Drinks for the Period 2022-2032F
- Historical Data and Forecast of Japan Soft Drinks Packaging Market Revenues & Volume By Sport Drinks for the Period 2022-2032F
- Historical Data and Forecast of Japan Soft Drinks Packaging Market Revenues & Volume By Energy Drinks for the Period 2022-2032F
- Historical Data and Forecast of Japan Soft Drinks Packaging Market Revenues & Volume By Others for the Period 2022-2032F
- Historical Data and Forecast of Japan Soft Drinks Packaging Market Revenues & Volume By Juices for the Period 2022-2032F
- Japan Soft Drinks Packaging Import Export Trade Statistics
- Market Opportunity Assessment By Material
- Market Opportunity Assessment By Product Type
- Market Opportunity Assessment By Capacity
- Market Opportunity Assessment By Application
- Japan Soft Drinks Packaging Top Companies Market Share
- Japan Soft Drinks Packaging Competitive Benchmarking By Technical and Operational Parameters
- Japan Soft Drinks Packaging Company Profiles
- Japan Soft Drinks Packaging Key Strategic Recommendations
Japan Soft Drinks Packaging Market - Frequently Asked Questions
The market's growth is primarily fueled by consumer demand for sustainable and convenient packaging solutions, alongside regulatory support aimed at reducing plastic waste.
The Japan Soft Drinks Packaging Market is projected to reach USD 150 Million by 2032, growing at a CAGR of 1.0% from 2026 to 2032.
Changing consumer lifestyles have led to a preference for portable and convenient packaging formats, such as smaller cans and pouches, which brands are increasingly adopting.
Balancing the demand for eco-friendly materials with cost-effectiveness and regulatory compliance while maintaining product quality can be a significant challenge for manufacturers.
The Japanese government has introduced various policies encouraging the use of recyclable materials and innovative recycling technologies, reflecting a commitment to sustainability in packaging practices.
Expect advancements in smart packaging technology and a continued focus on developing biodegradable and recyclable materials to enhance consumer engagement and sustainability efforts.
6Wresearch actively monitors the Japan Soft Drinks Packaging Market and publishes its comprehensive annual report, highlighting emerging trends, growth drivers, revenue analysis, and forecast outlook. Our insights help businesses to make data-backed strategic decisions with ongoing market dynamics. Our analysts track relevent industries related to the Japan Soft Drinks Packaging Market, allowing our clients with actionable intelligence and reliable forecasts tailored to emerging regional needs.
Yes, we provide customisation as per your requirements. To learn more, feel free to contact us on sales@6wresearch.com
1 Executive Summary |
2 Introduction |
2.1 Key Highlights of the Report |
2.2 Report Description |
2.3 Market Scope & Segmentation |
2.4 Research Methodology |
2.5 Assumptions |
3 Japan Soft Drinks Packaging Market Overview |
3.1 Japan Country Macro Economic Indicators |
3.2 Japan Soft Drinks Packaging Market Revenues & Volume, 2022 & 2032F |
3.3 Japan Soft Drinks Packaging Market - Industry Life Cycle |
3.4 Japan Soft Drinks Packaging Market - Porter's Five Forces |
3.5 Japan Soft Drinks Packaging Market Revenues & Volume Share, By Material, 2022 & 2032F |
3.6 Japan Soft Drinks Packaging Market Revenues & Volume Share, By Product Type, 2022 & 2032F |
3.7 Japan Soft Drinks Packaging Market Revenues & Volume Share, By Capacity, 2022 & 2032F |
3.8 Japan Soft Drinks Packaging Market Revenues & Volume Share, By Application, 2022 & 2032F |
4 Japan Soft Drinks Packaging Market Dynamics |
4.1 Impact Analysis |
4.2 Market Drivers |
4.2.1 Increasing consumer demand for convenience and on-the-go consumption of soft drinks |
4.2.2 Growing focus on sustainability and eco-friendly packaging solutions |
4.2.3 Innovation in packaging materials and designs to enhance product differentiation |
4.3 Market Restraints |
4.3.1 Stringent regulations on packaging materials and recycling requirements |
4.3.2 Fluctuating raw material prices affecting packaging costs |
4.3.3 Competition from alternative beverage packaging options like cans and tetra packs |
5 Japan Soft Drinks Packaging Market Trends |
6 Japan Soft Drinks Packaging Market, By Types |
6.1 Japan Soft Drinks Packaging Market, By Material |
6.1.1 Overview and Analysis |
6.1.2 Japan Soft Drinks Packaging Market Revenues & Volume, By Material, 2022-2032F |
6.1.3 Japan Soft Drinks Packaging Market Revenues & Volume, By Paper, 2022-2032F |
6.1.4 Japan Soft Drinks Packaging Market Revenues & Volume, By Plastic, 2022-2032F |
6.1.5 Japan Soft Drinks Packaging Market Revenues & Volume, By Metal, 2022-2032F |
6.1.6 Japan Soft Drinks Packaging Market Revenues & Volume, By Glass, 2022-2032F |
6.1.7 Japan Soft Drinks Packaging Market Revenues & Volume, By , 2022-2032F |
6.1.8 Japan Soft Drinks Packaging Market Revenues & Volume, By , 2022-2032F |
6.2 Japan Soft Drinks Packaging Market, By Product Type |
6.2.1 Overview and Analysis |
6.2.2 Japan Soft Drinks Packaging Market Revenues & Volume, By Cans, 2022-2032F |
6.2.3 Japan Soft Drinks Packaging Market Revenues & Volume, By Boxes, 2022-2032F |
6.2.4 Japan Soft Drinks Packaging Market Revenues & Volume, By Bottles, 2022-2032F |
6.2.5 Japan Soft Drinks Packaging Market Revenues & Volume, By Cartons, 2022-2032F |
6.2.6 Japan Soft Drinks Packaging Market Revenues & Volume, By , 2022-2032F |
6.2.7 Japan Soft Drinks Packaging Market Revenues & Volume, By , 2022-2032F |
6.3 Japan Soft Drinks Packaging Market, By Capacity |
6.3.1 Overview and Analysis |
6.3.2 Japan Soft Drinks Packaging Market Revenues & Volume, By Up to 100 ml, 2022-2032F |
6.3.3 Japan Soft Drinks Packaging Market Revenues & Volume, By 100 to 250 ml, 2022-2032F |
6.3.4 Japan Soft Drinks Packaging Market Revenues & Volume, By 250 to 500 ml, 2022-2032F |
6.3.5 Japan Soft Drinks Packaging Market Revenues & Volume, By 500 to 1000 ml, 2022-2032F |
6.3.6 Japan Soft Drinks Packaging Market Revenues & Volume, By 1000 to 2000 ml, 2022-2032F |
6.3.7 Japan Soft Drinks Packaging Market Revenues & Volume, By Above 2000 ml, 2022-2032F |
6.4 Japan Soft Drinks Packaging Market, By Application |
6.4.1 Overview and Analysis |
6.4.2 Japan Soft Drinks Packaging Market Revenues & Volume, By Carbonated soft drinks, 2022-2032F |
6.4.3 Japan Soft Drinks Packaging Market Revenues & Volume, By Functional Drinks, 2022-2032F |
6.4.4 Japan Soft Drinks Packaging Market Revenues & Volume, By Sport Drinks, 2022-2032F |
6.4.5 Japan Soft Drinks Packaging Market Revenues & Volume, By Energy Drinks, 2022-2032F |
6.4.6 Japan Soft Drinks Packaging Market Revenues & Volume, By Others, 2022-2032F |
6.4.7 Japan Soft Drinks Packaging Market Revenues & Volume, By Juices, 2022-2032F |
7 Japan Soft Drinks Packaging Market Import-Export Trade Statistics |
7.1 Japan Soft Drinks Packaging Market Export to Major Countries |
7.2 Japan Soft Drinks Packaging Market Imports from Major Countries |
8 Japan Soft Drinks Packaging Market Key Performance Indicators |
8.1 Percentage of soft drinks brands using sustainable packaging materials |
8.2 Number of new product launches featuring innovative packaging designs |
8.3 Consumer perception and preference towards soft drinks in specific packaging formats |
8.4 Recycling rate of soft drinks packaging materials |
8.5 Adoption rate of refillable or reusable soft drinks packaging options |
9 Japan Soft Drinks Packaging Market - Opportunity Assessment |
9.1 Japan Soft Drinks Packaging Market Opportunity Assessment, By Material, 2022 & 2032F |
9.2 Japan Soft Drinks Packaging Market Opportunity Assessment, By Product Type, 2022 & 2032F |
9.3 Japan Soft Drinks Packaging Market Opportunity Assessment, By Capacity, 2022 & 2032F |
9.4 Japan Soft Drinks Packaging Market Opportunity Assessment, By Application, 2022 & 2032F |
10 Japan Soft Drinks Packaging Market - Competitive Landscape |
10.1 Japan Soft Drinks Packaging Market Revenue Share, By Companies, 2025 |
10.2 Japan Soft Drinks Packaging Market Competitive Benchmarking, By Operating and Technical Parameters |
11 Company Profiles |
12 Recommendations |
13 Disclaimer |
Global Go To Market Strategy - 2030
Export potential enables firms to identify high-growth global markets with greater confidence by combining advanced trade intelligence with a structured quantitative methodology. The framework analyzes emerging demand trends and country-level import patterns while integrating macroeconomic and trade datasets such as GDP and population forecasts, bilateral import–export flows, tariff structures, elasticity differentials between developed and developing economies, geographic distance, and import demand projections. Using weighted trade values from 2020–2024 as the base period to project country-to-country export potential for 2030, these inputs are operationalized through calculated drivers such as gravity model parameters, tariff impact factors, and projected GDP per-capita growth. Through an analysis of hidden potentials, demand hotspots, and market conditions that are most favorable to success, this method enables firms to focus on target countries, maximize returns, and global expansion with data, backed by accuracy.
By factoring in the projected importer demand gap that is currently unmet and could be potential opportunity, it identifies the potential for the Exporter (Country) among 190 countries, against the general trade analysis, which identifies the biggest importer or exporter.
To discover high-growth global markets and optimize your business strategy:
Click Here
Pricing
- Single User License$ 1,995
- Department License$ 2,400
- Site License$ 3,120
- Global License$ 3,795

Leadership Perspectives from Industry Events
Search
Thought Leadership and Analyst Meet


Our Clients
6WResearch In News
- India Air Conditioner Market Set for Strong Rebound in 2026 After Weather-Led Correction and GST-Driven Recovery: 6Wresearch
- ADAS in India: How Automatic Emergency Braking, Blind Spot Detection & Driver Monitoring are Transforming Road Safety
- Doha a strategic location for EV manufacturing hub: IPA Qatar
- Demand for luxury TVs surging in the GCC, says Samsung
- Empowering Growth: The Thriving Journey of Bangladesh’s Cable Industry
- Demand for luxury TVs surging in the GCC, says Samsung
Latest Reports
- Nicaragua RPG Gaming Market (2026-2032)
- New Zealand RPG Gaming Market (2026-2032)
- Netherlands RPG Gaming Market (2026-2032)
- Nauru RPG Gaming Market (2026-2032)
- Namibia RPG Gaming Market (2026-2032)
- Mozambique RPG Gaming Market (2026-2032)
- Montenegro RPG Gaming Market (2026-2032)
- Mongolia RPG Gaming Market (2026-2032)
- Monaco RPG Gaming Market (2026-2032)
- Micronesia RPG Gaming Market (2026-2032)
Industry Events and Analyst Meet

EV India Expo 2026

HIMTEX 2026

India Refining Summit 2026

India EV Show 2026

EV tech India Expo 2026
Whitepaper
- Middle East & Africa Commercial Security Market Click here to view more.
- Middle East & Africa Fire Safety Systems & Equipment Market Click here to view more.
- GCC Drone Market Click here to view more.
- Middle East Lighting Fixture Market Click here to view more.
- GCC Physical & Perimeter Security Market Click here to view more.