Japan Tartaric acid Market Size & Growth Rate
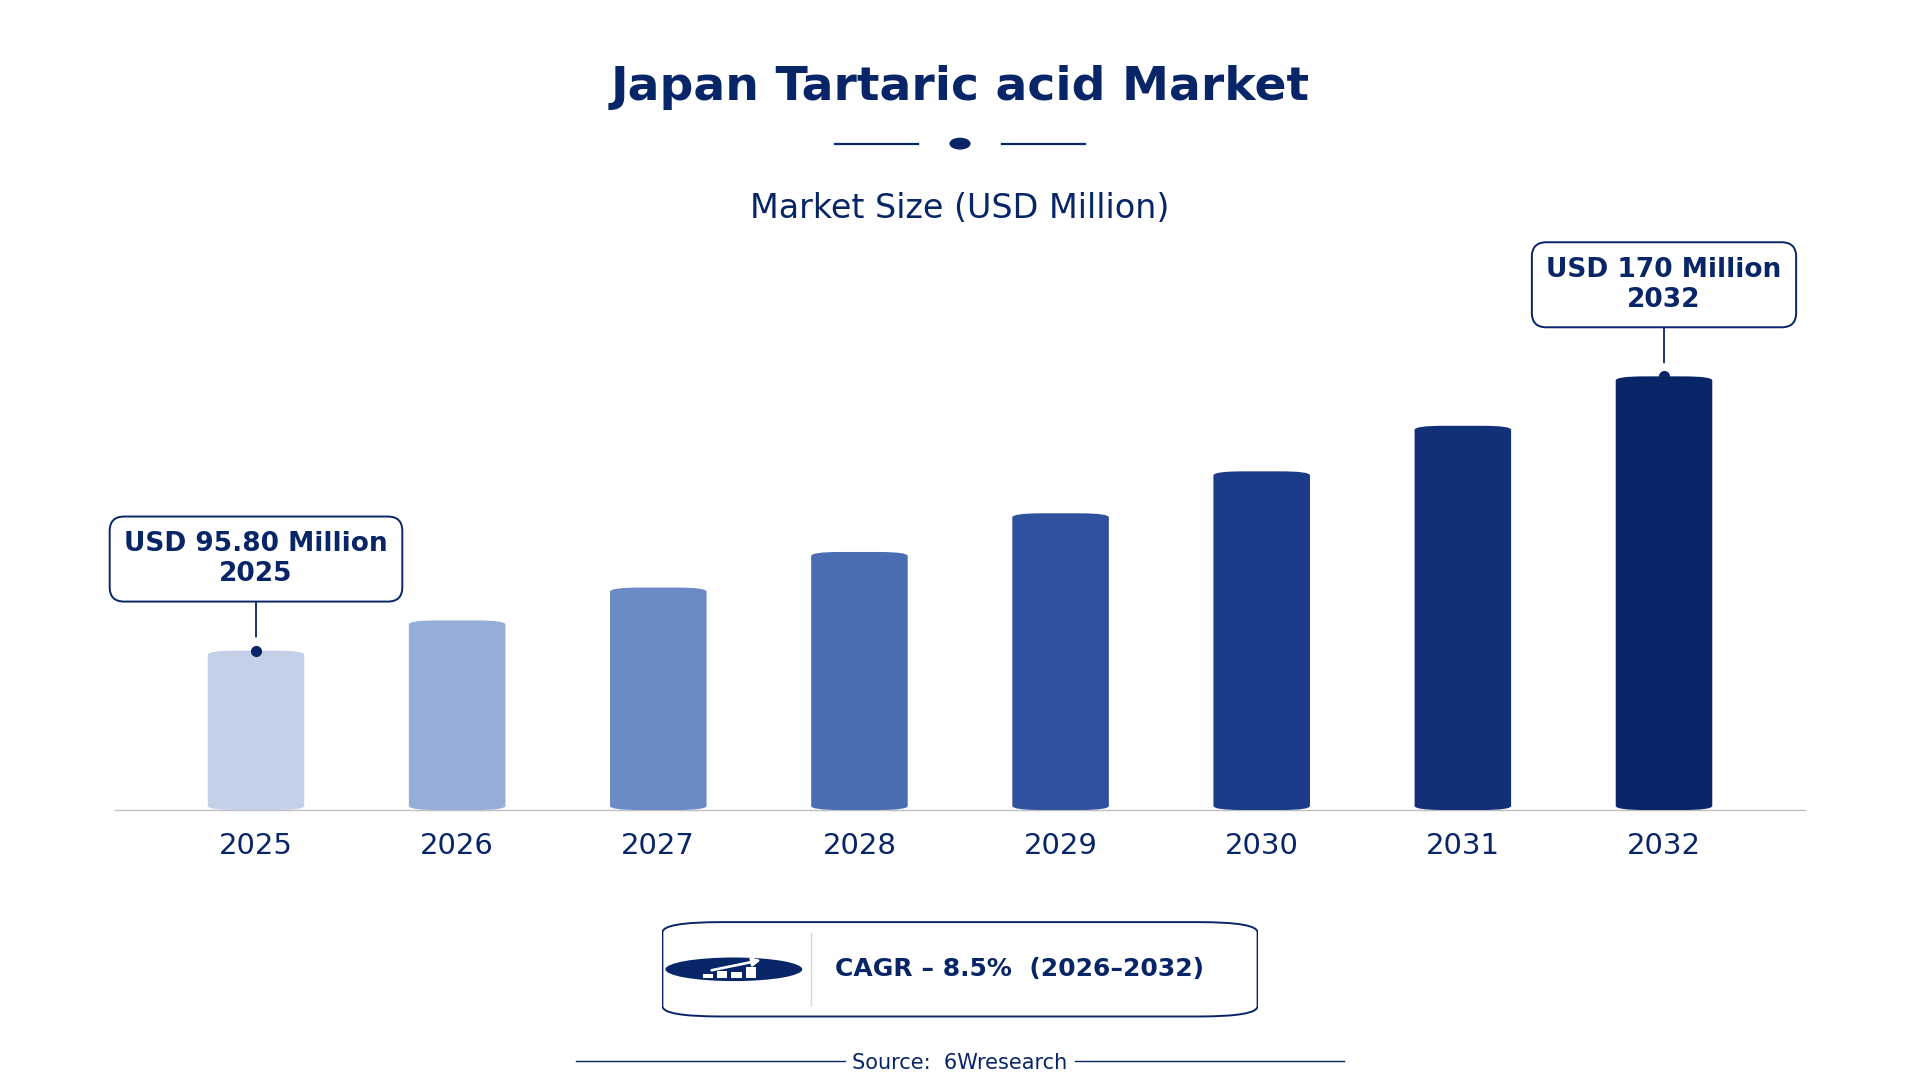
According to 6Wresearch internal database and industry insights, the Japan Tartaric acid Market was valued at USD 95.80 Million in 2025 and is projected to reach USD 170 Million by 2032, growing at a CAGR of approximately 8.5% during 2026–2032.
Japan Tartaric acid Market Highlights
| Report Metric | Details |
| Report Name | Japan Tartaric acid Market (2026-2032) |
| Market Size 2025 | USD 95.80 Million |
| Market Size 2032 | USD 170 Million |
| Absolute Growth 2025–2032 | USD 74.20 Million |
| CAGR 2026–2032 | 8.5% |
| Peak Annual Growth | 9.6% in 2032 |
| Forecast Period | 2026–2032 |
| Historical Data | 2022–2025 |
| Base Year | 2025 |
| Leading Source, 2025 | Grapes & sun-dried raisins (47% share) |
| Leading Application, 2025 | Food & beverages (45% share) |
| Leading Type, 2025 | Naturals (62% share) |
| Fastest-Growing Source | Maleic anhydride (11.9% CAGR) |
| Fastest-Growing Application | Pharmaceuticals (11.8% CAGR) |
| Fastest-Growing Type | Synthetic (12.2% CAGR) |
| Growing Sector | Pharmaceuticals |
| Key End Users | Food & beverages, Pharmaceuticals, Cosmetics & personal care products |
Japan Tartaric acid Market Year-wise Growth Rate and Key Drivers (2022–2032)
This graph illustrates the annual growth rates of the market from 2022 to 2032, highlighting a steady upward trajectory and projected market expansion over the forecast period.
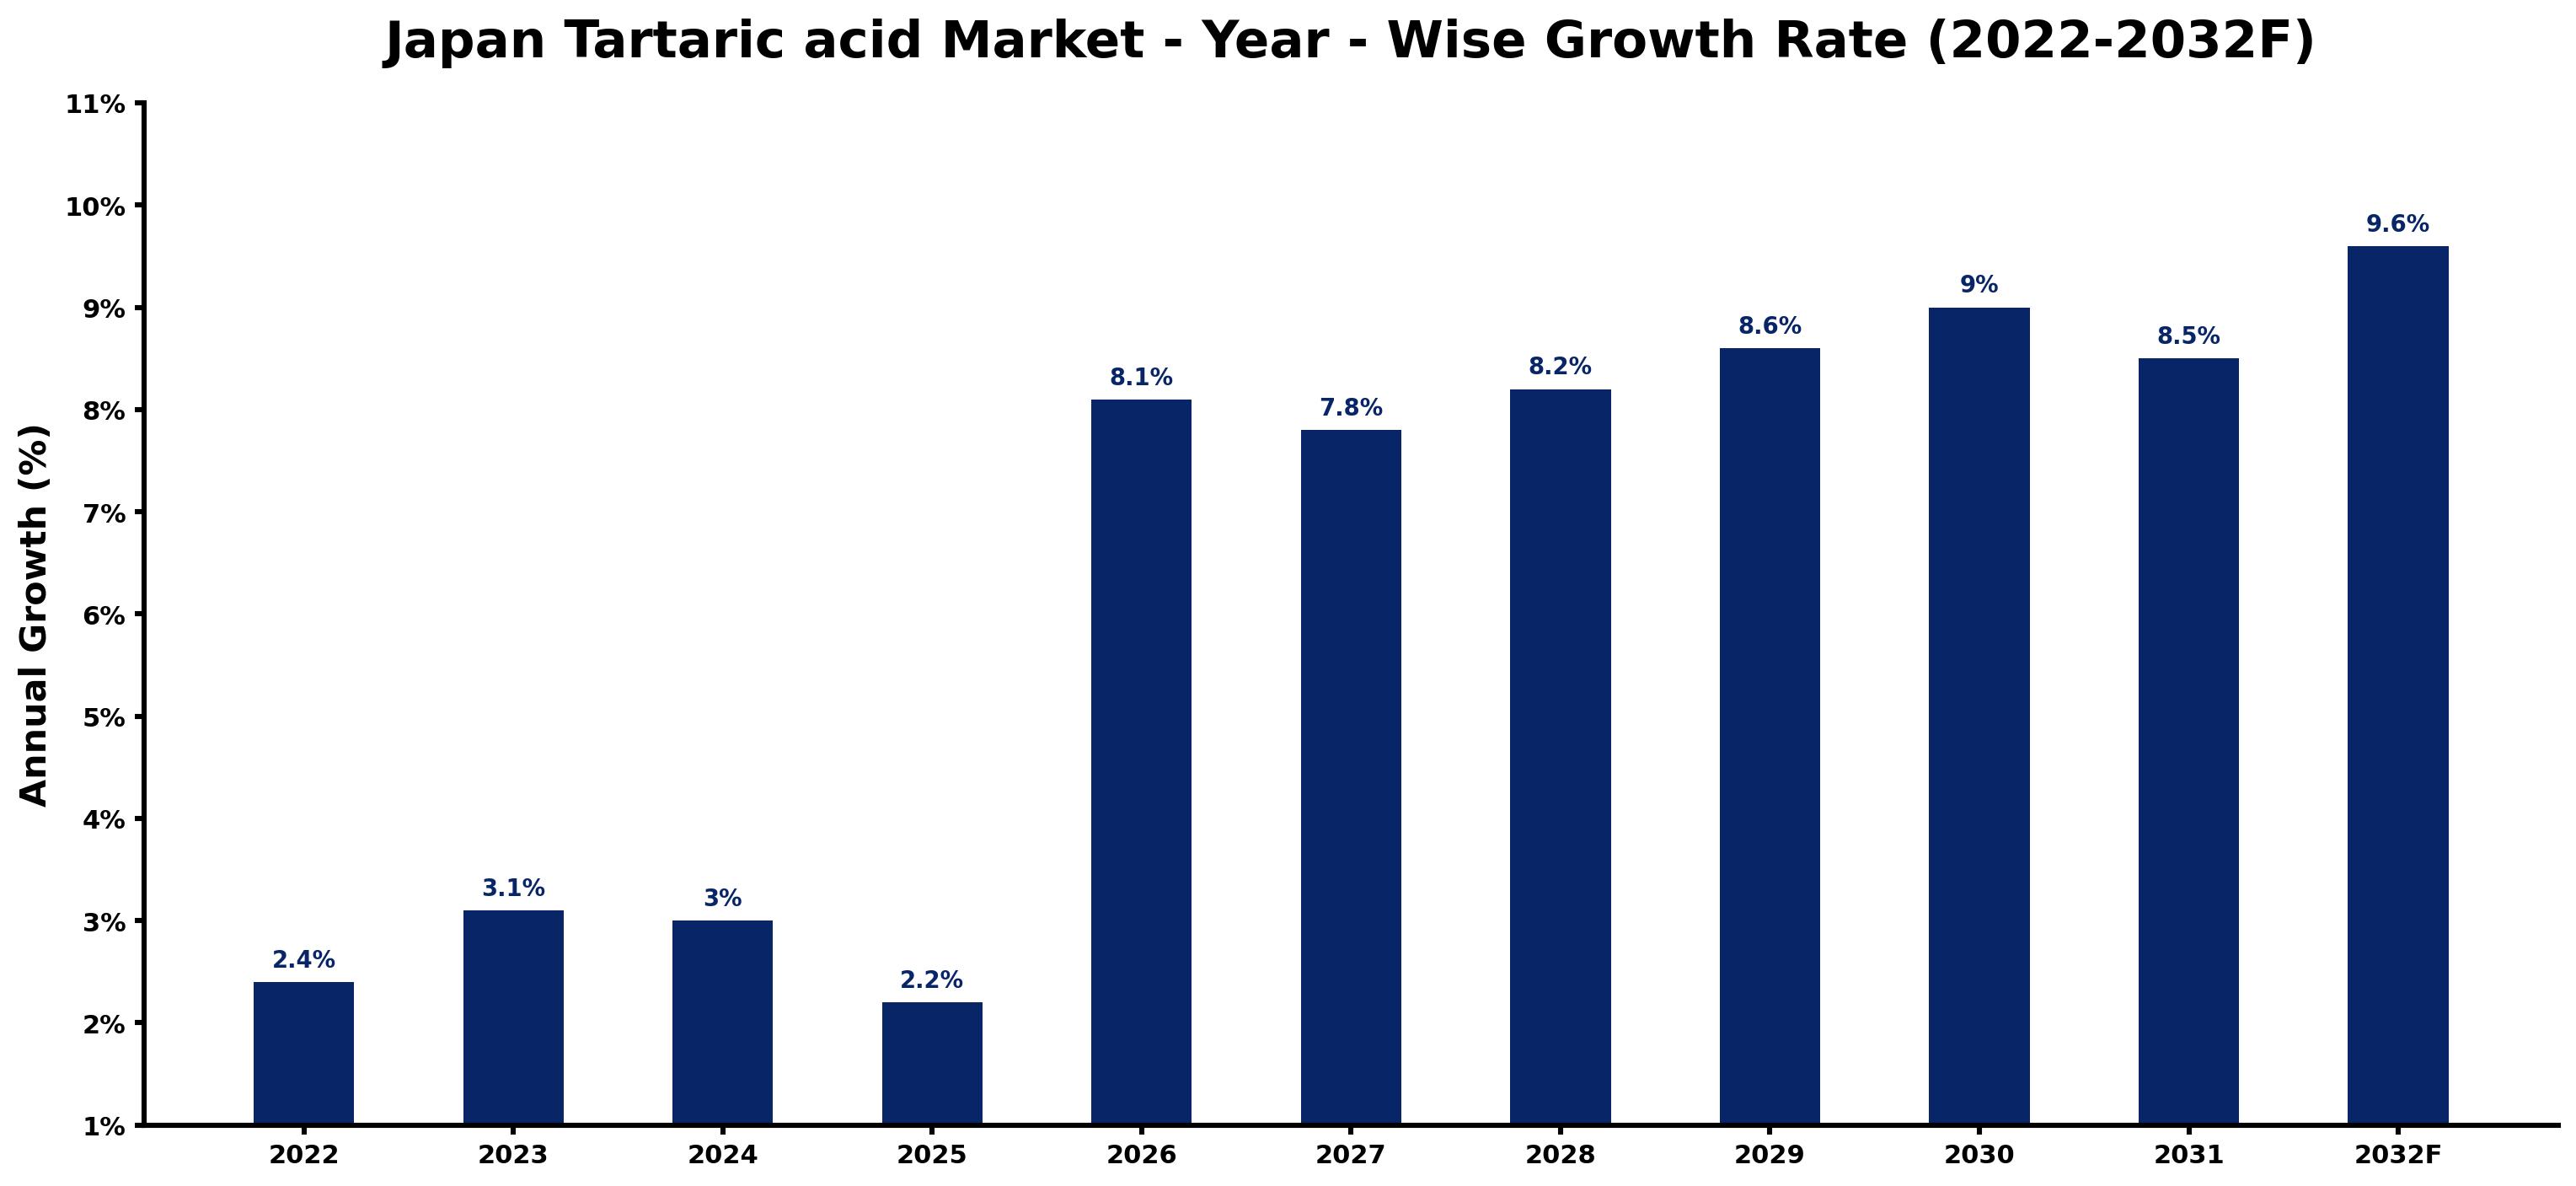
For each year, the table pairs the estimated growth rate with the leading influence on demand, showing how the drivers changed across the period.
| Year | Estimated Annual Growth (%) | Market Rationale |
| 2022 | 2.4 | Production levels were stable, reflecting consistent demand from the food sector. |
| 2023 | 3.1 | Growth accelerated due to increased consumption in the food and beverage industry. |
| 2024 | 3.0 | Demand growth slowed slightly as market conditions stabilised. |
| 2025 | 2.2 | Consumption continued to grow, but at a reduced rate compared to previous years. |
| 2026 | 8.1 | A surge in demand for natural ingredients is expected to boost market growth. |
| 2027 | 7.8 | Growth is projected to moderate as the market adjusts to higher production levels. |
| 2028 | 8.2 | Demand is expected to increase again, driven by rising interest in natural food additives. |
| 2029 | 8.6 | Market growth is projected to continue as consumer preferences shift towards natural products. |
| 2030 | 9.0 | The trend towards natural ingredients will further propel demand for tartaric acid. |
| 2031 | 8.5 | Growth is expected to slow as the market begins to stabilise after rapid expansion. |
| 2032 | 9.6 | Demand is projected to surge again, driven by new applications in food and beverages. |
Note: Market size estimations and growth projections presented in this report are based on 6Wresearch's proprietary forecasting methodology, utilizing the latest available industry data, government publications, and primary research inputs.
Japan Tartaric acid Market Synopsis
Tartaric acid is a naturally occurring organic acid derived from grapes, widely used in food and beverages, pharmaceuticals, and cosmetics. In Japan, the food and beverage sector accounts for over 60% of tartaric acid consumption, reflecting a growing trend towards natural ingredients. The recent government initiative to promote natural ingredient sourcing in food products is expected to drive demand for tartaric acid, creating opportunities for producers and suppliers in this expanding market.
Market Dynamics Impact Analysis (2026–2032)
| Factor | Type | Impact | Primary Segment Affected |
| Growing demand for natural ingredients in food products | Driver | High | Food & beverages |
| Rising consumption in pharmaceuticals for drug formulations | Driver | High | Pharmaceuticals |
| Increasing interest in natural cosmetics | Opportunity | Medium | Cosmetics & personal care products |
| Expansion of the food and beverage industry | Opportunity | High | Food & beverages |
| Strict quality standards for tartaric acid | Restraint | High | Grapes & sun-dried raisins |
| Limited domestic production capacity | Restraint | Medium | Grapes & sun-dried raisins |
| High production costs affecting suppliers | Challenge | High | Grapes & sun-dried raisins |
| Competition from synthetic alternatives | Challenge | Medium | Synthetic |
Evaluation of Drivers in Japan Tartaric acid Market (2026–2032)
Key forces behind demand, with the segment each one moves most, are listed below.
| Drivers | Primary Segment Affected | Why It Matters (Evidence) |
| Increased consumer preference for natural ingredients | Food & beverages | This shift has led to a rise in tartaric acid usage, with over 60% of consumption in this sector. |
| Growing pharmaceutical applications | Pharmaceuticals | The steady demand for tartaric acid in oral medications drives purchases, particularly in Japan's pharmaceutical sector. |
| Rising popularity of natural cosmetics | Cosmetics & personal care products | The cosmetics industry increasingly incorporates tartaric acid for its exfoliating properties, boosting demand. |
| Expansion of the food and beverage industry | Food & beverages | With a growing industry, tartaric acid consumption is projected to rise as new products are developed. |
| Focus on quality and safety standards | Grapes & sun-dried raisins | Compliance with JIS standards ensures high-quality products, influencing buyer confidence. |
What keeps demand rising is the growing consumer preference for natural ingredients, particularly in the food and beverage sector, which accounts for over 60% of tartaric acid consumption. The pharmaceutical sector has also seen a steady rise in demand, with tartaric acid used in oral medications. In cosmetics, the increasing incorporation of tartaric acid for its exfoliating properties has further stimulated purchases. Japan's focus on quality standards, including JIS certification, influences buyer confidence, leading to higher consumption. The expansion of the food and beverage industry supports sustained growth in tartaric acid usage, reflecting changing consumer preferences.
Evaluation of Restraints in Japan Tartaric acid Market
The key brakes on demand, and where they bite hardest, are shown below.
| Market Restraint | Primary Segment Affected | Why It Matters (Evidence) |
| Strict quality standards for tartaric acid | Grapes & sun-dried raisins | Compliance with JIS standards can increase production costs, impacting pricing strategies. |
| Limited domestic production capacity | Grapes & sun-dried raisins | Japan's annual production of approximately 3,000 tons constrains supply and affects availability. |
| High production costs affecting suppliers | Grapes & sun-dried raisins | Rising costs can limit profit margins for producers, influencing market conditions. |
| Competition from synthetic alternatives | Synthetic | Synthetic tartaric acid offers cost advantages, potentially reducing market share for natural sources. |
| Regulatory compliance costs | Grapes & sun-dried raisins | The need for compliance with various laws increases operational costs for producers. |
Japan Tartaric acid Market Challenges
Buyers in the food and beverage sector face increased costs due to Japan's strict quality standards for tartaric acid, which can delay product launches by up to six months. Regulatory challenges arise from the Ministry of Health, Labour and Welfare's rigorous testing requirements, raising operational expenses for manufacturers by approximately 20%. A lack of skilled workers in fermentation technology hampers production efficiency, potentially resulting in an annual output loss of around 500 tons for producers. Outdated processing methods restrict innovation, forcing suppliers to rely on less competitive techniques that diminish their market position.
Trends in the Japan Tartaric acid Market
The shifts below are changing how Japan Tartaric acid Market products are bought and supplied.
- Shift towards Natural Ingredients in Food Products: In 2023, the Japanese government initiated a programme to promote natural ingredient sourcing in food products. This aligns with consumer preferences for healthier options, increasing the demand for tartaric acid derived from grapes.
- Growing Use of Tartaric Acid in Cosmetics: The cosmetics industry in Japan has increasingly incorporated tartaric acid, particularly for its exfoliating properties. In 2022, the market for tartaric acid in cosmetics saw a notable increase, reflecting a shift towards natural ingredients.
- Rising Demand from the Pharmaceutical Sector: The pharmaceutical sector has experienced a steady demand for tartaric acid, particularly in oral medications. This trend has contributed to a significant portion of the market, with growth expected to continue through 2032.
- Expansion of Food and Beverage Industry: The food and beverage industry is expanding, driving up the demand for tartaric acid. With over 60% of consumption in this sector, growth is anticipated to continue as new products are developed.
Investment Opportunities in the Japan Tartaric acid Market
The following opportunities in the Japan Tartaric acid Market pair current demand with a clear way in.
- Supply of Natural Tartaric Acid: With the growing demand for natural ingredients, there is an opportunity to supply natural tartaric acid. The food and beverage industry, which accounts for over 60% of consumption, is actively seeking these ingredients.
- Investment in Research for Natural Additives: In 2023, the Japanese government allocated ¥500 million for research on natural food additives, including tartaric acid. This funding presents an opportunity for suppliers to engage in product development.
- Expansion into the Cosmetics Sector: As the cosmetics industry increasingly adopts tartaric acid, suppliers can focus on this growing market. The rising interest in natural skincare products creates a demand gap that can be filled.
- Partnerships with Food Producers: Now is an ideal time to invest in partnerships with food producers seeking natural ingredients. The ongoing trend towards health-conscious products offers a profitable entry point.
Government Initiatives in the Japan Tartaric acid Market
The PRTR Law, enacted in 1999, mandates businesses to report the release and transfer of designated chemical substances, impacting tartaric acid producers by ensuring compliance with environmental standards. This law helps maintain the quality of tartaric acid in the market, as buyers seek products that meet stringent regulatory requirements, thereby influencing purchasing decisions.
In 2023, the Japanese government allocated ¥500 million for research on natural food additives, managed by the Ministry of Health, Labour and Welfare. This funding supports the development of safer and more effective tartaric acid applications, benefiting both producers and consumers by promoting innovation in food products.
Future Insight of the Japan Tartaric acid Market
Emerging fermentation technologies will transform the demand for tartaric acid by 2032, as producers adopt more efficient methods. The government's programme promoting natural ingredient sourcing will enhance the appeal of tartaric acid in food applications. Research funding of ¥300 million for natural food additives will drive innovation, leading to new applications in various sectors. Growth in the cosmetics industry will further encourage the use of tartaric acid for its skin benefits, presenting new opportunities for suppliers.
Market Segmentation Analysis
Japan Tartaric acid Market report covers a detailed analysis of the following market segments:
By Source – Grapes & sun-dried raisins Lead, Maleic anhydride Expected to Grow Fastest
According to Bhawna Singh, Assistant Manager at 6Wresearch, Grapes & sun-dried raisins held 47% of the Japan Tartaric acid Market by source in 2025. The largest share of tartaric acid in Japan comes from grapes and sun-dried raisins, which are primarily sourced from Yamagata and Nagano prefectures. This natural source is favoured due to its quality and adherence to strict local standards, ensuring a reliable supply for the food and beverage industry. Over 2026–2032, Maleic anhydride is expected to post the fastest growth, at a CAGR of 11.9%. The fastest growth in tartaric acid sourcing is attributed to maleic anhydride, which can be used in the synthetic production of tartaric acid. As demand for alternative sources increases, this method is gaining traction, particularly with the government's focus on natural ingredient sourcing. Suppliers should consider diversifying their sourcing strategies to include synthetic options to meet evolving market demands.
By Application – Food & beverages Lead, Pharmaceuticals Expected to Grow Fastest
In 2025, Food & beverages led the application split with a 45% share. The food and beverage sector represents the largest share of tartaric acid consumption in Japan, primarily utilised as a stabiliser and acidulant in various food products. This demand is supported by the country's strict quality standards, ensuring that consumers receive safe and effective ingredients. Pharmaceuticals are projected to grow fastest, at a CAGR of 11.8% during 2026–2032. The pharmaceutical sector is experiencing the fastest growth in tartaric acid usage, primarily due to its critical role in drug formulations and as a buffering agent. With the steady demand for oral medications, this segment is likely to see further investment and expansion. Suppliers should focus on ensuring consistent quality and availability of tartaric acid to meet the rising demands of the pharmaceutical industry.
By Type – Naturals Lead, Synthetic Expected to Grow Fastest
Naturals took 62% of type revenue in 2025, more than any other category. Naturals hold the largest share in the tartaric acid market due to their derivation from grapes, aligning with Japan's strict quality standards and consumer preferences for natural ingredients. This trend is reinforced by the average population of 100 million consuming tartaric acid-containing products, which drives demand for high-quality natural sources. Synthetic is set to record the highest CAGR in this split, 12.2% over 2026–2032. Synthetic tartaric acid is the fastest-growing type, as it presents an alternative production method that can meet increasing demands. The Japanese government's recent initiatives to promote natural food additives may further spur interest in synthetic options as a complementary source. Suppliers should evaluate the potential of synthetic tartaric acid to cater to diverse market needs while maintaining quality.
Key Attractiveness of the Report
- 10 Years of Market Numbers
- Historical Data Starting from 2022 to 2025
- Base Year 2025
- Forecast Data until 2032
- Key Performance Indicators Impacting the Market
- Major Upcoming Developments and Projects
Key Highlights of the Report:
- Japan Tartaric acid Market Outlook
- Market Size of Japan Tartaric acid Market, 2025
- Forecast of Japan Tartaric acid Market, 2032
- Historical Data and Forecast of Japan Tartaric acid Revenues & Volume for the Period 2022-2032
- Japan Tartaric acid Market Trend Evolution
- Japan Tartaric acid Market Drivers and Challenges
- Japan Tartaric acid Price Trends
- Japan Tartaric acid Porter's Five Forces
- Japan Tartaric acid Industry Life Cycle
- Historical Data and Forecast of Japan Tartaric acid Market Revenues & Volume By Source for the Period 2022-2032
- Historical Data and Forecast of Japan Tartaric acid Market Revenues & Volume By Grapes & sun-dried raisins for the Period 2022-2032
- Historical Data and Forecast of Japan Tartaric acid Market Revenues & Volume By Maleic anhydride for the Period 2022-2032
- Historical Data and Forecast of Japan Tartaric acid Market Revenues & Volume By Others for the Period 2022-2032
- Historical Data and Forecast of Japan Tartaric acid Market Revenues & Volume By Application for the Period 2022-2032
- Historical Data and Forecast of Japan Tartaric acid Market Revenues & Volume By Food & beverages for the Period 2022-2032
- Historical Data and Forecast of Japan Tartaric acid Market Revenues & Volume By Pharmaceuticals for the Period 2022-2032
- Historical Data and Forecast of Japan Tartaric acid Market Revenues & Volume By Cosmetics & personal care products for the Period 2022-2032
- Historical Data and Forecast of Japan Tartaric acid Market Revenues & Volume By Others for the Period 2022-2032
- Historical Data and Forecast of Japan Tartaric acid Market Revenues & Volume By Type for the Period 2022-2032
- Historical Data and Forecast of Japan Tartaric acid Market Revenues & Volume By Naturals for the Period 2022-2032
- Historical Data and Forecast of Japan Tartaric acid Market Revenues & Volume By Synthetic for the Period 2022-2032
- Japan Tartaric acid Import Export Trade Statistics
- Market Opportunity Assessment By Source
- Market Opportunity Assessment By Application
- Market Opportunity Assessment By Type
- Japan Tartaric acid Top Companies Market Share
- Japan Tartaric acid Competitive Benchmarking By Technical and Operational Parameters
- Japan Tartaric acid Company Profiles
- Japan Tartaric acid Key Strategic Recommendations
Market Covered
The following segment groups are covered in the report.
By Source
- Grapes & sun-dried raisins
- Maleic anhydride
- Others
By Application
- Food & beverages
- Pharmaceuticals
- Cosmetics & personal care products
- Others
By Type
- Naturals
- Synthetic