Jordan Clay Refractories Market (2026-2032) | Industry, Growth, Value, Revenue, Forecast, Size, Companies, Share, Analysis, Trends & Outlook
Market Forecast By Form (Bricks, Monolithic, Others), By Application (Construction, Steel Making, Cosmetics, Food Industry) And Competitive Landscape
| Product Code: ETC027726 | Publication Date: Oct 2020 | Updated Date: Jun 2026 | Product Type: Report | |
| Publisher: 6Wresearch | Author: Ravi Bhandari | No. of Pages: 70 | No. of Figures: 35 | No. of Tables: 5 |
Jordan Clay Refractories Market Summary
The jordan clay refractories market was estimated at USD 307 Million in 2025 and is projected to reach USD 421 Million by 2032, growing at a CAGR of 5.7% from 2026 to 2032.
Jordan Clay Refractories Market Year-wise Growth Rate and Key Drivers
This graph highlights how the Jordan Clay Refractories Market has steadily grown over the past five years, supported by major growth factors.
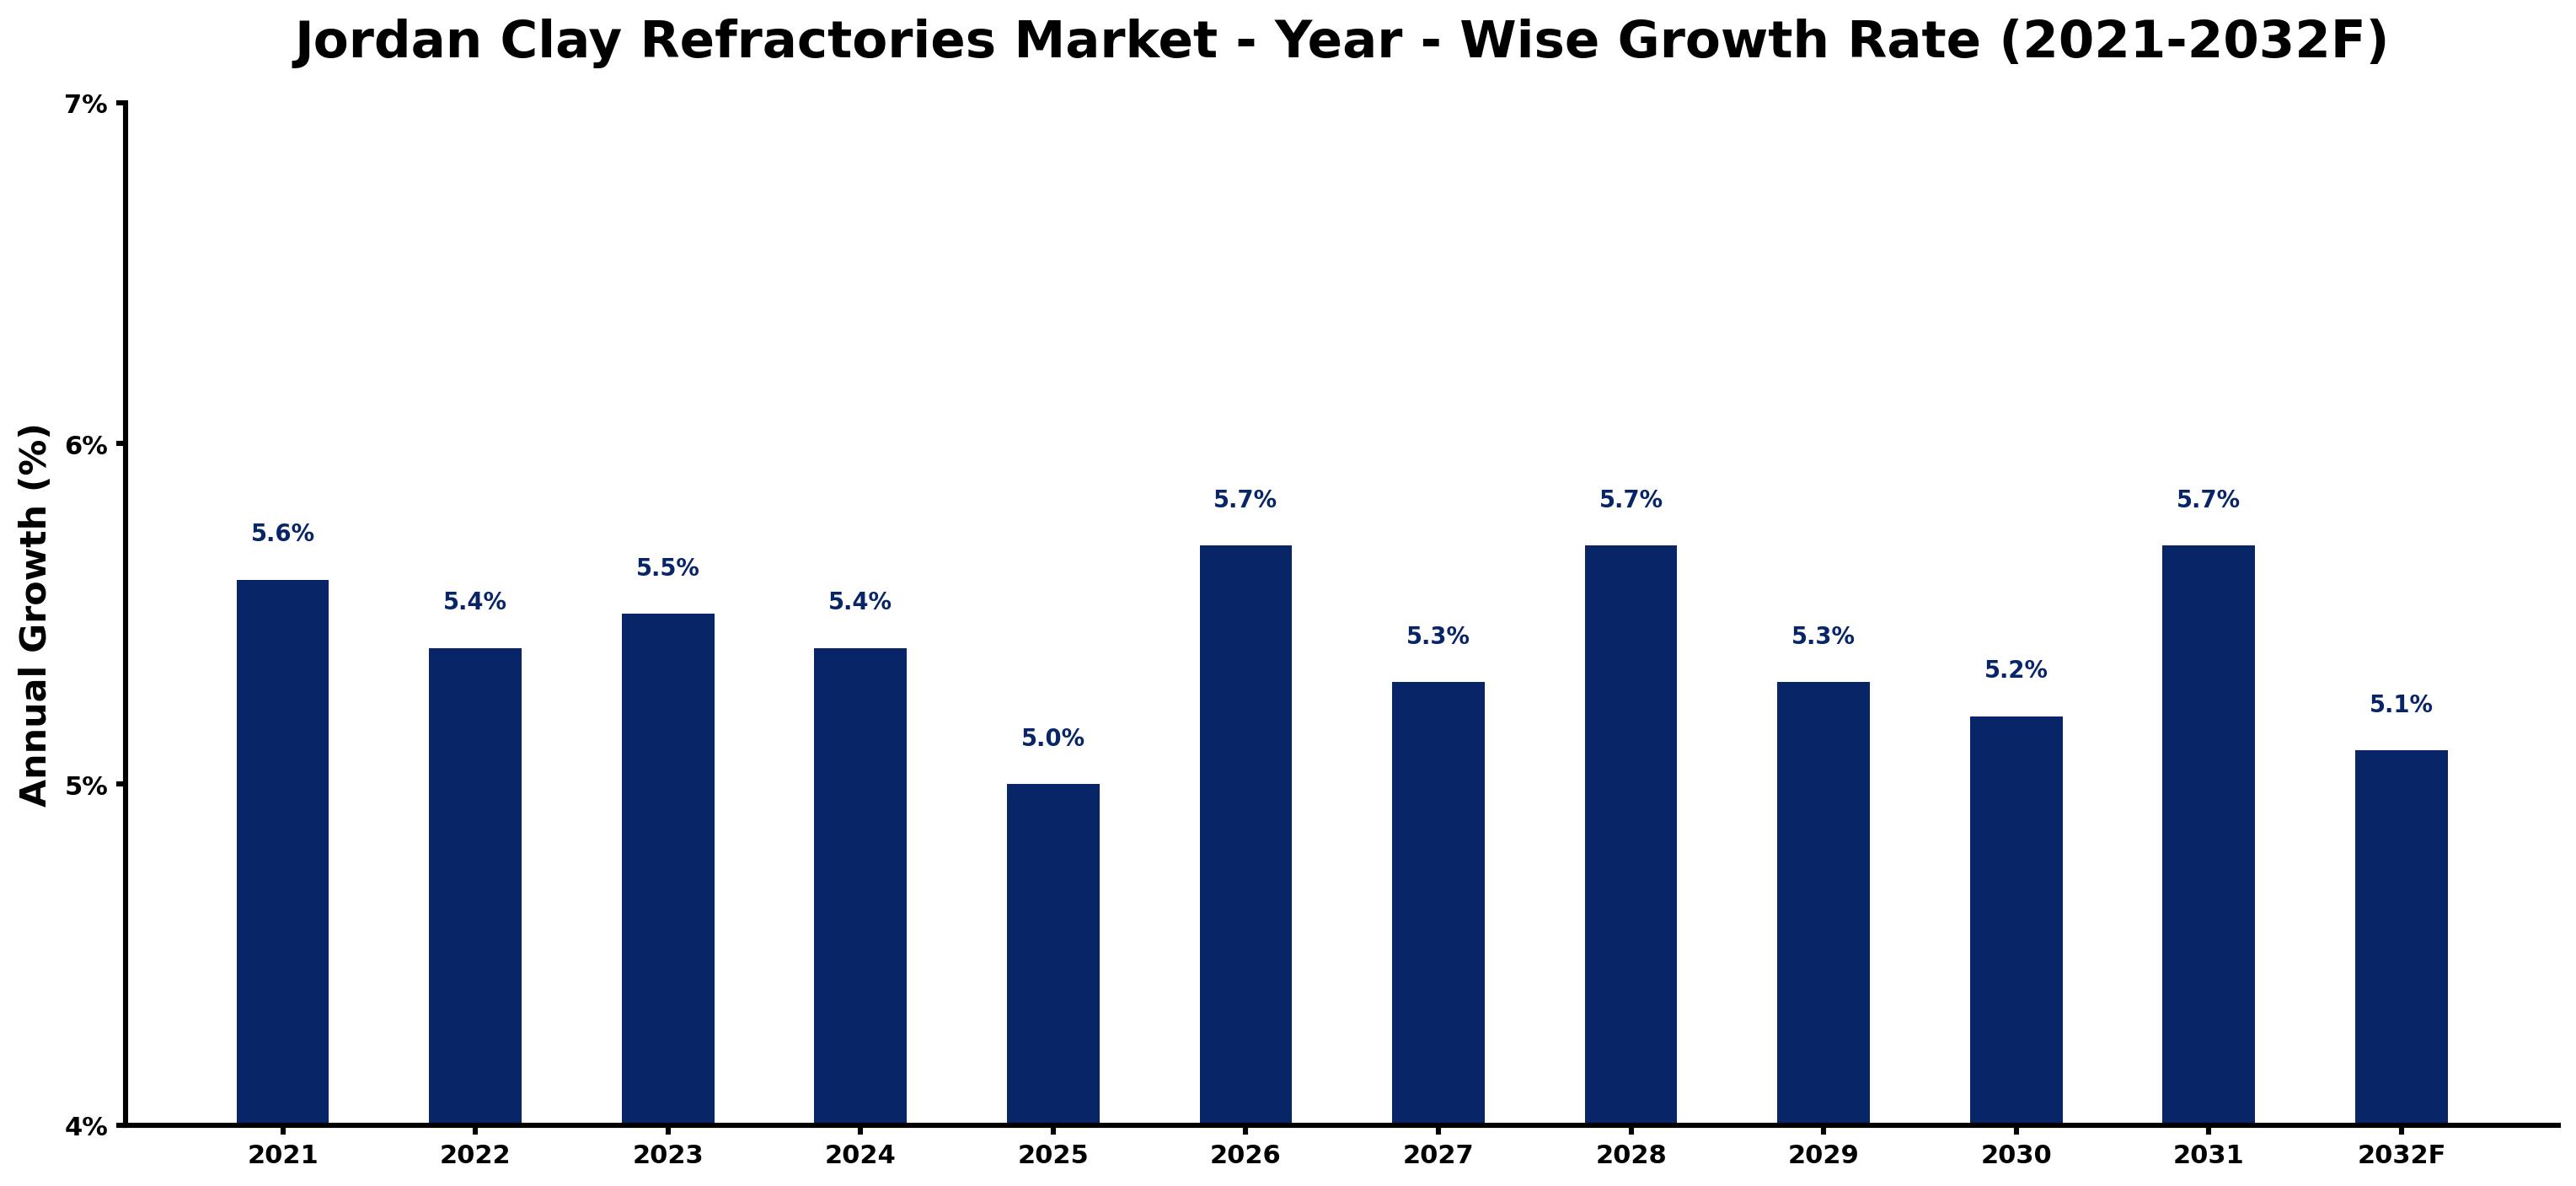
The table below presents the year wise growth rates along with the key drivers influencing the market
| Year | Growth Rate | Major Drivers |
| 2021 | 5.6% | Post-pandemic recovery in construction projects boosts demand for refractory materials. |
| 2022 | 5.4% | Local industries increasingly prioritize high-temperature materials for efficiency improvements. |
| 2023 | 5.5% | Emerging eco-friendly technologies prompt manufacturers to explore sustainable refractory options. |
| 2024 | 5.4% | Regional construction expansions tied to Neom project create lucrative market opportunities. |
| 2025 | 5.0% | Increased energy sector investments drive demand for durable refractories in Jordan. |
| 2026 | 5.7% | Growing focus on innovation results in enhanced product offerings across the market. |
| 2027 | 5.3% | Supply chain improvements facilitate easier access to advanced refractory materials. |
| 2028 | 5.7% | Emergence of local players intensifies competition, fostering product diversification strategies. |
| 2029 | 5.3% | Market consolidation trends lead to partnerships between manufacturers and end-users. |
| 2030 | 5.2% | Rising construction activity in neighboring GCC countries influences Jordan's refractory market. |
| 2031 | 5.7% | Technological advancements in manufacturing processes enhance product performance significantly. |
| 2032 | 5.1% | Sustainability goals drive investment in recycling processes for refractory materials. |
Note - Market size estimations and growth projections presented in this report are based on 6Wresearch's advanced forecasting approach, validated with industry datasets as of June 2026.
Jordan Clay Refractories Market Synopsis
The Jordan Clay Refractories Market is projected to reach 5.7% and witness significant growth during the forecast period (2026-2032). This growth is driven primarily by the expanding construction sector and the increasing use of refractory materials across various industries such as steel, cement, and glass manufacturing. The role of refractories as essential heat-resistant materials in high-temperature applications—from kilns to furnaces—makes them vital across these sectors, thereby propelling market dynamics in Jordan.
Jordan Clay Refractories Market Growth Drivers
The growth of the Jordan Clay Refractories Market can be attributed to several key factors:
- The construction sector in Jordan is experiencing rapid expansion, leading to increased demand for clay refractories used in building materials and infrastructure projects.
- The steel manufacturing industry is a significant consumer of clay refractories, utilizing these materials for lining furnaces that operate at extremely high temperatures.
- As the demand for cement rises due to urbanization and economic development, the need for reliable refractory materials in cement kilns has surged, thereby supporting market growth.
- Competitive pricing and quality improvements in local manufacturing are making Jordanian clay refractories more attractive for industries seeking efficient production processes.
- Ongoing innovation in refractory technology is enabling industries to enhance their operational efficiencies, further bolstering the demand for clay refractories.
Jordan Clay Refractories Market Challenges and Restraints
While the Jordan Clay Refractories Market is poised for growth, several challenges must be addressed:
- The continuous need for innovation presents a challenge for manufacturers, requiring them to develop products that comply with evolving industry standards and regulations.
- Sourcing high-quality raw materials remains a critical issue, as fluctuations in pricing can impact production costs and profitability.
- Maintaining energy-efficient production processes is essential for manufacturers aiming to compete in a market that is increasingly focused on sustainability.
- The reliance on imported raw materials can lead to supply chain vulnerabilities, affecting the stability and availability of the final product.
- Adapting to regulatory changes related to environmental compliance can impose additional operational burdens on manufacturers within the clay refractories sector.
Jordan Clay Refractories Market Government Investment and Initiatives
The Jordanian government is actively supporting the clay refractories sector through various policies and initiatives aimed at enhancing the industry's competitiveness:
- Investment in industrial development has been prioritized, with funding allocated for infrastructure improvements that directly benefit the production capabilities of clay refractories.
- The Ministry of Industry and Trade is promoting research and development in the refractory materials sector, providing subsidies to encourage innovation and improve product quality.
- Specific regulations have been enacted to ensure that imported and locally produced refractory materials meet stringent quality standards essential for industrial applications.
- Public spending initiatives focused on construction and infrastructure are anticipated to bolster demand for clay refractories in several key sectors, including housing and commercial development.
- Collaborative efforts between the government and industry stakeholders are being implemented to foster sustainable practices and reduce the environmental impact of refractory production.
Jordan Clay Refractories Market Latest Developments (May 2025 - June 2026)
During the period from May 2025 to June 2026, the Jordan Clay Refractories Market has seen notable developments that reflect ongoing trends within the industry:
- The introduction of advanced refractory materials that offer enhanced thermal efficiency has started to reshape production practices, leading to improved operational outcomes across various industries.
- Efforts to streamline supply chains have intensified as manufacturers adapt to global market dynamics, aiming to secure a competitive edge through efficiency and cost-effectiveness.
- Increased collaboration between local manufacturers and international research institutions is fostering innovation, particularly in the development of eco-friendlier refractory products.
- The regulatory landscape has evolved, with new environmental standards being proposed to address sustainability concerns, prompting facilities to upgrade processes accordingly.
- Market players are prioritizing investments in energy-efficient technologies, aligning with the global shift towards sustainable manufacturing practices.
Jordan Clay Refractories Market - Key Attractiveness of the Report
- 10 Years of Market Numbers
- Historical Data Starting from 2022 to 2025
- Base Year: 2025
- Forecast Data until 2032
- Key Performance Indicators Impacting the Market
- Major Upcoming Developments and Projects
Key Highlights of the Report:
- Jordan Clay Refractories Market Outlook
- Market Size of Jordan Clay Refractories Market, 2025
- Forecast of Jordan Clay Refractories Market, 2032
- Historical Data and Forecast of Jordan Clay Refractories Revenues & Volume for the Period 2022-2032F
- Jordan Clay Refractories Market Trend Evolution
- Jordan Clay Refractories Market Drivers and Challenges
- Jordan Clay Refractories Price Trends
- Jordan Clay Refractories Porter's Five Forces
- Jordan Clay Refractories Industry Life Cycle
- Historical Data and Forecast of Jordan Clay Refractories Market Revenues & Volume By Form for the Period 2022-2032F
- Historical Data and Forecast of Jordan Clay Refractories Market Revenues & Volume By Bricks for the Period 2022-2032F
- Historical Data and Forecast of Jordan Clay Refractories Market Revenues & Volume By Monolithic for the Period 2022-2032F
- Historical Data and Forecast of Jordan Clay Refractories Market Revenues & Volume By Others for the Period 2022-2032F
- Historical Data and Forecast of Jordan Clay Refractories Market Revenues & Volume By Application for the Period 2022-2032F
- Historical Data and Forecast of Jordan Clay Refractories Market Revenues & Volume By Construction for the Period 2022-2032F
- Historical Data and Forecast of Jordan Clay Refractories Market Revenues & Volume By Steel Making for the Period 2022-2032F
- Historical Data and Forecast of Jordan Clay Refractories Market Revenues & Volume By Cosmetics for the Period 2022-2032F
- Historical Data and Forecast of Jordan Clay Refractories Market Revenues & Volume By Food Industry for the Period 2022-2032F
- Jordan Clay Refractories Import Export Trade Statistics
- Market Opportunity Assessment By Form
- Market Opportunity Assessment By Application
- Jordan Clay Refractories Top Companies Market Share
- Jordan Clay Refractories Competitive Benchmarking By Technical and Operational Parameters
- Jordan Clay Refractories Company Profiles
- Jordan Clay Refractories Key Strategic Recommendations
Frequently Asked Questions About the Market Study (FAQs):
Clay refractories are primarily used in high-temperature applications such as furnaces, kilns, and reactors within industries like steel, cement, and glass manufacturing.
Key growth drivers include the expansion of the construction sector, increasing industrial activity, and the growing demand for high-quality refractory materials across various manufacturing processes.
The government is enhancing competitiveness through investments in infrastructure, providing subsidies for R&D, and implementing regulations that ensure high standards for refractory products.
Manufacturers face challenges such as the need for ongoing innovation, sourcing quality raw materials, and adapting to evolving regulatory requirements while maintaining cost efficiency.
6Wresearch actively monitors the Jordan Clay Refractories Market and publishes its comprehensive annual report, highlighting emerging trends, growth drivers, revenue analysis, and forecast outlook. Our insights help businesses to make data-backed strategic decisions with ongoing market dynamics. Our analysts track relevent industries related to the Jordan Clay Refractories Market, allowing our clients with actionable intelligence and reliable forecasts tailored to emerging regional needs.
Yes, we provide customisation as per your requirements. To learn more, feel free to contact us on sales@6wresearch.com
1 Executive Summary |
2 Introduction |
2.1 Key Highlights of the Report |
2.2 Report Description |
2.3 Market Scope & Segmentation |
2.4 Research Methodology |
2.5 Assumptions |
3 Jordan Clay Refractories Market Overview |
3.1 Jordan Country Macro Economic Indicators |
3.2 Jordan Clay Refractories Market Revenues & Volume, 2022 & 2032F |
3.3 Jordan Clay Refractories Market - Industry Life Cycle |
3.4 Jordan Clay Refractories Market - Porter's Five Forces |
3.5 Jordan Clay Refractories Market Revenues & Volume Share, By Form, 2022 & 2032F |
3.6 Jordan Clay Refractories Market Revenues & Volume Share, By Application, 2022 & 2032F |
4 Jordan Clay Refractories Market Dynamics |
4.1 Impact Analysis |
4.2 Market Drivers |
4.3 Market Restraints |
5 Jordan Clay Refractories Market Trends |
6 Jordan Clay Refractories Market, By Types |
6.1 Jordan Clay Refractories Market, By Form |
6.1.1 Overview and Analysis |
6.1.2 Jordan Clay Refractories Market Revenues & Volume, By Form, 2022-2032F |
6.1.3 Jordan Clay Refractories Market Revenues & Volume, By Bricks, 2022-2032F |
6.1.4 Jordan Clay Refractories Market Revenues & Volume, By Monolithic, 2022-2032F |
6.1.5 Jordan Clay Refractories Market Revenues & Volume, By Others, 2022-2032F |
6.2 Jordan Clay Refractories Market, By Application |
6.2.1 Overview and Analysis |
6.2.2 Jordan Clay Refractories Market Revenues & Volume, By Construction, 2022-2032F |
6.2.3 Jordan Clay Refractories Market Revenues & Volume, By Steel Making, 2022-2032F |
6.2.4 Jordan Clay Refractories Market Revenues & Volume, By Cosmetics, 2022-2032F |
6.2.5 Jordan Clay Refractories Market Revenues & Volume, By Food Industry, 2022-2032F |
7 Jordan Clay Refractories Market Import-Export Trade Statistics |
7.1 Jordan Clay Refractories Market Export to Major Countries |
7.2 Jordan Clay Refractories Market Imports from Major Countries |
8 Jordan Clay Refractories Market Key Performance Indicators |
9 Jordan Clay Refractories Market - Opportunity Assessment |
9.1 Jordan Clay Refractories Market Opportunity Assessment, By Form, 2022 & 2032F |
9.2 Jordan Clay Refractories Market Opportunity Assessment, By Application, 2022 & 2032F |
10 Jordan Clay Refractories Market - Competitive Landscape |
10.1 Jordan Clay Refractories Market Revenue Share, By Companies, 2025 |
10.2 Jordan Clay Refractories Market Competitive Benchmarking, By Operating and Technical Parameters |
11 Company Profiles |
12 Recommendations |
13 Disclaimer |
Global Go To Market Strategy - 2030
Export potential enables firms to identify high-growth global markets with greater confidence by combining advanced trade intelligence with a structured quantitative methodology. The framework analyzes emerging demand trends and country-level import patterns while integrating macroeconomic and trade datasets such as GDP and population forecasts, bilateral import–export flows, tariff structures, elasticity differentials between developed and developing economies, geographic distance, and import demand projections. Using weighted trade values from 2020–2024 as the base period to project country-to-country export potential for 2030, these inputs are operationalized through calculated drivers such as gravity model parameters, tariff impact factors, and projected GDP per-capita growth. Through an analysis of hidden potentials, demand hotspots, and market conditions that are most favorable to success, this method enables firms to focus on target countries, maximize returns, and global expansion with data, backed by accuracy.
By factoring in the projected importer demand gap that is currently unmet and could be potential opportunity, it identifies the potential for the Exporter (Country) among 190 countries, against the general trade analysis, which identifies the biggest importer or exporter.
To discover high-growth global markets and optimize your business strategy:
Click Here
Pricing
- Single User License$ 1,995
- Department License$ 2,400
- Site License$ 3,120
- Global License$ 3,795

Leadership Perspectives from Industry Events
Search
Thought Leadership and Analyst Meet


Our Clients
6WResearch In News
- India Air Conditioner Market Set for Strong Rebound in 2026 After Weather-Led Correction and GST-Driven Recovery: 6Wresearch
- ADAS in India: How Automatic Emergency Braking, Blind Spot Detection & Driver Monitoring are Transforming Road Safety
- Doha a strategic location for EV manufacturing hub: IPA Qatar
- Demand for luxury TVs surging in the GCC, says Samsung
- Empowering Growth: The Thriving Journey of Bangladesh’s Cable Industry
- Demand for luxury TVs surging in the GCC, says Samsung
Latest Reports
- Nicaragua RPG Gaming Market (2026-2032)
- New Zealand RPG Gaming Market (2026-2032)
- Netherlands RPG Gaming Market (2026-2032)
- Nauru RPG Gaming Market (2026-2032)
- Namibia RPG Gaming Market (2026-2032)
- Mozambique RPG Gaming Market (2026-2032)
- Montenegro RPG Gaming Market (2026-2032)
- Mongolia RPG Gaming Market (2026-2032)
- Monaco RPG Gaming Market (2026-2032)
- Micronesia RPG Gaming Market (2026-2032)
Industry Events and Analyst Meet

EV India Expo 2026

HIMTEX 2026

India Refining Summit 2026

India EV Show 2026

EV tech India Expo 2026
Whitepaper
- Middle East & Africa Commercial Security Market Click here to view more.
- Middle East & Africa Fire Safety Systems & Equipment Market Click here to view more.
- GCC Drone Market Click here to view more.
- Middle East Lighting Fixture Market Click here to view more.
- GCC Physical & Perimeter Security Market Click here to view more.