Jordan Flake Graphite Market (2026-2032) Outlook | Trends, Companies, Analysis, Value, Industry, Growth, Forecast, Size, Revenue, Share
Market Forecast By Flake Size (Jumbo, Large, Medium, Small, Fine), By Application (Refractory, Foundry, Battery, Friction Product, Lubricant, Others), By End-users (Automotive, Power, Electronic) And Competitive Landscape
| Product Code: ETC103265 | Publication Date: Jun 2021 | Updated Date: Jun 2026 | Product Type: Report | |
| Publisher: 6Wresearch | Author: Summon Dutta | No. of Pages: 70 | No. of Figures: 35 | No. of Tables: 5 |
Jordan Flake Graphite Market Size, Share & Growth Rate
The Jordan Flake Graphite Market was estimated at USD 399 Million in 2025 and is projected to reach USD 541 Million by 2032, growing at a CAGR of 4.4% from 2026 to 2032. This growth trajectory is largely driven by the surging demand for high-purity flake graphite across various sectors, particularly in battery manufacturing and renewable energy technologies. As electric vehicle production accelerates and the electronics industry seeks advanced materials, Jordan’s superior graphite quality positions it favorably in a competitive global landscape.
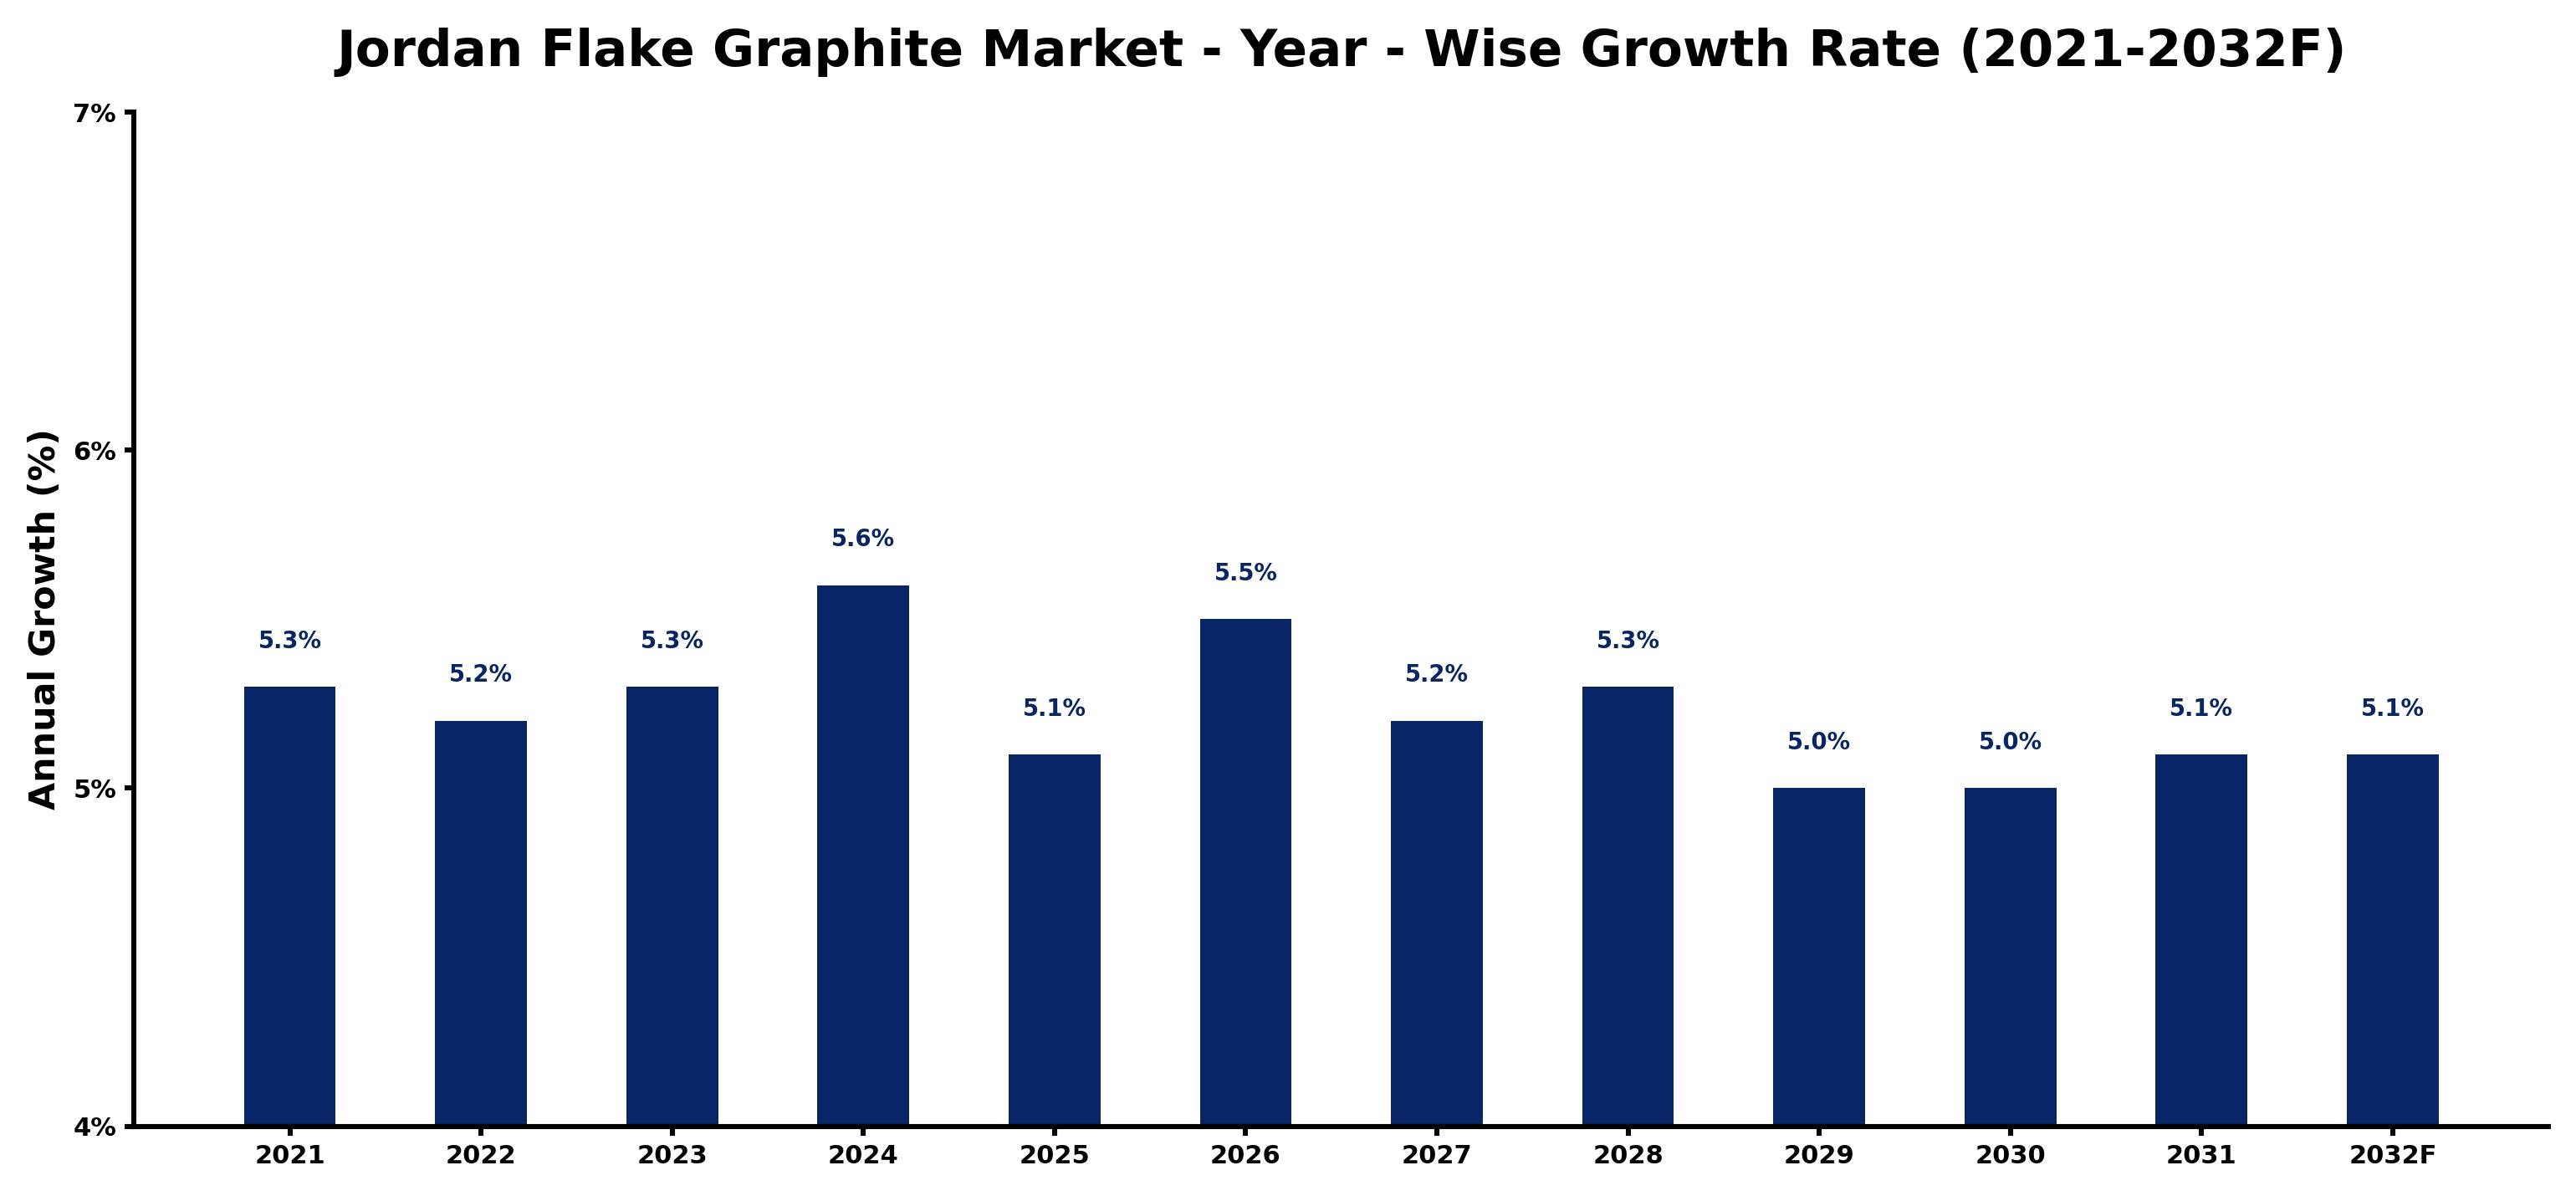
Jordan Flake Graphite Market Growth Rate Analysis (2021-2032)
The Jordan Flake Graphite market has exhibited a stable growth pattern, with yearly growth rates hovering around the 5% mark. Starting at 5.3% in 2021, the market experienced slight fluctuations, dipping to 5.2% in 2022 before recovering to 5.3% in 2023. Projections indicate continued expansion, reaching 5.6% in 2024, driven by increasing investments in sustainable energy technologies and the rising demand for advanced industrial applications. However, growth is expected to moderate slightly in the subsequent years, with rates of 5.1% in both 2025 and 2031. This stability suggests that while market pressures exist, particularly related to supply chain dynamics and competition, the ongoing digitalization within the sector and advancements in production techniques are supporting sustained demand.
Jordan Flake Graphite Market Year-wise Growth Rate and Key Drivers
This graph highlights how the Jordan Flake Graphite Market has steadily grown over the past five years, supported by major growth factors.
The table below presents the year‑wise growth rates along with the key drivers influencing the market
| Year | Growth Rate | Major Drivers |
| 2021 | 5.3% | Manufacturing investments in electric vehicle components drive graphite demand |
| 2022 | 5.2% | Renewed battery production investments boost graphite sourcing efforts |
| 2023 | 5.3% | Improved operational efficiencies increased graphite sourcing from local suppliers |
| 2024 | 5.6% | Advanced extraction technologies boosted Jordan's flake graphite production capacity |
| 2025 | 5.1% | Domestic mining investments boost local flake graphite production capacity |
| 2026 | 5.5% | New graphite processing facilities enhance battery component manufacturing capacity |
| 2027 | 5.2% | Manufacturing investments boosted local flake graphite processing capacity |
| 2028 | 5.3% | Export driven electric vehicle production surge boosts graphite procurement rates |
| 2029 | 5.0% | Upgraded graphite processing facilities boost domestic supply chain efficiency |
| 2030 | 5.0% | Manufacturing investments in processing facilities boost graphite supply chain reliability |
| 2031 | 5.1% | Technological advancements in processing improve graphite product quality and yield |
| 2032 | 5.1% | Improved mining technology boosts efficiency in graphite extraction processes |
Note - Market size estimations and growth projections presented in this report are based on 6Wresearch’s advanced forecasting approach, validated with industry datasets as of June 2026.
Jordan Flake Graphite Market Synopsis
Jordan is recognized for its high-quality flake graphite, which boasts exceptional purity and conductivity. This characteristic makes it particularly valuable for applications in lithium-ion batteries, lubricants, and refractory materials, setting a solid foundation for market expansion. Moreover, the local mining industry is witnessing significant investments aimed at enhancing production capabilities to meet escalating global demand.
The increasing trend towards sustainable technologies further amplifies the demand for Jordanian flake graphite. As industries shift their focus to greener products, the use of natural graphite in electric vehicles and renewable energy storage systems positions Jordan as a crucial player in supporting this global transition.
Jordan Flake Graphite Market Key Takeaways
- The market is driven by rising demand from battery manufacturing, automotive, and electronics sectors.
- Investment in mining and processing facilities is crucial to meet global demand effectively.
- Technological advancements are enhancing production processes and product quality.
- Jordan's strategic geopolitical location provides a competitive advantage for export.
- Government initiatives are fostering industry growth through financial incentives and regulations.
Evaluation of Restraints in Jordan Flake Graphite Market
Despite its growth potential, the Jordan Flake Graphite Market faces several restraints. Fluctuations in global demand for graphite can create challenges in forecasting production levels. Additionally, the rise of synthetic graphite as an alternative material threatens the natural graphite market, demanding strategic responses from local producers. Strict environmental regulations also pose compliance challenges, impacting operational efficiency and increasing costs for businesses in the sector. Addressing these hurdles will require innovation and a commitment to sustainable practices.
Jordan Flake Graphite Market Trends
Current trends indicate a growing emphasis on high-purity graphite products tailored for advanced applications. As industries seek to enhance performance and efficiency, investments in research and development are leading to breakthroughs in graphite applications. Additionally, the sustainable manufacturing trend is prompting companies to explore environmentally friendly mining practices, aligning with global efforts towards sustainability and reduced carbon footprints.
Jordan Flake Graphite Market Opportunities
The market presents substantial investment opportunities, particularly in the context of the electric vehicle revolution and the increasing need for energy storage solutions. Investors are likely to find significant returns by engaging with local graphite mining firms or exploring new exploration projects. Moreover, as demand for green technologies escalates, the need for natural flake graphite from Jordan can further enhance market attractiveness, encouraging partnerships and innovations in the sector.
Government Initiatives in the Jordan Flake Graphite Market
The Jordanian government is actively promoting the flake graphite market through a range of supportive policies. Financial incentives are being offered to local graphite mining companies to bolster production capacity and increase export competitiveness. Additionally, regulations aimed at ensuring sustainable mining practices are being implemented to protect the environment, demonstrating the government's commitment to balancing economic growth with ecological responsibility.
Future Insights of the Jordan Flake Graphite Market
Looking ahead to 2026-2032, the future of the Jordan Flake Graphite Market appears robust. As industries increasingly adopt electric vehicles and renewable energy solutions, the demand for high-quality graphite will continue to rise. Jordan's position as a reliable supplier of premium flake graphite, coupled with ongoing technological advancements, is expected to foster sustained market growth. The strategic focus on innovation and collaboration will be pivotal in capitalizing on emerging opportunities.
Jordan Flake Graphite Market Latest Developments (May 2025 - June 2026)
Recent months have witnessed a notable increase in activities aimed at expanding mining operations in Jordan. Companies are prioritizing investments in advanced processing technologies to enhance product quality and efficiency. Furthermore, collaboration between government and private sectors has intensified, focusing on sustainable mining practices and the promotion of Jordanian graphite on the international stage. This collaborative approach is expected to strengthen the sector's resilience in an ever-evolving market landscape.
Jordan Flake Graphite Market - Key Attractiveness of the Report
- 10 Years of Market Numbers
- Historical Data Starting from 2022 to 2025
- Base Year: 2025
- Forecast Data until 2032
- Key Performance Indicators Impacting the Market
- Major Upcoming Developments and Projects
Key Highlights of the Report:
- Jordan Flake Graphite Market Outlook
- Market Size of Jordan Flake Graphite Market, 2025
- Forecast of Jordan Flake Graphite Market, 2032
- Historical Data and Forecast of Jordan Flake Graphite Revenues & Volume for the Period 2022-2032F
- Jordan Flake Graphite Market Trend Evolution
- Jordan Flake Graphite Market Drivers and Challenges
- Jordan Flake Graphite Price Trends
- Jordan Flake Graphite Porter's Five Forces
- Jordan Flake Graphite Industry Life Cycle
- Historical Data and Forecast of Jordan Flake Graphite Market Revenues & Volume By Flake Size for the Period 2022-2032F
- Historical Data and Forecast of Jordan Flake Graphite Market Revenues & Volume By Jumbo for the Period 2022-2032F
- Historical Data and Forecast of Jordan Flake Graphite Market Revenues & Volume By Large for the Period 2022-2032F
- Historical Data and Forecast of Jordan Flake Graphite Market Revenues & Volume By Medium for the Period 2022-2032F
- Historical Data and Forecast of Jordan Flake Graphite Market Revenues & Volume By Small for the Period 2022-2032F
- Historical Data and Forecast of Jordan Flake Graphite Market Revenues & Volume By Fine for the Period 2022-2032F
- Historical Data and Forecast of Jordan Flake Graphite Market Revenues & Volume By Application for the Period 2022-2032F
- Historical Data and Forecast of Jordan Flake Graphite Market Revenues & Volume By Refractory for the Period 2022-2032F
- Historical Data and Forecast of Jordan Flake Graphite Market Revenues & Volume By Foundry for the Period 2022-2032F
- Historical Data and Forecast of Jordan Flake Graphite Market Revenues & Volume By Battery for the Period 2022-2032F
- Historical Data and Forecast of Jordan Flake Graphite Market Revenues & Volume By Friction Product for the Period 2022-2032F
- Historical Data and Forecast of Jordan Flake Graphite Market Revenues & Volume By Lubricant for the Period 2022-2032F
- Historical Data and Forecast of Jordan Flake Graphite Market Revenues & Volume By Others for the Period 2022-2032F
- Historical Data and Forecast of Jordan Flake Graphite Market Revenues & Volume By End-users for the Period 2022-2032F
- Historical Data and Forecast of Jordan Flake Graphite Market Revenues & Volume By Automotive for the Period 2022-2032F
- Historical Data and Forecast of Jordan Flake Graphite Market Revenues & Volume By Power for the Period 2022-2032F
- Historical Data and Forecast of Jordan Flake Graphite Market Revenues & Volume By Electronic for the Period 2022-2032F
- Jordan Flake Graphite Import Export Trade Statistics
- Market Opportunity Assessment By Flake Size
- Market Opportunity Assessment By Application
- Market Opportunity Assessment By End-users
- Jordan Flake Graphite Top Companies Market Share
- Jordan Flake Graphite Competitive Benchmarking By Technical and Operational Parameters
- Jordan Flake Graphite Company Profiles
- Jordan Flake Graphite Key Strategic Recommendations
Jordan Flake Graphite Market - Frequently Asked Questions
The Jordan Flake Graphite Market is projected to grow at a CAGR of 4.4% from 2026 to 2032, which aligns with the broader global trend of increasing demand for high-purity graphite, particularly driven by the electric vehicle and renewable energy sectors.
The demand for flake graphite in Jordan is primarily driven by its applications in lithium-ion batteries, lubricants, and refractory materials, all of which are experiencing significant growth in various industries.
Yes, Jordanian flake graphite is noted for its high purity and excellent conductivity, making it highly sought after in applications requiring superior material performance, especially in emerging technologies.
Key challenges include fluctuating global demand, competition from synthetic alternatives, and strict environmental regulations that can complicate mining operations and increase production costs.
Government policies in Jordan focus on providing financial incentives for local mining companies, regulating sustainable mining practices, and promoting the export of graphite, all of which contribute to strengthening the market's growth potential.
6Wresearch actively monitors the Jordan Flake Graphite Market and publishes its comprehensive annual report, highlighting emerging trends, growth drivers, revenue analysis, and forecast outlook. Our insights help businesses to make data-backed strategic decisions with ongoing market dynamics. Our analysts track relevent industries related to the Jordan Flake Graphite Market, allowing our clients with actionable intelligence and reliable forecasts tailored to emerging regional needs.
Yes, we provide customisation as per your requirements. To learn more, feel free to contact us on sales@6wresearch.com
1 Executive Summary |
2 Introduction |
2.1 Key Highlights of the Report |
2.2 Report Description |
2.3 Market Scope & Segmentation |
2.4 Research Methodology |
2.5 Assumptions |
3 Jordan Flake Graphite Market Overview |
3.1 Jordan Country Macro Economic Indicators |
3.2 Jordan Flake Graphite Market Revenues & Volume, 2022 & 2032F |
3.3 Jordan Flake Graphite Market - Industry Life Cycle |
3.4 Jordan Flake Graphite Market - Porter's Five Forces |
3.5 Jordan Flake Graphite Market Revenues & Volume Share, By Flake Size, 2022 & 2032F |
3.6 Jordan Flake Graphite Market Revenues & Volume Share, By Form, 2022 & 2032F |
3.7 Jordan Flake Graphite Market Revenues & Volume Share, By End-users, 2022 & 2032F |
4 Jordan Flake Graphite Market Dynamics |
4.1 Impact Analysis |
4.2 Market Drivers |
4.3 Market Restraints |
5 Jordan Flake Graphite Market Trends |
6 Jordan Flake Graphite Market, By Types |
6.1 Jordan Flake Graphite Market, By Flake Size |
6.1.1 Overview and Analysis |
6.1.2 Jordan Flake Graphite Market Revenues & Volume, By Flake Size, 2022-2032F |
6.1.3 Jordan Flake Graphite Market Revenues & Volume, By Jumbo, 2022-2032F |
6.1.4 Jordan Flake Graphite Market Revenues & Volume, By Large, 2022-2032F |
6.1.5 Jordan Flake Graphite Market Revenues & Volume, By Medium, 2022-2032F |
6.1.6 Jordan Flake Graphite Market Revenues & Volume, By Small, 2022-2032F |
6.1.7 Jordan Flake Graphite Market Revenues & Volume, By Fine, 2022-2032F |
6.2 Jordan Flake Graphite Market, By Application |
6.2.1 Overview and Analysis |
6.2.2 Jordan Flake Graphite Market Revenues & Volume, By Refractory, 2022-2032F |
6.2.3 Jordan Flake Graphite Market Revenues & Volume, By Foundry, 2022-2032F |
6.2.4 Jordan Flake Graphite Market Revenues & Volume, By Battery, 2022-2032F |
6.2.5 Jordan Flake Graphite Market Revenues & Volume, By Friction Product, 2022-2032F |
6.2.6 Jordan Flake Graphite Market Revenues & Volume, By Lubricant, 2022-2032F |
6.2.7 Jordan Flake Graphite Market Revenues & Volume, By Others, 2022-2032F |
6.3 Jordan Flake Graphite Market, By End-users |
6.3.1 Overview and Analysis |
6.3.2 Jordan Flake Graphite Market Revenues & Volume, By Automotive, 2022-2032F |
6.3.3 Jordan Flake Graphite Market Revenues & Volume, By Power, 2022-2032F |
6.3.4 Jordan Flake Graphite Market Revenues & Volume, By Electronic, 2022-2032F |
7 Jordan Flake Graphite Market Import-Export Trade Statistics |
7.1 Jordan Flake Graphite Market Export to Major Countries |
7.2 Jordan Flake Graphite Market Imports from Major Countries |
8 Jordan Flake Graphite Market Key Performance Indicators |
9 Jordan Flake Graphite Market - Opportunity Assessment |
9.1 Jordan Flake Graphite Market Opportunity Assessment, By Flake Size, 2022 & 2032F |
9.2 Jordan Flake Graphite Market Opportunity Assessment, By Application, 2022 & 2032F |
9.3 Jordan Flake Graphite Market Opportunity Assessment, By End-users, 2022 & 2032F |
10 Jordan Flake Graphite Market - Competitive Landscape |
10.1 Jordan Flake Graphite Market Revenue Share, By Companies, 2025 |
10.2 Jordan Flake Graphite Market Competitive Benchmarking, By Operating and Technical Parameters |
11 Company Profiles |
12 Recommendations |
13 Disclaimer |
Global Go To Market Strategy - 2030
Export potential enables firms to identify high-growth global markets with greater confidence by combining advanced trade intelligence with a structured quantitative methodology. The framework analyzes emerging demand trends and country-level import patterns while integrating macroeconomic and trade datasets such as GDP and population forecasts, bilateral import–export flows, tariff structures, elasticity differentials between developed and developing economies, geographic distance, and import demand projections. Using weighted trade values from 2020–2024 as the base period to project country-to-country export potential for 2030, these inputs are operationalized through calculated drivers such as gravity model parameters, tariff impact factors, and projected GDP per-capita growth. Through an analysis of hidden potentials, demand hotspots, and market conditions that are most favorable to success, this method enables firms to focus on target countries, maximize returns, and global expansion with data, backed by accuracy.
By factoring in the projected importer demand gap that is currently unmet and could be potential opportunity, it identifies the potential for the Exporter (Country) among 190 countries, against the general trade analysis, which identifies the biggest importer or exporter.
To discover high-growth global markets and optimize your business strategy:
Click Here
Pricing
- Single User License$ 1,995
- Department License$ 2,400
- Site License$ 3,120
- Global License$ 3,795

Leadership Perspectives from Industry Events
Search
Thought Leadership and Analyst Meet


Our Clients
6WResearch In News
- India Air Conditioner Market Set for Strong Rebound in 2026 After Weather-Led Correction and GST-Driven Recovery: 6Wresearch
- ADAS in India: How Automatic Emergency Braking, Blind Spot Detection & Driver Monitoring are Transforming Road Safety
- Doha a strategic location for EV manufacturing hub: IPA Qatar
- Demand for luxury TVs surging in the GCC, says Samsung
- Empowering Growth: The Thriving Journey of Bangladesh’s Cable Industry
- Demand for luxury TVs surging in the GCC, says Samsung
Latest Reports
- Nicaragua RPG Gaming Market (2026-2032)
- New Zealand RPG Gaming Market (2026-2032)
- Netherlands RPG Gaming Market (2026-2032)
- Nauru RPG Gaming Market (2026-2032)
- Namibia RPG Gaming Market (2026-2032)
- Mozambique RPG Gaming Market (2026-2032)
- Montenegro RPG Gaming Market (2026-2032)
- Mongolia RPG Gaming Market (2026-2032)
- Monaco RPG Gaming Market (2026-2032)
- Micronesia RPG Gaming Market (2026-2032)
Industry Events and Analyst Meet

HIMTEX 2026

India Refining Summit 2026

India EV Show 2026

EV tech India Expo 2026

Auto Tech Asia 2026
Whitepaper
- Middle East & Africa Commercial Security Market Click here to view more.
- Middle East & Africa Fire Safety Systems & Equipment Market Click here to view more.
- GCC Drone Market Click here to view more.
- Middle East Lighting Fixture Market Click here to view more.
- GCC Physical & Perimeter Security Market Click here to view more.