Georgia Flake Graphite Market (2026-2032) Outlook | Industry, Forecast, Value, Analysis, Growth, Revenue, Companies, Trends, Size & Share
Market Forecast By Flake Size (Jumbo, Large, Medium, Small, Fine), By Application (Refractory, Foundry, Battery, Friction Product, Lubricant, Others), By End-users (Automotive, Power, Electronic) And Competitive Landscape
| Product Code: ETC103279 | Publication Date: Jun 2021 | Updated Date: Jun 2026 | Product Type: Report | |
| Publisher: 6Wresearch | Author: Vasudha | No. of Pages: 70 | No. of Figures: 35 | No. of Tables: 5 |
Georgia Flake Graphite Market Size, Share & Growth Rate
The Georgia Flake Graphite Market was estimated at USD 1306 Million in 2025 and is projected to reach USD 1900 Million by 2032, growing at a CAGR of 5.5% from 2026 to 2032. This growth is primarily driven by the surging demand for flake graphite in lithium-ion batteries, spurred by the booming electric vehicle sector. Furthermore, the expansion of renewable energy systems continues to elevate the need for high-quality graphite in energy storage applications, underpinning the market's positive trajectory.
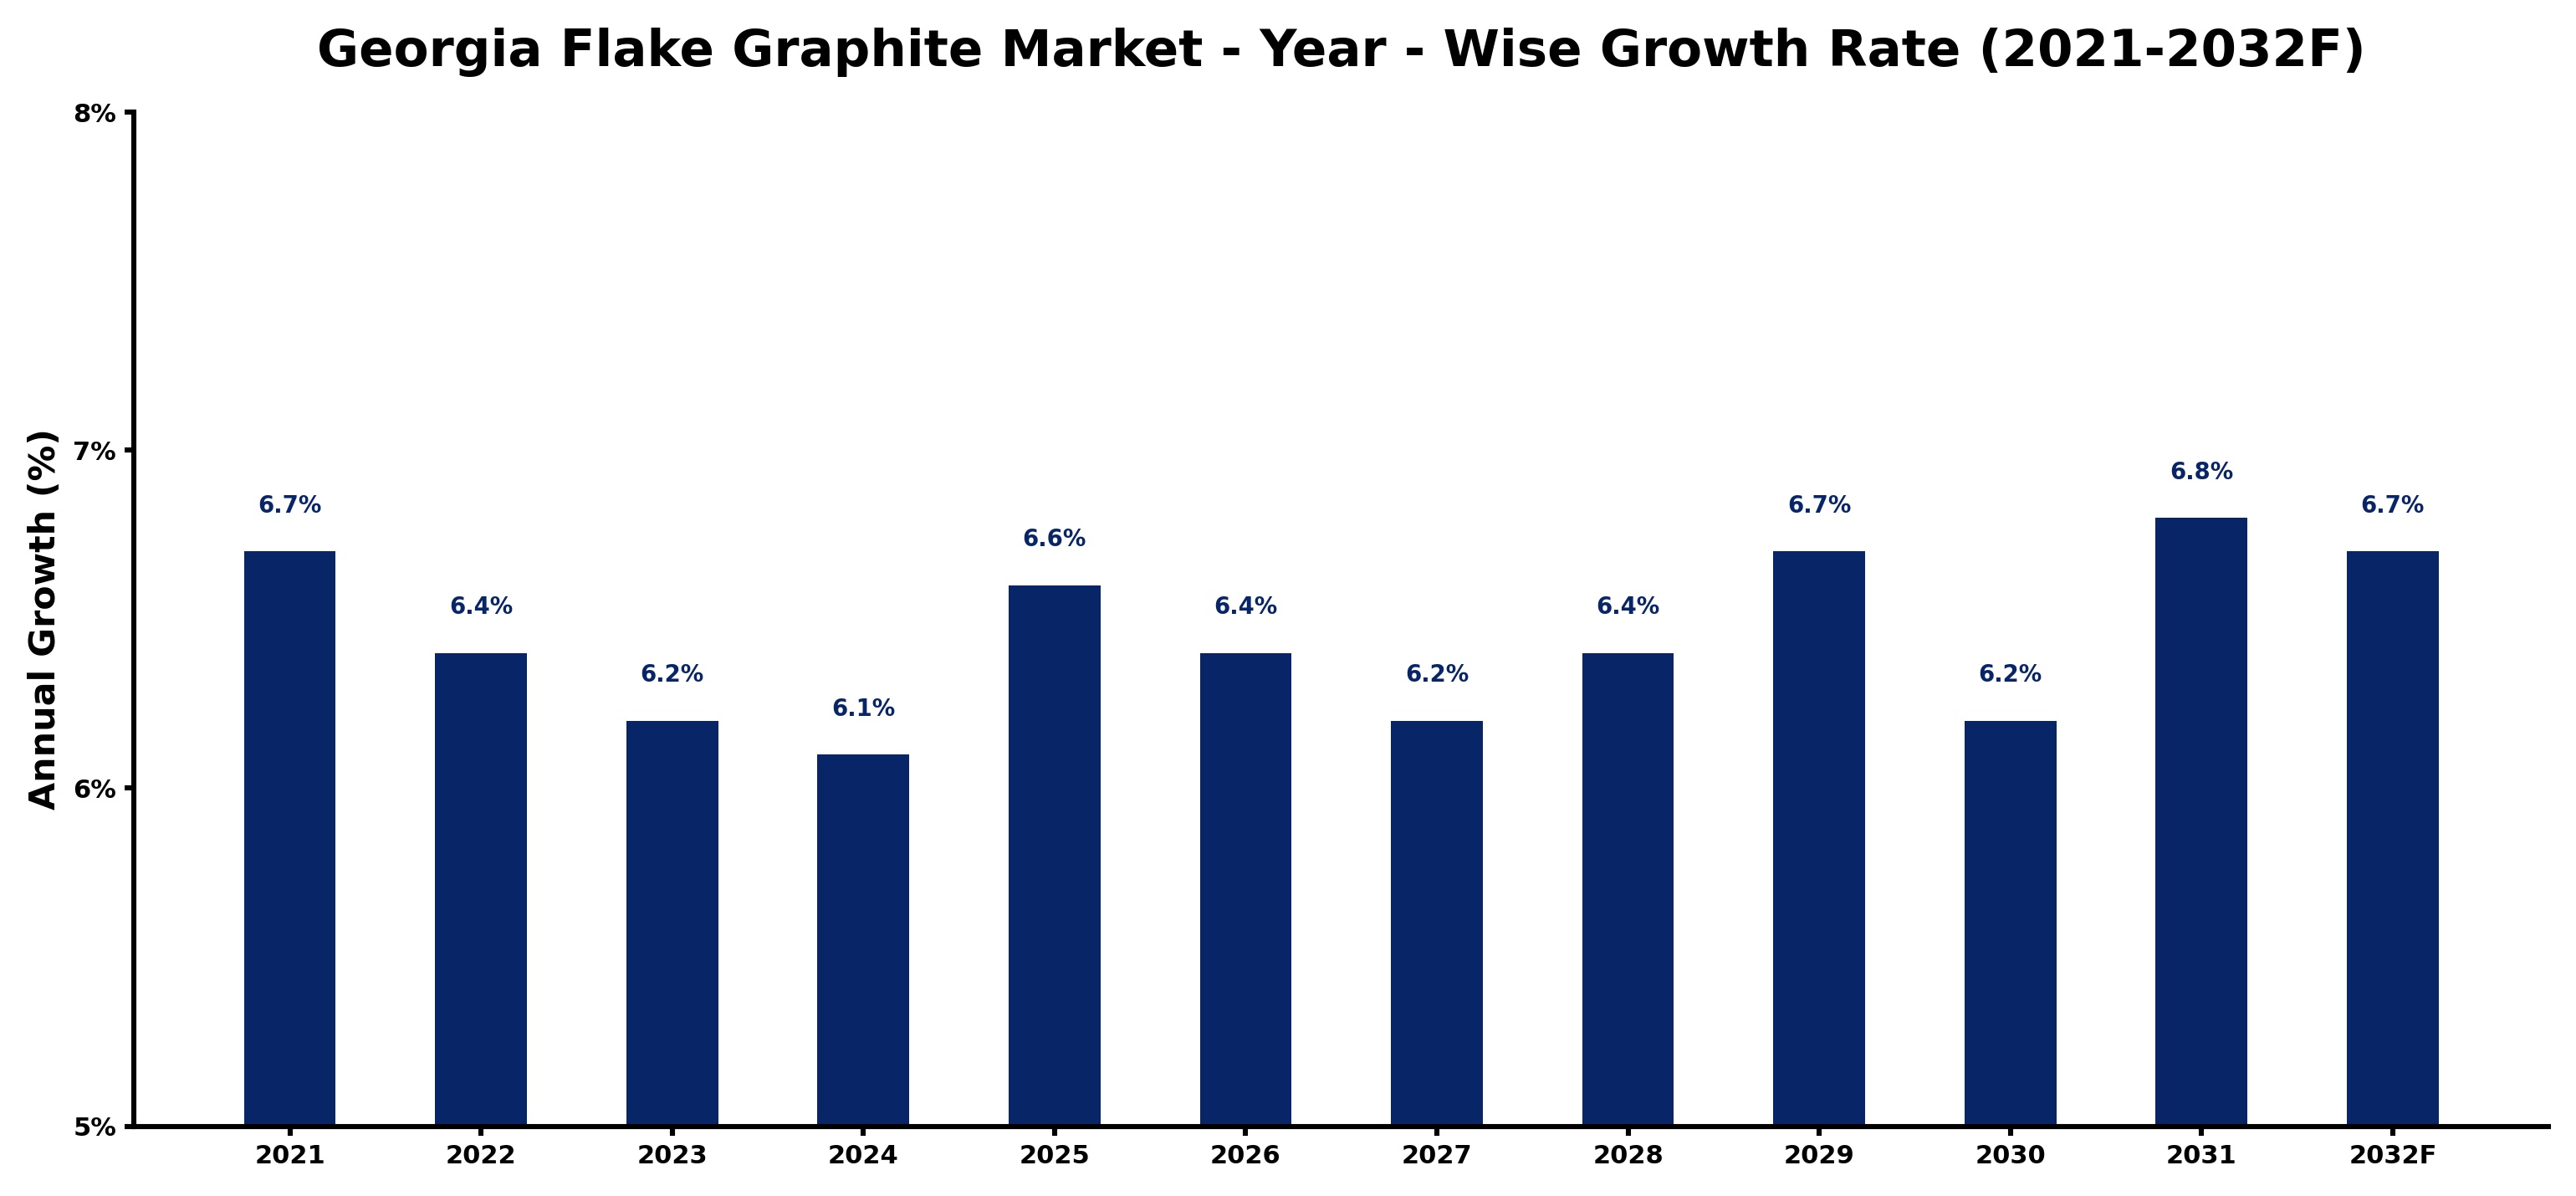
Georgia Flake Graphite Market Growth Rate Analysis (2021-2032)
The Georgia Flake Graphite Market exhibited a stable growth pattern, with annual increases ranging from 6.1% to 6.8% between 2021 and 2032. The growth peaked at 6.8% in 2031, driven by heightened industrial demand, particularly in lithium-ion battery production, which aligns with the ongoing energy transition. While growth tapered slightly to 6.1% in 2024 due to fluctuations in supply chains, a resurgence to 6.7% in 2029 reflects renewed investments in mining infrastructure and technological advancements that enhance extraction efficiency. Policy support for green technologies further bolstered demand, ensuring the market's resilience and steady expansion in the face of global economic challenges.
Georgia Flake Graphite Market Year-wise Growth Rate and Key Drivers
This graph highlights how the Georgia Flake Graphite Market has steadily grown over the past five years, supported by major growth factors.
The table below presents the year‑wise growth rates along with the key drivers influencing the market
| Year | Growth Rate | Major Drivers |
| 2021 | 6.7% | Investment in advanced milling technologies boosts graphite purity standards |
| 2022 | 6.4% | Technological advancements in processing elevate flake graphite purity levels |
| 2023 | 6.2% | Improved supply chain logistics boosted flake graphite export efficiency |
| 2024 | 6.1% | Local battery manufacturers expand production to meet electric vehicle demand |
| 2025 | 6.6% | Domestic electric vehicle production boosts flake graphite sourcing requirements |
| 2026 | 6.4% | New graphite mine developments boost local manufacturing capacity |
| 2027 | 6.2% | Accelerated graphite sourcing aligned with electric vehicle battery manufacturing |
| 2028 | 6.4% | Technology integration in graphite processing improved production efficiency |
| 2029 | 6.7% | Export driven demand for flake graphite boosts battery manufacturing investments |
| 2030 | 6.2% | Supply chain optimizations boosted flake graphite production efficiency |
| 2031 | 6.8% | New graphite processing plants enhance supply chain efficiency and output |
| 2032 | 6.7% | Manufacturing investments in battery materials boosted graphite processing capabilities |
Note - Market size estimations and growth projections presented in this report are based on 6Wresearch’s advanced forecasting approach, validated with industry datasets as of June 2026.
Georgia Flake Graphite Market Synopsis
Georgia boasts some of the highest-quality flake graphite deposits in the United States, a significant factor that enhances its position in the global market. The unique properties of flake graphite, including exceptional thermal and electrical conductivity, make it indispensable in various applications beyond batteries, like lubricants and refractory materials.
As the demand for eco-friendly solutions rises, Georgia’s flake graphite producers are increasingly focusing on sustainable practices. This commitment is not only beneficial for the environment but also aligns with the growing consumer preference for responsibly sourced materials, thereby bolstering the market’s potential for future growth.
Georgia Flake Graphite Market Key Takeaways
- The market is experiencing robust growth driven by the electric vehicle and renewable energy sectors.
- Georgia's high-quality graphite deposits provide a competitive advantage on the global stage.
- Sustainable sourcing and production practices are becoming increasingly important for consumers and manufacturers.
- Investment in technological advancements is essential for meeting rising demand and enhancing production efficiency.
- The market is poised to benefit from government support and favorable mining regulations.
Evaluation of Restraints in Georgia Flake Graphite Market
Despite the optimistic outlook, the Georgia Flake Graphite Market faces several constraints. Fluctuating global demand for graphite and unpredictable pricing dynamics can hinder growth strategies. Additionally, competition from synthetic graphite producers presents challenges to traditional mining operations. Environmental regulations also impact the operations of mining companies, necessitating compliance measures that can be costly. These factors collectively create a landscape where industry players must continuously adapt to maintain a competitive edge.
Georgia Flake Graphite Market Trends
Current trends within the Georgia Flake Graphite Market indicate a surge in demand particularly influenced by the electric vehicle industry's rapid expansion. Innovations in battery technology, alongside increased investments in renewable energy, are propelling the need for higher-quality graphite materials. Additionally, a marked shift toward environmentally sustainable production methods is emerging, as stakeholders seek to meet both regulatory requirements and consumer expectations.
Georgia Flake Graphite Market Opportunities
Opportunities abound in the Georgia Flake Graphite Market, primarily fueled by advancements in electric vehicle technology and energy storage solutions. Investors may find attractive prospects in companies focused on sustainable mining practices and innovative production techniques. The state's established infrastructure and favorable mining regulations further enhance its allure as a prime location for investment in flake graphite operations.
Government Initiatives in the Georgia Flake Graphite Market
Government policies play a crucial role in shaping the Georgia Flake Graphite Market. Authorities are promoting investment in mining projects through incentives and streamlined permitting processes. Additionally, there are initiatives aimed at enhancing environmental protection standards, ensuring that sustainable practices are integrated into mining operations. By supporting research and development, the government is fostering innovation within the sector, ultimately strengthening Georgia's position in the global graphite marketplace.
Future Insights of the Georgia Flake Graphite Market
Looking ahead to 2026-2032, the Georgia Flake Graphite Market is likely to witness steady growth. The increasing adoption of electric vehicles will continue to drive demand, complemented by advancements in energy storage technologies. As industries explore new applications for graphite, such as in fuel cells and nuclear reactors, the market stands to benefit from these evolving technological trends, solidifying its importance in various sectors.
Georgia Flake Graphite Market Latest Developments (May 2025 - June 2026)
Recent developments in the Georgia Flake Graphite Market illustrate a significant shift towards automation and advanced processing techniques among producers. Additionally, stakeholders are increasingly collaborating with research institutions to enhance material efficiency and sustainability. The market is also experiencing a surge in demand for custom graphite solutions tailored to specific industrial applications, reflecting broader trends in consumer preferences.
Georgia Flake Graphite Market - Key Attractiveness of the Report
- 10 Years of Market Numbers
- Historical Data Starting from 2022 to 2025
- Base Year: 2025
- Forecast Data until 2032
- Key Performance Indicators Impacting the Market
- Major Upcoming Developments and Projects
Key Highlights of the Report:
- Georgia Flake Graphite Market Outlook
- Market Size of Georgia Flake Graphite Market, 2025
- Forecast of Georgia Flake Graphite Market, 2032
- Historical Data and Forecast of Georgia Flake Graphite Revenues & Volume for the Period 2022-2032F
- Georgia Flake Graphite Market Trend Evolution
- Georgia Flake Graphite Market Drivers and Challenges
- Georgia Flake Graphite Price Trends
- Georgia Flake Graphite Porter's Five Forces
- Georgia Flake Graphite Industry Life Cycle
- Historical Data and Forecast of Georgia Flake Graphite Market Revenues & Volume By Flake Size for the Period 2022-2032F
- Historical Data and Forecast of Georgia Flake Graphite Market Revenues & Volume By Jumbo for the Period 2022-2032F
- Historical Data and Forecast of Georgia Flake Graphite Market Revenues & Volume By Large for the Period 2022-2032F
- Historical Data and Forecast of Georgia Flake Graphite Market Revenues & Volume By Medium for the Period 2022-2032F
- Historical Data and Forecast of Georgia Flake Graphite Market Revenues & Volume By Small for the Period 2022-2032F
- Historical Data and Forecast of Georgia Flake Graphite Market Revenues & Volume By Fine for the Period 2022-2032F
- Historical Data and Forecast of Georgia Flake Graphite Market Revenues & Volume By Application for the Period 2022-2032F
- Historical Data and Forecast of Georgia Flake Graphite Market Revenues & Volume By Refractory for the Period 2022-2032F
- Historical Data and Forecast of Georgia Flake Graphite Market Revenues & Volume By Foundry for the Period 2022-2032F
- Historical Data and Forecast of Georgia Flake Graphite Market Revenues & Volume By Battery for the Period 2022-2032F
- Historical Data and Forecast of Georgia Flake Graphite Market Revenues & Volume By Friction Product for the Period 2022-2032F
- Historical Data and Forecast of Georgia Flake Graphite Market Revenues & Volume By Lubricant for the Period 2022-2032F
- Historical Data and Forecast of Georgia Flake Graphite Market Revenues & Volume By Others for the Period 2022-2032F
- Historical Data and Forecast of Georgia Flake Graphite Market Revenues & Volume By End-users for the Period 2022-2032F
- Historical Data and Forecast of Georgia Flake Graphite Market Revenues & Volume By Automotive for the Period 2022-2032F
- Historical Data and Forecast of Georgia Flake Graphite Market Revenues & Volume By Power for the Period 2022-2032F
- Historical Data and Forecast of Georgia Flake Graphite Market Revenues & Volume By Electronic for the Period 2022-2032F
- Georgia Flake Graphite Import Export Trade Statistics
- Market Opportunity Assessment By Flake Size
- Market Opportunity Assessment By Application
- Market Opportunity Assessment By End-users
- Georgia Flake Graphite Top Companies Market Share
- Georgia Flake Graphite Competitive Benchmarking By Technical and Operational Parameters
- Georgia Flake Graphite Company Profiles
- Georgia Flake Graphite Key Strategic Recommendations
Georgia Flake Graphite Market - Frequently Asked Questions
The market was estimated at USD 1306 Million in 2025 and is projected to reach USD 1900 Million by 2032, growing at a CAGR of 5.5% from 2026 to 2032.
Georgia's flake graphite is renowned for its high quality, which makes it highly sought after in various applications, particularly in the electric vehicle and energy storage sectors.
Investors are drawn to Georgia's favorable mining regulations, rich graphite deposits, and the increasing global demand for sustainable and high-quality graphite products.
Government initiatives are pivotal in promoting sustainable mining practices and streamlining regulatory processes, thereby fostering a conducive environment for investment and growth in the sector.
Key industries driving demand include automotive (especially electric vehicles), renewable energy, and electronics, where high-performance graphite is essential.
Major trends include the shift towards sustainable sourcing and production, increased automation in mining operations, and ongoing research to explore new applications for graphite.
6Wresearch actively monitors the Georgia Flake Graphite Market and publishes its comprehensive annual report, highlighting emerging trends, growth drivers, revenue analysis, and forecast outlook. Our insights help businesses to make data-backed strategic decisions with ongoing market dynamics. Our analysts track relevent industries related to the Georgia Flake Graphite Market, allowing our clients with actionable intelligence and reliable forecasts tailored to emerging regional needs.
Yes, we provide customisation as per your requirements. To learn more, feel free to contact us on sales@6wresearch.com
1 Executive Summary |
2 Introduction |
2.1 Key Highlights of the Report |
2.2 Report Description |
2.3 Market Scope & Segmentation |
2.4 Research Methodology |
2.5 Assumptions |
3 Georgia Flake Graphite Market Overview |
3.1 Georgia Country Macro Economic Indicators |
3.2 Georgia Flake Graphite Market Revenues & Volume, 2022 & 2032F |
3.3 Georgia Flake Graphite Market - Industry Life Cycle |
3.4 Georgia Flake Graphite Market - Porter's Five Forces |
3.5 Georgia Flake Graphite Market Revenues & Volume Share, By Flake Size, 2022 & 2032F |
3.6 Georgia Flake Graphite Market Revenues & Volume Share, By Form, 2022 & 2032F |
3.7 Georgia Flake Graphite Market Revenues & Volume Share, By End-users, 2022 & 2032F |
4 Georgia Flake Graphite Market Dynamics |
4.1 Impact Analysis |
4.2 Market Drivers |
4.3 Market Restraints |
5 Georgia Flake Graphite Market Trends |
6 Georgia Flake Graphite Market, By Types |
6.1 Georgia Flake Graphite Market, By Flake Size |
6.1.1 Overview and Analysis |
6.1.2 Georgia Flake Graphite Market Revenues & Volume, By Flake Size, 2022-2032F |
6.1.3 Georgia Flake Graphite Market Revenues & Volume, By Jumbo, 2022-2032F |
6.1.4 Georgia Flake Graphite Market Revenues & Volume, By Large, 2022-2032F |
6.1.5 Georgia Flake Graphite Market Revenues & Volume, By Medium, 2022-2032F |
6.1.6 Georgia Flake Graphite Market Revenues & Volume, By Small, 2022-2032F |
6.1.7 Georgia Flake Graphite Market Revenues & Volume, By Fine, 2022-2032F |
6.2 Georgia Flake Graphite Market, By Application |
6.2.1 Overview and Analysis |
6.2.2 Georgia Flake Graphite Market Revenues & Volume, By Refractory, 2022-2032F |
6.2.3 Georgia Flake Graphite Market Revenues & Volume, By Foundry, 2022-2032F |
6.2.4 Georgia Flake Graphite Market Revenues & Volume, By Battery, 2022-2032F |
6.2.5 Georgia Flake Graphite Market Revenues & Volume, By Friction Product, 2022-2032F |
6.2.6 Georgia Flake Graphite Market Revenues & Volume, By Lubricant, 2022-2032F |
6.2.7 Georgia Flake Graphite Market Revenues & Volume, By Others, 2022-2032F |
6.3 Georgia Flake Graphite Market, By End-users |
6.3.1 Overview and Analysis |
6.3.2 Georgia Flake Graphite Market Revenues & Volume, By Automotive, 2022-2032F |
6.3.3 Georgia Flake Graphite Market Revenues & Volume, By Power, 2022-2032F |
6.3.4 Georgia Flake Graphite Market Revenues & Volume, By Electronic, 2022-2032F |
7 Georgia Flake Graphite Market Import-Export Trade Statistics |
7.1 Georgia Flake Graphite Market Export to Major Countries |
7.2 Georgia Flake Graphite Market Imports from Major Countries |
8 Georgia Flake Graphite Market Key Performance Indicators |
9 Georgia Flake Graphite Market - Opportunity Assessment |
9.1 Georgia Flake Graphite Market Opportunity Assessment, By Flake Size, 2022 & 2032F |
9.2 Georgia Flake Graphite Market Opportunity Assessment, By Application, 2022 & 2032F |
9.3 Georgia Flake Graphite Market Opportunity Assessment, By End-users, 2022 & 2032F |
10 Georgia Flake Graphite Market - Competitive Landscape |
10.1 Georgia Flake Graphite Market Revenue Share, By Companies, 2025 |
10.2 Georgia Flake Graphite Market Competitive Benchmarking, By Operating and Technical Parameters |
11 Company Profiles |
12 Recommendations |
13 Disclaimer |
Global Go To Market Strategy - 2030
Export potential enables firms to identify high-growth global markets with greater confidence by combining advanced trade intelligence with a structured quantitative methodology. The framework analyzes emerging demand trends and country-level import patterns while integrating macroeconomic and trade datasets such as GDP and population forecasts, bilateral import–export flows, tariff structures, elasticity differentials between developed and developing economies, geographic distance, and import demand projections. Using weighted trade values from 2020–2024 as the base period to project country-to-country export potential for 2030, these inputs are operationalized through calculated drivers such as gravity model parameters, tariff impact factors, and projected GDP per-capita growth. Through an analysis of hidden potentials, demand hotspots, and market conditions that are most favorable to success, this method enables firms to focus on target countries, maximize returns, and global expansion with data, backed by accuracy.
By factoring in the projected importer demand gap that is currently unmet and could be potential opportunity, it identifies the potential for the Exporter (Country) among 190 countries, against the general trade analysis, which identifies the biggest importer or exporter.
To discover high-growth global markets and optimize your business strategy:
Click Here
Pricing
- Single User License$ 1,995
- Department License$ 2,400
- Site License$ 3,120
- Global License$ 3,795

Leadership Perspectives from Industry Events
Search
Thought Leadership and Analyst Meet


Our Clients
6WResearch In News
- India Air Conditioner Market Set for Strong Rebound in 2026 After Weather-Led Correction and GST-Driven Recovery: 6Wresearch
- ADAS in India: How Automatic Emergency Braking, Blind Spot Detection & Driver Monitoring are Transforming Road Safety
- Doha a strategic location for EV manufacturing hub: IPA Qatar
- Demand for luxury TVs surging in the GCC, says Samsung
- Empowering Growth: The Thriving Journey of Bangladesh’s Cable Industry
- Demand for luxury TVs surging in the GCC, says Samsung
Latest Reports
- Poland Fire Protection Systems Market (2026-2032)
- Cape Verde Portable Hand-Thrown Extinguisher Market (2026-2032)
- Canada Portable Hand-Thrown Extinguisher Market (2026-2032)
- Cameroon Portable Hand-Thrown Extinguisher Market (2026-2032)
- Burundi Portable Hand-Thrown Extinguisher Market (2026-2032)
- Burkina Faso Portable Hand-Thrown Extinguisher Market (2026-2032)
- Bulgaria Portable Hand-Thrown Extinguisher Market (2026-2032)
- Brunei Portable Hand-Thrown Extinguisher Market (2026-2032)
- Botswana Portable Hand-Thrown Extinguisher Market (2026-2032)
- Bosnia and Herzegovina Portable Hand-Thrown Extinguisher Market (2026-2032)
Industry Events and Analyst Meet

HIMTEX 2026

India Refining Summit 2026

India EV Show 2026

EV tech India Expo 2026

Auto Tech Asia 2026
Whitepaper
- Middle East & Africa Commercial Security Market Click here to view more.
- Middle East & Africa Fire Safety Systems & Equipment Market Click here to view more.
- GCC Drone Market Click here to view more.
- Middle East Lighting Fixture Market Click here to view more.
- GCC Physical & Perimeter Security Market Click here to view more.