Jordan Glass Reinforced Plastic Market (2026-2032) Outlook | Growth, Value, Size, Trends, Revenue, Share, Companies, Forecast, Industry & Analysis
Market Forecast By Type (Epoxy, Polyester, Vinyl Ester, Polyurethane, Others), By Method (Moulding Method, Pultrusion Method, Layup, Others), By Application (Pipes and Tanks, Wind Power Turbines, Storage Containers, Roofs, Floor Gratings, Steps and Stairs, Switch Actuators, Others), By End-Use (Building and Construction, Transportation, Electrical and Electronics, Oil and Gas, Mining, Water and Wastewater, Others) And Competitive Landscape
| Product Code: ETC264106 | Publication Date: Aug 2022 | Updated Date: Jul 2026 | Product Type: Market Research Report | |
| Publisher: 6Wresearch | Author: Sachin Kumar Rai | No. of Pages: 75 | No. of Figures: 35 | No. of Tables: 20 |
Jordan Glass Reinforced Plastic Market Size, Share & Growth Rate
The Jordan Glass Reinforced Plastic Market was estimated at USD 483 Million in 2025 and is projected to reach USD 633 Million by 2032, growing at a CAGR of 3.9% from 2026 to 2032. This growth trajectory is propelled by the surging demand for lightweight and durable materials across various sectors, notably construction, automotive, and aerospace. As industries increasingly prioritize sustainability and efficiency, the adoption of GRP products is anticipated to strengthen, enhancing their presence in both traditional and innovative applications.
Jordan Glass Reinforced Plastic Market Year-wise Growth Rate and Key Drivers
This graph highlights how the Jordan Glass Reinforced Plastic Market has steadily grown over the years, supported by major growth factors.
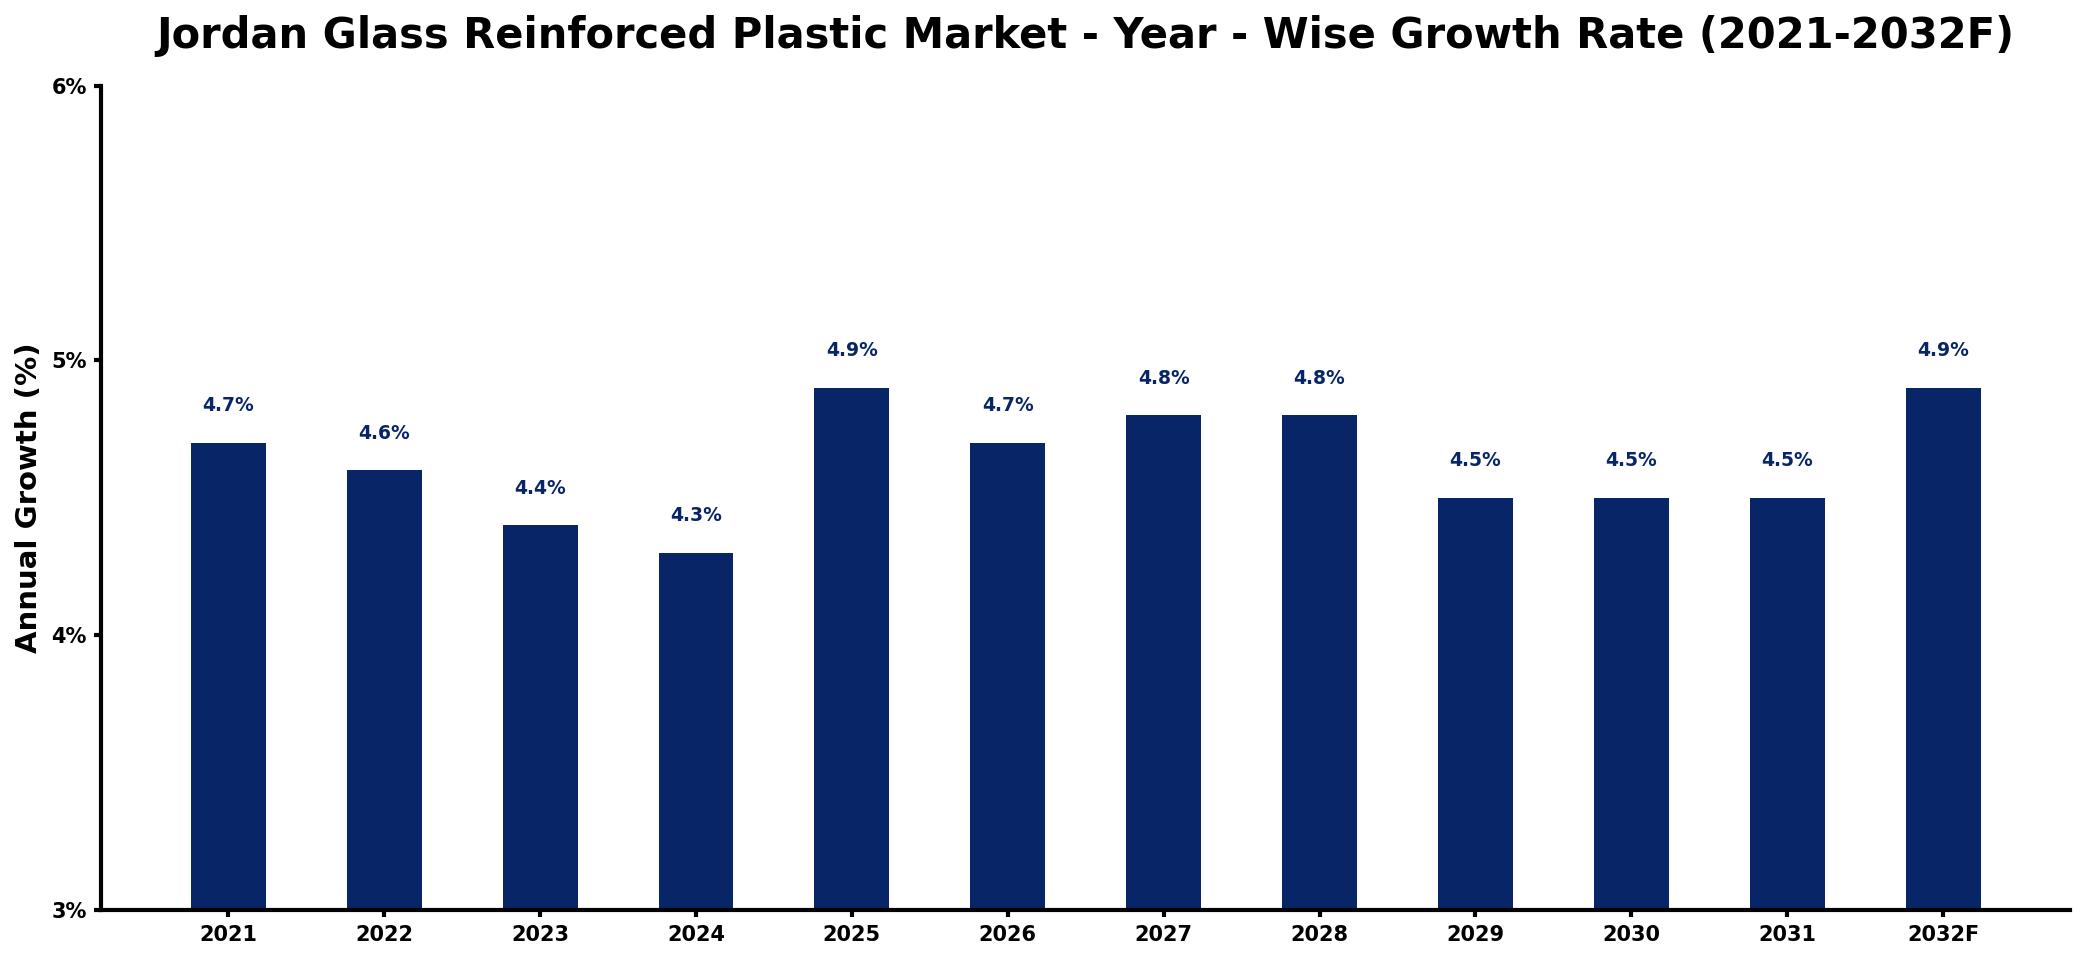
The table below presents the year‑wise growth rates along with the key drivers influencing the market
| Year | Growth Rate | Major Drivers |
| 2021 | 4.7% | Rising construction sector investments |
| 2022 | 4.6% | Increased demand from automotive industry |
| 2023 | 4.4% | Growing infrastructure development projects |
| 2024 | 4.3% | Expansion of renewable energy initiatives |
| 2025 | 4.9% | Surge in marine applications demand |
| 2026 | 4.7% | Advancements in manufacturing technologies |
| 2027 | 4.8% | Higher consumer preference for durability |
| 2028 | 4.8% | Increased adoption in aerospace sector |
| 2029 | 4.5% | Growing demand for lightweight materials |
| 2030 | 4.5% | strengthening underlying market demand |
| 2031 | 4.5% | Rising awareness of sustainability benefits |
| 2032 | 4.9% | Increased investment in research innovations |
Note: Market size estimations and growth projections presented in this report are based on 6Wresearch's proprietary forecasting methodology, utilizing the latest available industry data, government publications, and primary research inputs.
Jordan Glass Reinforced Plastic Market Synopsis
The Jordan Glass Reinforced Plastic (GRP) market is currently experiencing a wave of growth, driven primarily by advancements in manufacturing technologies and heightened industry awareness regarding the advantages of GRP. However, despite this momentum, the market is positioned for further expansion as more sectors recognize the superior properties of GRP in comparison to traditional materials, especially in construction projects.
Looking ahead, the adoption of GRP is likely to accelerate as infrastructure projects gain momentum and regulatory frameworks evolve to favor sustainable practices. The integration of GRP into diverse applications—including water tanks and automotive components—demonstrates the materials versatility, creating a robust foundation for continued growth.
Jordan Glass Reinforced Plastic Market Key Takeaways
- The market is driven by increasing demand for lightweight, durable materials in construction and other industries.
- Technological advancements are enhancing the quality and cost-efficiency of GRP manufacturing.
- Government policies supporting the GRP sector are fostering a conducive environment for market growth.
- Environmental concerns are promoting the use of GRP due to its recyclability and longevity compared to traditional materials.
- Potential challenges include competition from alternative materials and the need for improved market education.
Evaluation of Restraints in Jordan Glass Reinforced Plastic Market
While the Jordan GRP market is on an upward trajectory, several restraints continue to pose challenges. A significant hurdle is the limited awareness and understanding of GRP among prospective customers, which can hinder adoption rates. Additionally, the presence of cheaper alternative materials can tempt potential clients, particularly in price-sensitive sectors. Quality control is crucial, as inconsistent product quality can undermine customer confidence in GRP. Furthermore, the relatively small market size in Jordan may restrict the potential for economies of scale, making it challenging for manufacturers to compete effectively. Addressing these concerns is essential for the sustainable growth of the GRP market.
Jordan Glass Reinforced Plastic Market Trends
The Jordan GRP market is currently influenced by several trends, including an increasing focus on sustainability. As industries push for materials that are both efficient and environmentally friendly, GRP stands out due to its recyclability and durability. Additionally, advancements in manufacturing processes are helping to optimize production costs and improve the overall quality of GRP products, further driving adoption across sectors.
Moreover, the ongoing development of infrastructure projects in Jordan is leading to higher demand for GRP applications in construction. This trend is likely to be augmented by a shift towards energy-efficient solutions in various sectors, from automotive to aerospace, as stakeholders seek to minimize their carbon footprint.
Jordan Glass Reinforced Plastic Market Opportunities
Investment opportunities in the Jordan GRP market are abundant, particularly as sectors such as construction and automotive increasingly rely on lightweight and durable materials. The governments commitment to infrastructure development presents numerous avenues for growth, ranging from manufacturing GRP components to supplying essential raw materials. Additionally, innovative engineering and design services tailored for GRP projects could yield substantial returns for investors looking to capitalize on this expanding market.
Government Initiatives in the Jordan Glass Reinforced Plastic Market
The Jordanian government has proactively implemented policies to bolster the GRP market. Initiatives include financial incentives for manufacturers, support for research and development, and the establishment of regulations aimed at ensuring product quality and environmental safety. These strategies create a favorable business environment, encouraging innovation while enhancing the competitiveness of Jordanian GRP products both domestically and in international markets.
Future Insights of the Jordan Glass Reinforced Plastic Market
Looking ahead to 2026-2032, the Jordan GRP market is expected to sustain its growth momentum as industries increasingly embrace the materials beneficial properties. The anticipated rise in infrastructure projects, combined with a growing emphasis on sustainable practices, will likely further enhance demand. However, market players must remain vigilant to fluctuations in raw material prices and the evolving competitive landscape. Overall, the future remains bright for GRP in Jordan as its applications diversify and the market continues to mature.
Jordan Glass Reinforced Plastic Market Latest Developments (2025 - 2026)
In recent months, the Jordan GRP market has seen significant developments, particularly in terms of product innovation and strategic collaborations. Companies are increasingly focusing on enhancing their manufacturing capabilities to meet rising demand while ensuring product quality. Furthermore, partnerships between manufacturers and various sectors are fostering the introduction of advanced GRP solutions tailored to specific industry needs, thereby expanding application areas.
Jordan Glass Reinforced Plastic Market - Key Attractiveness of the Report
- 10 Years of Market Numbers
- Historical Data Starting from 2022 to 2025
- Base Year: 2025
- Forecast Data until 2032
- Key Performance Indicators Impacting the Market
- Major Upcoming Developments and Projects
Key Highlights of the Report:
- Jordan Glass Reinforced Plastic Market Outlook
- Market Size of Jordan Glass Reinforced Plastic Market, 2025
- Forecast of Jordan Glass Reinforced Plastic Market, 2032
- Historical Data and Forecast of Jordan Glass Reinforced Plastic Revenues & Volume for the Period 2022-2032F
- Jordan Glass Reinforced Plastic Market Trend Evolution
- Jordan Glass Reinforced Plastic Market Drivers and Challenges
- Jordan Glass Reinforced Plastic Price Trends
- Jordan Glass Reinforced Plastic Porter's Five Forces
- Jordan Glass Reinforced Plastic Industry Life Cycle
- Historical Data and Forecast of Jordan Glass Reinforced Plastic Market Revenues & Volume By Type for the Period 2022-2032F
- Historical Data and Forecast of Jordan Glass Reinforced Plastic Market Revenues & Volume By Epoxy for the Period 2022-2032F
- Historical Data and Forecast of Jordan Glass Reinforced Plastic Market Revenues & Volume By Polyester for the Period 2022-2032F
- Historical Data and Forecast of Jordan Glass Reinforced Plastic Market Revenues & Volume By Vinyl Ester for the Period 2022-2032F
- Historical Data and Forecast of Jordan Glass Reinforced Plastic Market Revenues & Volume By Polyurethane for the Period 2022-2032F
- Historical Data and Forecast of Jordan Glass Reinforced Plastic Market Revenues & Volume By Others for the Period 2022-2032F
- Historical Data and Forecast of Jordan Glass Reinforced Plastic Market Revenues & Volume By Method for the Period 2022-2032F
- Historical Data and Forecast of Jordan Glass Reinforced Plastic Market Revenues & Volume By Moulding Method for the Period 2022-2032F
- Historical Data and Forecast of Jordan Glass Reinforced Plastic Market Revenues & Volume By Pultrusion Method for the Period 2022-2032F
- Historical Data and Forecast of Jordan Glass Reinforced Plastic Market Revenues & Volume By Layup for the Period 2022-2032F
- Historical Data and Forecast of Jordan Glass Reinforced Plastic Market Revenues & Volume By Others for the Period 2022-2032F
- Historical Data and Forecast of Jordan Glass Reinforced Plastic Market Revenues & Volume By Application for the Period 2022-2032F
- Historical Data and Forecast of Jordan Glass Reinforced Plastic Market Revenues & Volume By Pipes and Tanks for the Period 2022-2032F
- Historical Data and Forecast of Jordan Glass Reinforced Plastic Market Revenues & Volume By Wind Power Turbines for the Period 2022-2032F
- Historical Data and Forecast of Jordan Glass Reinforced Plastic Market Revenues & Volume By Storage Containers for the Period 2022-2032F
- Historical Data and Forecast of Jordan Glass Reinforced Plastic Market Revenues & Volume By Roofs for the Period 2022-2032F
- Historical Data and Forecast of Jordan Glass Reinforced Plastic Market Revenues & Volume By Floor Gratings for the Period 2022-2032F
- Historical Data and Forecast of Jordan Glass Reinforced Plastic Market Revenues & Volume By Steps and Stairs for the Period 2022-2032F
- Historical Data and Forecast of Jordan Glass Reinforced Plastic Market Revenues & Volume By Switch Actuators for the Period 2022-2032F
- Historical Data and Forecast of Jordan Glass Reinforced Plastic Market Revenues & Volume By Others for the Period 2022-2032F
- Historical Data and Forecast of Jordan Glass Reinforced Plastic Market Revenues & Volume By End-Use for the Period 2022-2032F
- Historical Data and Forecast of Jordan Glass Reinforced Plastic Market Revenues & Volume By Building and Construction for the Period 2022-2032F
- Historical Data and Forecast of Jordan Glass Reinforced Plastic Market Revenues & Volume By Transportation for the Period 2022-2032F
- Historical Data and Forecast of Jordan Glass Reinforced Plastic Market Revenues & Volume By Electrical and Electronics for the Period 2022-2032F
- Historical Data and Forecast of Jordan Glass Reinforced Plastic Market Revenues & Volume By Oil and Gas for the Period 2022-2032F
- Historical Data and Forecast of Jordan Glass Reinforced Plastic Market Revenues & Volume By Mining for the Period 2022-2032F
- Historical Data and Forecast of Jordan Glass Reinforced Plastic Market Revenues & Volume By Water and Wastewater for the Period 2022-2032F
- Historical Data and Forecast of Jordan Glass Reinforced Plastic Market Revenues & Volume By Others for the Period 2022-2032F
- Jordan Glass Reinforced Plastic Import Export Trade Statistics
- Market Opportunity Assessment By Type
- Market Opportunity Assessment By Method
- Market Opportunity Assessment By Application
- Market Opportunity Assessment By End-Use
- Jordan Glass Reinforced Plastic Top Companies Market Share
- Jordan Glass Reinforced Plastic Competitive Benchmarking By Technical and Operational Parameters
- Jordan Glass Reinforced Plastic Company Profiles
- Jordan Glass Reinforced Plastic Key Strategic Recommendations
Frequently Asked Questions About the Market Study (FAQs):
The growth of the Jordan Glass Reinforced Plastic market is primarily driven by increasing demand for lightweight and durable materials in construction, automotive, and aerospace sectors, alongside technological advancements in manufacturing processes.
The Jordan Glass Reinforced Plastic market was estimated at USD 483 Million in 2025 and is projected to reach USD 633 Million by 2032, growing at a CAGR of 3.9% from 2026 to 2032.
Government initiatives in Jordan are pivotal, as they offer financial incentives, promote research, and set regulations that enhance product quality, thus creating a supportive environment for GRP manufacturers.
GRP is widely used in construction for products like water tanks and pipes, as well as in automotive components and aerospace applications, owing to its high strength-to-weight ratio and corrosion resistance.
Promising investment opportunities abound in manufacturing GRP components, supplying raw materials, and providing engineering services tailored to GRP projects, supported by the government’s focus on infrastructure development.
6Wresearch actively monitors the Jordan Glass Reinforced Plastic Market and publishes its comprehensive annual report, highlighting emerging trends, growth drivers, revenue analysis, and forecast outlook. Our insights help businesses to make data-backed strategic decisions with ongoing market dynamics. Our analysts track relevent industries related to the Jordan Glass Reinforced Plastic Market, allowing our clients with actionable intelligence and reliable forecasts tailored to emerging regional needs.
Yes, we provide customisation as per your requirements. To learn more, feel free to contact us on sales@6wresearch.com
1 Executive Summary |
2 Introduction |
2.1 Key Highlights of the Report |
2.2 Report Description |
2.3 Market Scope & Segmentation |
2.4 Research Methodology |
2.5 Assumptions |
3 Jordan Glass Reinforced Plastic Market Overview |
3.1 Jordan Country Macro Economic Indicators |
3.2 Jordan Glass Reinforced Plastic Market Revenues & Volume, 2022 & 2032F |
3.3 Jordan Glass Reinforced Plastic Market - Industry Life Cycle |
3.4 Jordan Glass Reinforced Plastic Market - Porter's Five Forces |
3.5 Jordan Glass Reinforced Plastic Market Revenues & Volume Share, By Type, 2022 & 2032F |
3.6 Jordan Glass Reinforced Plastic Market Revenues & Volume Share, By Method, 2022 & 2032F |
3.7 Jordan Glass Reinforced Plastic Market Revenues & Volume Share, By Application, 2022 & 2032F |
3.8 Jordan Glass Reinforced Plastic Market Revenues & Volume Share, By End-Use, 2022 & 2032F |
4 Jordan Glass Reinforced Plastic Market Dynamics |
4.1 Impact Analysis |
4.2 Market Drivers |
4.2.1 Increasing demand for lightweight and durable materials in construction and automotive industries |
4.2.2 Growing focus on eco-friendly and sustainable materials |
4.2.3 Technological advancements leading to improved strength and performance of glass reinforced plastic products |
4.3 Market Restraints |
4.3.1 Fluctuating raw material prices impacting production costs |
4.3.2 Lack of awareness and understanding about the benefits of glass reinforced plastic |
4.3.3 Competition from alternative materials such as steel and aluminum |
5 Jordan Glass Reinforced Plastic Market Trends |
6 Jordan Glass Reinforced Plastic Market, By Types |
6.1 Jordan Glass Reinforced Plastic Market, By Type |
6.1.1 Overview and Analysis |
6.1.2 Jordan Glass Reinforced Plastic Market Revenues & Volume, By Type, 2022-2032F |
6.1.3 Jordan Glass Reinforced Plastic Market Revenues & Volume, By Epoxy, 2022-2032F |
6.1.4 Jordan Glass Reinforced Plastic Market Revenues & Volume, By Polyester, 2022-2032F |
6.1.5 Jordan Glass Reinforced Plastic Market Revenues & Volume, By Vinyl Ester, 2022-2032F |
6.1.6 Jordan Glass Reinforced Plastic Market Revenues & Volume, By Polyurethane, 2022-2032F |
6.1.7 Jordan Glass Reinforced Plastic Market Revenues & Volume, By Others, 2022-2032F |
6.2 Jordan Glass Reinforced Plastic Market, By Method |
6.2.1 Overview and Analysis |
6.2.2 Jordan Glass Reinforced Plastic Market Revenues & Volume, By Moulding Method, 2022-2032F |
6.2.3 Jordan Glass Reinforced Plastic Market Revenues & Volume, By Pultrusion Method, 2022-2032F |
6.2.4 Jordan Glass Reinforced Plastic Market Revenues & Volume, By Layup, 2022-2032F |
6.2.5 Jordan Glass Reinforced Plastic Market Revenues & Volume, By Others, 2022-2032F |
6.3 Jordan Glass Reinforced Plastic Market, By Application |
6.3.1 Overview and Analysis |
6.3.2 Jordan Glass Reinforced Plastic Market Revenues & Volume, By Pipes and Tanks, 2022-2032F |
6.3.3 Jordan Glass Reinforced Plastic Market Revenues & Volume, By Wind Power Turbines, 2022-2032F |
6.3.4 Jordan Glass Reinforced Plastic Market Revenues & Volume, By Storage Containers, 2022-2032F |
6.3.5 Jordan Glass Reinforced Plastic Market Revenues & Volume, By Roofs, 2022-2032F |
6.3.6 Jordan Glass Reinforced Plastic Market Revenues & Volume, By Floor Gratings, 2022-2032F |
6.3.7 Jordan Glass Reinforced Plastic Market Revenues & Volume, By Steps and Stairs, 2022-2032F |
6.3.8 Jordan Glass Reinforced Plastic Market Revenues & Volume, By Others, 2022-2032F |
6.3.9 Jordan Glass Reinforced Plastic Market Revenues & Volume, By Others, 2022-2032F |
6.4 Jordan Glass Reinforced Plastic Market, By End-Use |
6.4.1 Overview and Analysis |
6.4.2 Jordan Glass Reinforced Plastic Market Revenues & Volume, By Building and Construction, 2022-2032F |
6.4.3 Jordan Glass Reinforced Plastic Market Revenues & Volume, By Transportation, 2022-2032F |
6.4.4 Jordan Glass Reinforced Plastic Market Revenues & Volume, By Electrical and Electronics, 2022-2032F |
6.4.5 Jordan Glass Reinforced Plastic Market Revenues & Volume, By Oil and Gas, 2022-2032F |
6.4.6 Jordan Glass Reinforced Plastic Market Revenues & Volume, By Mining, 2022-2032F |
6.4.7 Jordan Glass Reinforced Plastic Market Revenues & Volume, By Water and Wastewater, 2022-2032F |
7 Jordan Glass Reinforced Plastic Market Import-Export Trade Statistics |
7.1 Jordan Glass Reinforced Plastic Market Export to Major Countries |
7.2 Jordan Glass Reinforced Plastic Market Imports from Major Countries |
8 Jordan Glass Reinforced Plastic Market Key Performance Indicators |
8.1 Percentage increase in the adoption of glass reinforced plastic in construction and automotive projects |
8.2 Number of new product developments and innovations in the glass reinforced plastic market |
8.3 Growth in the number of partnerships and collaborations between manufacturers and end-users for product development and market expansion |
9 Jordan Glass Reinforced Plastic Market - Opportunity Assessment |
9.1 Jordan Glass Reinforced Plastic Market Opportunity Assessment, By Type, 2022 & 2032F |
9.2 Jordan Glass Reinforced Plastic Market Opportunity Assessment, By Method, 2022 & 2032F |
9.3 Jordan Glass Reinforced Plastic Market Opportunity Assessment, By Application, 2022 & 2032F |
9.4 Jordan Glass Reinforced Plastic Market Opportunity Assessment, By End-Use, 2022 & 2032F |
10 Jordan Glass Reinforced Plastic Market - Competitive Landscape |
10.1 Jordan Glass Reinforced Plastic Market Revenue Share, By Companies, 2025 |
10.2 Jordan Glass Reinforced Plastic Market Competitive Benchmarking, By Operating and Technical Parameters |
11 Company Profiles |
12 Recommendations |
13 Disclaimer |
Global Go To Market Strategy - 2030
Export potential enables firms to identify high-growth global markets with greater confidence by combining advanced trade intelligence with a structured quantitative methodology. The framework analyzes emerging demand trends and country-level import patterns while integrating macroeconomic and trade datasets such as GDP and population forecasts, bilateral import–export flows, tariff structures, elasticity differentials between developed and developing economies, geographic distance, and import demand projections. Using weighted trade values from 2020–2024 as the base period to project country-to-country export potential for 2030, these inputs are operationalized through calculated drivers such as gravity model parameters, tariff impact factors, and projected GDP per-capita growth. Through an analysis of hidden potentials, demand hotspots, and market conditions that are most favorable to success, this method enables firms to focus on target countries, maximize returns, and global expansion with data, backed by accuracy.
By factoring in the projected importer demand gap that is currently unmet and could be potential opportunity, it identifies the potential for the Exporter (Country) among 190 countries, against the general trade analysis, which identifies the biggest importer or exporter.
To discover high-growth global markets and optimize your business strategy:
Click Here
Pricing
- Single User License$ 1,995
- Department License$ 2,400
- Site License$ 3,120
- Global License$ 3,795

Leadership Perspectives from Industry Events
Search
Thought Leadership and Analyst Meet


Our Clients
6WResearch In News
- India Air Conditioner Market Set for Strong Rebound in 2026 After Weather-Led Correction and GST-Driven Recovery: 6Wresearch
- ADAS in India: How Automatic Emergency Braking, Blind Spot Detection & Driver Monitoring are Transforming Road Safety
- Doha a strategic location for EV manufacturing hub: IPA Qatar
- Demand for luxury TVs surging in the GCC, says Samsung
- Empowering Growth: The Thriving Journey of Bangladesh’s Cable Industry
- Demand for luxury TVs surging in the GCC, says Samsung
Latest Reports
- Nicaragua RPG Gaming Market (2026-2032)
- New Zealand RPG Gaming Market (2026-2032)
- Netherlands RPG Gaming Market (2026-2032)
- Nauru RPG Gaming Market (2026-2032)
- Namibia RPG Gaming Market (2026-2032)
- Mozambique RPG Gaming Market (2026-2032)
- Montenegro RPG Gaming Market (2026-2032)
- Mongolia RPG Gaming Market (2026-2032)
- Monaco RPG Gaming Market (2026-2032)
- Micronesia RPG Gaming Market (2026-2032)
Industry Events and Analyst Meet

EV India Expo 2026

HIMTEX 2026

India Refining Summit 2026

India EV Show 2026

EV tech India Expo 2026
Whitepaper
- Middle East & Africa Commercial Security Market Click here to view more.
- Middle East & Africa Fire Safety Systems & Equipment Market Click here to view more.
- GCC Drone Market Click here to view more.
- Middle East Lighting Fixture Market Click here to view more.
- GCC Physical & Perimeter Security Market Click here to view more.