Jordan Iron Castings Market (2026-2032) | Trends, Analysis, Industry, Growth, Size, Outlook, Forecast, Companies, Revenue, Share & Value
Market Forecast By Product (Gray Iron, Ductile Iron, Malleable Iron), By End-User (Automobile, Industrial Machinery, Infrastructure and Construction Machines, Power, Others) And Competitive Landscape
| Product Code: ETC041547 | Publication Date: Jan 2021 | Updated Date: Jun 2026 | Product Type: Report | |
| Publisher: 6Wresearch | Author: Ravi Bhandari | No. of Pages: 70 | No. of Figures: 35 | No. of Tables: 5 |
Jordan Iron Castings Market Summary
The jordan iron castings market was estimated at USD 446 Million in 2025 and is projected to reach USD 606 Million by 2032, growing at a CAGR of 5.4% from 2026 to 2032.
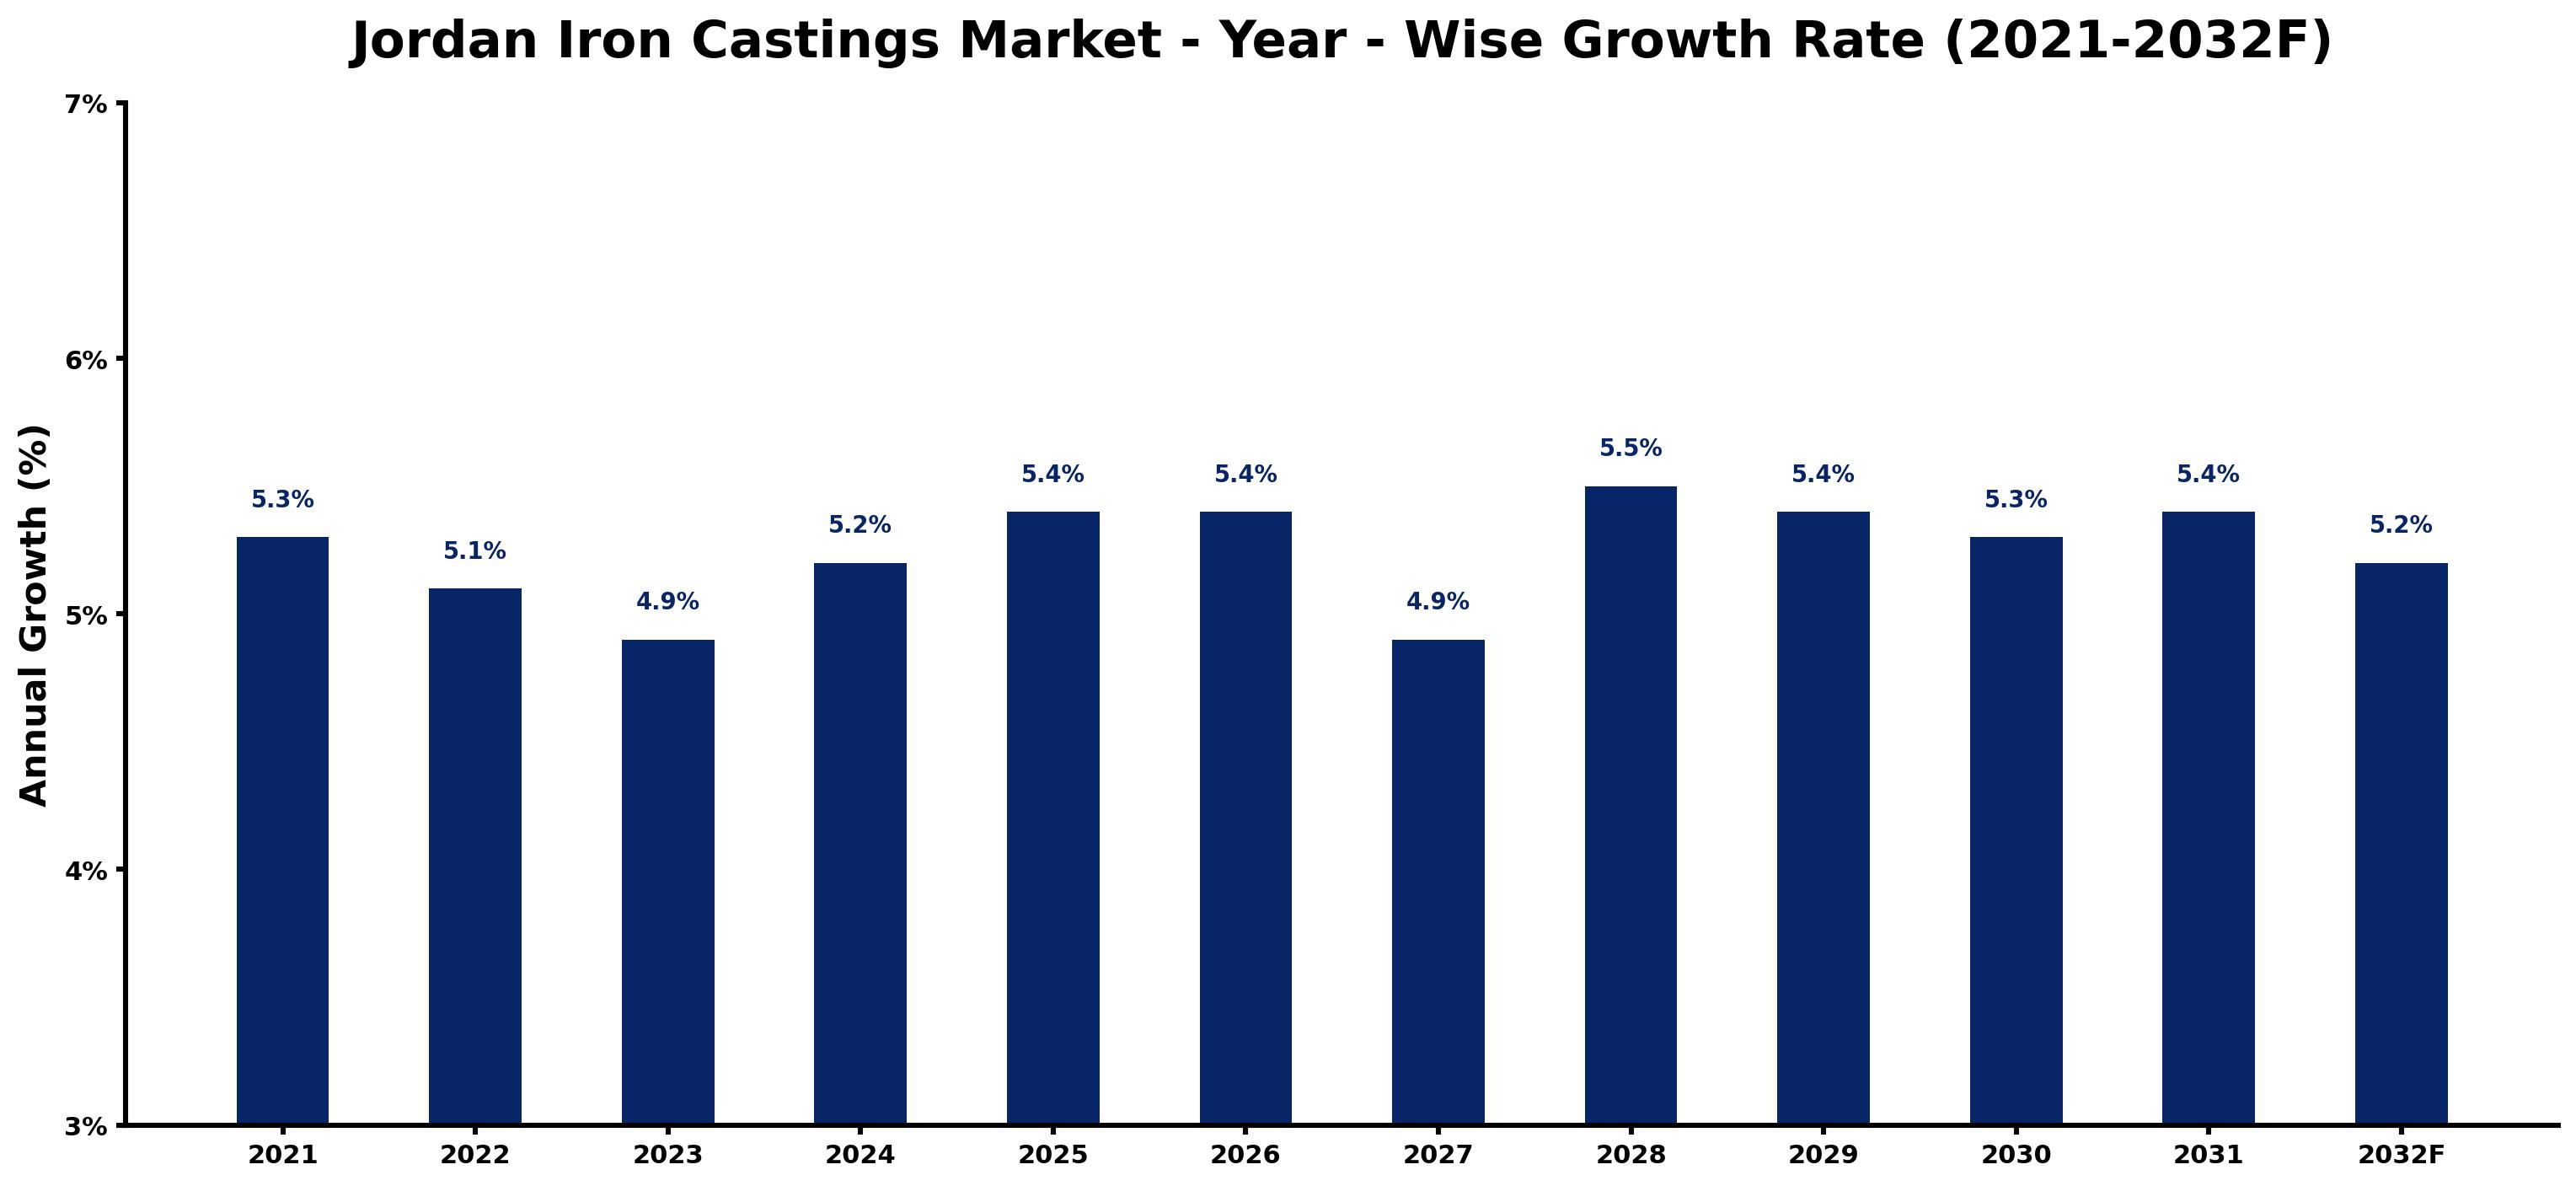
Jordan Iron Castings Market Growth Rate Analysis (2021-2032)
The Jordan Iron Castings market has shown a stable growth trend, with year-on-year growth rates fluctuating between 4.9% and 5.5% from 2021 to 2032. Starting at 5.3% in 2021, growth slightly declined to 4.9% in 2023 due to temporary supply chain disruptions and heightened costs in raw materials. However, recovery ensued, driven by renewed investments in infrastructure projects and a growing energy transition focus. By 2025 and 2026, growth rebounded to 5.4%, reflecting increased demand from manufacturing sectors emphasizing efficiency and sustainability. Anticipated growth persists, with similar performance expected in subsequent years, reinforced by technological advancements and rising consumer demand for durable, high-quality castings.
Jordan Iron Castings Market Year-wise Growth Rate and Key Drivers
This graph highlights how the Jordan Iron Castings Market has steadily grown over the past five years, supported by major growth factors.
The table below presents the year wise growth rates along with the key drivers influencing the market
| Year | Growth Rate | Major Drivers |
| 2021 | 5.3% | Manufacturers faced supply chain disruptions, impacting timely product availability and pricing. |
| 2022 | 5.1% | Post-pandemic recovery saw increased investment in infrastructure across various sectors. |
| 2023 | 4.9% | Focus on sustainable practices encouraged innovations in iron casting techniques and materials. |
| 2024 | 5.2% | Emerging markets in the region began prioritizing local production to reduce imports. |
| 2025 | 5.4% | Construction activities surged, especially in urban centers and industrial zones in Jordan. |
| 2026 | 5.4% | Technological advancements in automation enhanced production efficiency in casting facilities. |
| 2027 | 4.9% | Increasing regional collaborations fostered knowledge exchange and investment in local innovations. |
| 2028 | 5.5% | Market diversification pushed companies to explore new applications for iron castings. |
| 2029 | 5.4% | Local demand for automotive components began driving growth in specific casting sectors. |
| 2030 | 5.3% | Environmental regulations prompted firms to adopt greener practices in production processes. |
| 2031 | 5.4% | Shift towards smart manufacturing allowed for more precise casting techniques and quality control. |
| 2032 | 5.2% | Jordan's strategic location attracted foreign investments, strengthening the iron castings supply chain. |
Note - Market size estimations and growth projections presented in this report are based on 6Wresearch's advanced forecasting approach, validated with industry datasets as of June 2026.
Jordan Iron Castings Market Synopsis
The Jordan Iron Castings Market is projected to reach 5.4% and witness significant growth during the forecast period (2026-2032). This market is buoyed by robust demand across key sectors including automotive, machinery, construction, and infrastructure development. The increasing necessity for high-quality iron castings for industrial applications underpins market expansion, supported by local foundries that provide a diverse range of products, such as gray iron, ductile iron, and malleable iron components. Furthermore, the evolution of global trends in iron casting technology, alongside stringent regulatory frameworks and a growing emphasis on environmental stewardship, are critical factors shaping the landscape of the Jordan Iron Castings Market.
Jordan Iron Castings Market Growth Drivers
Several key drivers are propelling the growth of the Jordan Iron Castings Market. Notably:
- The resurgence of the automotive industry in Jordan necessitates innovative and durable iron castings, thereby amplifying demand.
- Ongoing infrastructure projects, including roads, bridges, and commercial buildings, require high-quality iron castings, contributing significantly to market growth.
- Local manufacturers are increasingly investing in advanced production techniques, enhancing efficiency and the overall quality of iron castings.
- The shift towards sustainable manufacturing practices is influencing market dynamics, promoting the use of environmentally friendly materials and techniques.
- Enhanced collaboration between stakeholders within the industry fosters innovation and the development of more specialized iron casting solutions.
Jordan Iron Castings Market Trends and Opportunities
The Jordan Iron Castings Market is witnessing several notable trends that present new opportunities. One significant trend is the increasing demand for lightweight iron castings, particularly in sectors like automotive and aerospace, where high strength-to-weight ratios are essential. Furthermore:
- The rise of 3D printing technologies is transforming the design and manufacturing processes of iron castings, improving efficiency and reducing waste.
- Investments in digital simulation software are allowing manufacturers to optimize their production methods, leading to cost savings.
- There is a concerted effort across the industry to integrate sustainable practices, including the use of recyclable materials in iron casting production.
- Regional trade agreements are presenting new market avenues for local foundries, facilitating exports to broader Middle Eastern and global markets.
Jordan Iron Castings Market Challenges and Restraints
Despite its growth potential, the Jordan Iron Castings Market faces several challenges. Key challenges include:
- Intense competition from alternative manufacturing processes, such as steel and aluminum casting, which could hinder market share growth.
- Volatility in raw material costs, particularly for iron ore and scrap metal, poses a risk to production costs and profitability.
- Maintaining rigorous quality control is essential; any lapse could impact customer satisfaction and damage reputations.
- The industry currently grapples with a skills shortage, making it difficult to find labor equipped with specialized knowledge in iron casting techniques.
- Compliance with evolving environmental regulations requires continuous investment, adding pressure to operational budgets.
Jordan Iron Castings Market Government Investment and Initiatives
The Jordanian government has implemented various proactive measures to enhance the iron castings sector. These include:
- Financial incentives, such as tax breaks and grants, are provided to encourage investment in iron foundries and related infrastructure.
- Research and development initiatives are being promoted to improve the competitiveness of local manufacturers in the global marketplace.
- Regulatory frameworks are being established to enforce environmental sustainability standards in iron casting production.
- Streamlining of bureaucratic procedures aims to simplify the establishment and operation of new businesses within the sector.
- Significant public spending is directed toward infrastructure development, further driving demand for locally produced iron castings.
Jordan Iron Castings Market Latest Developments (May 2025 - June 2026)
Recent developments in the Jordan Iron Castings Market from May 2025 to June 2026 indicate a forward momentum in technological adoption and regulatory enhancements. Manufacturers are increasingly integrating automated processes to improve production efficiency. The market has also seen a heightened focus on sustainability, with companies exploring eco-friendly materials and methods. Furthermore, collaboration between government bodies and industry stakeholders has strengthened, fostering innovation and resource sharing. Such developments reflect a commitment to addressing market challenges while leveraging new opportunities to enhance growth.
Jordan Iron Castings Market - Key Attractiveness of the Report
- 10 Years of Market Numbers
- Historical Data Starting from 2022 to 2025
- Base Year: 2025
- Forecast Data until 2032
- Key Performance Indicators Impacting the Market
- Major Upcoming Developments and Projects
Key Highlights of the Report:
- Jordan Iron Castings Market Outlook
- Market Size of Jordan Iron Castings Market, 2025
- Forecast of Jordan Iron Castings Market, 2032F
- Historical Data and Forecast of Jordan Iron Castings Revenues & Volume for the Period 2022-2032F
- Jordan Iron Castings Market Trend Evolution
- Jordan Iron Castings Market Drivers and Challenges
- Jordan Iron Castings Price Trends
- Jordan Iron Castings Porter's Five Forces
- Jordan Iron Castings Industry Life Cycle
- Historical Data and Forecast of Jordan Iron Castings Market Revenues & Volume By Product for the Period 2022-2032F
- Historical Data and Forecast of Jordan Iron Castings Market Revenues & Volume By Gray Iron for the Period 2022-2032F
- Historical Data and Forecast of Jordan Iron Castings Market Revenues & Volume By Ductile Iron for the Period 2022-2032F
- Historical Data and Forecast of Jordan Iron Castings Market Revenues & Volume By Malleable Iron for the Period 2022-2032F
- Historical Data and Forecast of Jordan Iron Castings Market Revenues & Volume By End-User for the Period 2022-2032F
- Historical Data and Forecast of Jordan Iron Castings Market Revenues & Volume By Automobile for the Period 2022-2032F
- Historical Data and Forecast of Jordan Iron Castings Market Revenues & Volume By Industrial Machinery for the Period 2022-2032F
- Historical Data and Forecast of Jordan Iron Castings Market Revenues & Volume By Infrastructure and Construction Machines for the Period 2022-2032F
- Historical Data and Forecast of Jordan Iron Castings Market Revenues & Volume By Power for the Period 2022-2032F
- Historical Data and Forecast of Jordan Iron Castings Market Revenues & Volume By Others for the Period 2022-2032F
- Jordan Iron Castings Import Export Trade Statistics
- Market Opportunity Assessment By Product
- Market Opportunity Assessment By End-User
- Jordan Iron Castings Top Companies Market Share
- Jordan Iron Castings Competitive Benchmarking By Technical and Operational Parameters
- Jordan Iron Castings Company Profiles
- Jordan Iron Castings Key Strategic Recommendations
Frequently Asked Questions About the Market Study (FAQs):
Iron castings in Jordan are predominantly used in the automotive, machinery, construction, and infrastructure sectors, where durability and precision are critical.
The government is offering financial incentives, promoting R&D, and establishing regulations to ensure quality and environmental compliance, all aimed at bolstering the iron castings industry.
Manufacturers face challenges such as competition from alternative materials, fluctuating raw material prices, and the need for strict quality control and skilled labor.
Key trends include the growing demand for lightweight castings, the adoption of advanced manufacturing technologies, and a focus on sustainability within the industry.
6Wresearch actively monitors the Jordan Iron Castings Market and publishes its comprehensive annual report, highlighting emerging trends, growth drivers, revenue analysis, and forecast outlook. Our insights help businesses to make data-backed strategic decisions with ongoing market dynamics. Our analysts track relevent industries related to the Jordan Iron Castings Market, allowing our clients with actionable intelligence and reliable forecasts tailored to emerging regional needs.
Yes, we provide customisation as per your requirements. To learn more, feel free to contact us on sales@6wresearch.com
1 Executive Summary |
2 Introduction |
2.1 Key Highlights of the Report |
2.2 Report Description |
2.3 Market Scope & Segmentation |
2.4 Research Methodology |
2.5 Assumptions |
3 Jordan Iron Castings Market Overview |
3.1 Jordan Country Macro Economic Indicators |
3.2 Jordan Iron Castings Market Revenues & Volume, 2022 & 2032F |
3.3 Jordan Iron Castings Market - Industry Life Cycle |
3.4 Jordan Iron Castings Market - Porter's Five Forces |
3.5 Jordan Iron Castings Market Revenues & Volume Share, By Product, 2022 & 2032F |
3.6 Jordan Iron Castings Market Revenues & Volume Share, By End-User, 2022 & 2032F |
4 Jordan Iron Castings Market Dynamics |
4.1 Impact Analysis |
4.2 Market Drivers |
4.3 Market Restraints |
5 Jordan Iron Castings Market Trends |
6 Jordan Iron Castings Market, By Types |
6.1 Jordan Iron Castings Market, By Product |
6.1.1 Overview and Analysis |
6.1.2 Jordan Iron Castings Market Revenues & Volume, By Product, 2022-2032F |
6.1.3 Jordan Iron Castings Market Revenues & Volume, By Gray Iron, 2022-2032F |
6.1.4 Jordan Iron Castings Market Revenues & Volume, By Ductile Iron, 2022-2032F |
6.1.5 Jordan Iron Castings Market Revenues & Volume, By Malleable Iron, 2022-2032F |
6.2 Jordan Iron Castings Market, By End-User |
6.2.1 Overview and Analysis |
6.2.2 Jordan Iron Castings Market Revenues & Volume, By Automobile, 2022-2032F |
6.2.3 Jordan Iron Castings Market Revenues & Volume, By Industrial Machinery, 2022-2032F |
6.2.4 Jordan Iron Castings Market Revenues & Volume, By Infrastructure and Construction Machines, 2022-2032F |
6.2.5 Jordan Iron Castings Market Revenues & Volume, By Power, 2022-2032F |
6.2.6 Jordan Iron Castings Market Revenues & Volume, By Others, 2022-2032F |
7 Jordan Iron Castings Market Import-Export Trade Statistics |
7.1 Jordan Iron Castings Market Export to Major Countries |
7.2 Jordan Iron Castings Market Imports from Major Countries |
8 Jordan Iron Castings Market Key Performance Indicators |
9 Jordan Iron Castings Market - Opportunity Assessment |
9.1 Jordan Iron Castings Market Opportunity Assessment, By Product, 2022 & 2032F |
9.2 Jordan Iron Castings Market Opportunity Assessment, By End-User, 2022 & 2032F |
10 Jordan Iron Castings Market - Competitive Landscape |
10.1 Jordan Iron Castings Market Revenue Share, By Companies, 2025 |
10.2 Jordan Iron Castings Market Competitive Benchmarking, By Operating and Technical Parameters |
11 Company Profiles |
12 Recommendations |
13 Disclaimer |
Global Go To Market Strategy - 2030
Export potential enables firms to identify high-growth global markets with greater confidence by combining advanced trade intelligence with a structured quantitative methodology. The framework analyzes emerging demand trends and country-level import patterns while integrating macroeconomic and trade datasets such as GDP and population forecasts, bilateral import–export flows, tariff structures, elasticity differentials between developed and developing economies, geographic distance, and import demand projections. Using weighted trade values from 2020–2024 as the base period to project country-to-country export potential for 2030, these inputs are operationalized through calculated drivers such as gravity model parameters, tariff impact factors, and projected GDP per-capita growth. Through an analysis of hidden potentials, demand hotspots, and market conditions that are most favorable to success, this method enables firms to focus on target countries, maximize returns, and global expansion with data, backed by accuracy.
By factoring in the projected importer demand gap that is currently unmet and could be potential opportunity, it identifies the potential for the Exporter (Country) among 190 countries, against the general trade analysis, which identifies the biggest importer or exporter.
To discover high-growth global markets and optimize your business strategy:
Click Here
Pricing
- Single User License$ 1,995
- Department License$ 2,400
- Site License$ 3,120
- Global License$ 3,795

Leadership Perspectives from Industry Events
Search
Thought Leadership and Analyst Meet


Our Clients
6WResearch In News
- India Air Conditioner Market Set for Strong Rebound in 2026 After Weather-Led Correction and GST-Driven Recovery: 6Wresearch
- ADAS in India: How Automatic Emergency Braking, Blind Spot Detection & Driver Monitoring are Transforming Road Safety
- Doha a strategic location for EV manufacturing hub: IPA Qatar
- Demand for luxury TVs surging in the GCC, says Samsung
- Empowering Growth: The Thriving Journey of Bangladesh’s Cable Industry
- Demand for luxury TVs surging in the GCC, says Samsung
Latest Reports
- Nicaragua RPG Gaming Market (2026-2032)
- New Zealand RPG Gaming Market (2026-2032)
- Netherlands RPG Gaming Market (2026-2032)
- Nauru RPG Gaming Market (2026-2032)
- Namibia RPG Gaming Market (2026-2032)
- Mozambique RPG Gaming Market (2026-2032)
- Montenegro RPG Gaming Market (2026-2032)
- Mongolia RPG Gaming Market (2026-2032)
- Monaco RPG Gaming Market (2026-2032)
- Micronesia RPG Gaming Market (2026-2032)
Industry Events and Analyst Meet

HIMTEX 2026

India Refining Summit 2026

India EV Show 2026

EV tech India Expo 2026

Auto Tech Asia 2026
Whitepaper
- Middle East & Africa Commercial Security Market Click here to view more.
- Middle East & Africa Fire Safety Systems & Equipment Market Click here to view more.
- GCC Drone Market Click here to view more.
- Middle East Lighting Fixture Market Click here to view more.
- GCC Physical & Perimeter Security Market Click here to view more.